Abstract. The growing importance of on-board diagnosis for automobiles demands for new diagnostic methodologies and techniques and for a close integration ...
Thema
Knowledge-based Systems in Motion P. Struss Computer Science Deptartment, Technical Univ. of Munich, Germany, OCC’M Software GmbH, Deisenhofen, Germany
Abstract The growing importance of on-board diagnosis for automobiles demands for new diagnostic methodologies and techniques and for a close integration of diagnostic tasks in the entire design process. This report describes work carried out within two European projects. In the „Vehicle Model based Diagnosis“ (VMBD) project, demonstrator vehicles with built-in faults provided a serious challenge to model-based diagnosis techniques and a real-life test-bed for their evaluation. One of the guiding applications within VMBD was model-based on-board diagnosis of faults in a turbo diesel engine system with a focus on potential origins of increased carbon emissions. The second, still on-going, project, „Integrated Design Process for onboard Diagnosis„ (IDD) developed a model of a new design process which allows for a better integration of diagnosis related tasks, such as diagnosability analysis, failure-modes-and-effects analysis (FMEA), on-board diagnosis design, in the overall design process of mechatronic subsystems. We discuss in what way modelbased technology can provide tools to support the actual integration and, in particular, present an approach to model-based diagnosability analysis.. Introduction Research on model-based diagnosis (e.g. [7], [6]) has generated a number of well-founded theories and sophisticated prototypes of implemented diagnosis engines. However, many of these diagnosis systems have only been applied to toy examples or to problems that ignored the practical context of industrial applications. As a result, the transfer of the technology into practice is well behind the expectations, despite the fact that it promises to meet some crucial requirements of automated diagnosis for industrial needs. Car industries provides a good example of such 22
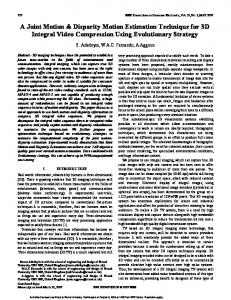
The VMBD Project industrial needs. It is estimated that European The Brite-EuRam joined several car passenger cars have an average yearly down-time manufacturers and suppliers project VMBD of 16 working hours due to malfunctions and (Vehicle Model Based Diagnosis) with the maintenance. This figure is even greater for intention to promote the transfer of model-based commercial vehicles. For the European diagnosis technology by the challenge of Community alone, this amounts to a total of applying it to on-board and off-board diagnosis over one billion hours for diagnosis and repair. of passenger cars. The results and system At the same time, with increased environmental performance were evaluated on real demonstrator awareness, stricter constraints are imposed on vehicles. Within this project, Volvo Car the car manufacturers to develop clean cars, and Corporation, Robert Bosch GmbH, and OCC’M also to keep them clean during their life cycle Software GmbH produced a model-based system (see, for example, [8]). These growing constraints that diagnoses problems related to increased are reflected in increased requirements on oncarbon emissions of diesel engines, a problem of board diagnostics development. For engine significant importance w.r.t. environmental management control units, currently about one impact and compliance with legal requirements. half of the software is dedicated to diagnosis, The system transforms the sensor signals that and this share is still growing. are available to the standard electronic control This contribution presents work on transferring unit (ECU) on-board to a qualitative level and model-based systems technology to industrial exploits them for detecting and localizing faults practice in order to provide a new methodology based on a model of the turbo control system. It and new software solutions that are required to has been installed on a Volvo demonstrator address the needs for both reliable and efficient vehicle with a number of built-in faults. diagnostics of vehicles and systematic and Figure 1 shows the part of the system which is economic processes for generating them. responsible for supplying air to the diesel engine. We first describe the realization of a prototype It can be decomposed into the exhaust gas of a model-based on-board diagnosis system within the Brite-EuRam project VMBD (Vehicle Model Based Diagnosis) and its theoretical and technical foundations. Next, we present the objectives and intermediate results of the ongoing European Fifth Framework project „Integrated Design Process for onboard Diagnosis“ (IDD) which aims at developing tools for the designers of on-board Fig.1: Turbo control and exhaust gas recirculation subsystem of the DTI systems. Telematik 2/2002
Thema
recirculation (EGR) subsystem (upper part of Figure 1) and the turbo control subsystem (lower part of Figure 1). The purpose of the exhaust gas re-circulation system is to return a certain amount of the exhaust gas to the intake air to decrease the oxygen rate of the intake air and thus to reduce emission levels of the fuel combustion. Depending on driving conditions, the ECU governs the EGR converter to achieve a certain air pressure in a control pipe, which in turn sets the position of the exhaust gas re-circulation valve. The position of this re-circulation valve then determines how much of the exhaust gas is fed back to the air intake pipe. The turbo control subsystem consists of a turbo-charger turbine, which is driven by the engine’s exhaust gas, for compressing (and thereby increasing the mass of) the air taken into the engine. The ECU controls the boost pressure (i.e. the pressure in the engine intake pipe) admitted in a certain driving situation by opening or closing the turbo control valve, which determines the position of a so-called waste-gate valve. The position of this valve determines how much of the exhaust gas drives the exhaust turbine of the turbo-charger. The ECU not only issues commands to the actuators, but also monitors and checks the sensor values it receives from these systems. The goal of this so-called on-board diagnosis is to signal alarms to warn the driver in case of a failure and to generate fault codes that can be further used in the service bays to track down a failure. In accordance with the overall thrust of the project, our goal thus was to produce a prototypical model-based diagnosis system that is capable of diagnosing faults in the diesel engine based on the sensor signals that are available to the ordinary ECU, z to this end, generate a library of models of the relevant components, and z to perform this task in a systematic way as a contribution to a general methodology for producing on-board diagnostics. z
Fig.2: Consistency-based approach to diagnosis Telematik 2/2002
In the following, we briefly outline the key idea of the approach to diagnosis and summarize the result of the experiments. For more details, we refer to [10]. Consistency-based Diagnosis Techniques In a nutshell, the standard, so-called consistency-based approach to diagnosis ([5], [6]) can be described as follows (see Figure 2): Observations of the actual Fig.3: Automated generation of model-based diagnostic systems behavior of the system are approach in our application domain. Beyond this, entered. it is the key to solving the variant problem, z Based on the device model, conclusions are because the model of a subsystem is derived as computed about system parameters and vathe aggregation of standard building blocks. This riables (observed and unobserved). For each is another element of a general methodology and derived prediction, the set of component enables the automated generation of a device models involved in it is recorded. This model and, hence, of a tailored diagnosis system information can be determined by the based on a structural description of the device diagnosis system because the device model only (which should be the natural output of a has a structure that reflects the device CAD system). A way of creating diagnostics for constituents. all variants of vehicle subsystems is thus obtained z If a contradiction is detected, i.e. conflicting that is systematic as well as efficiently supported conclusions for a variable occur (fault by computer tools. Figure 3 illustrates this idea. detection), the set of components involved For diagnostic purposes, faults can be described in it indicates which components possibly as certain component failures, and fault models deviate from their intended behavior. associated with the respective components. This z Diagnosis hypotheses are generated, i.e. sets provides a principled way of capturing of faulty components that account for all knowledge about faults in a modular way which detected contradictions (fault localization). contrasts other approaches in AI (based on z In case models of faulty behavior are storing associations between symptoms and provided, the same approach (checking faults for each device in terms of rules or cases) consistency of a model with the or engineering (trying to identify parameter observations) can be used to discard deviations in a closed mathematical model of the particular faults (fault identification) or to entire device). conclude correctness of certain components if the set of modeled faults is considered Since a component model is meant to be used complete. within the contexts of various devices, it has to capture a behavior description which must not This diagnosis framework has the desired presume a specific context and, particularly, not property to systematically exploit the analytic the correct functioning of the rest of the device. redundancy among the available sensor signals. The strict discipline in modeling required to The model-based approach alone provides one achieve this goal is another important element of answer to the methodological challenge, because the methodology. its underlying principles (and the implementation) are independent of the It is interesting to note that we need not to build particular subsystem and enable a model of the control unit behavior itself, unless the re-use of the involved we want to detect faults in the ECU. Due to the software components. Genefact that the model runs within an on-board rating a specific diagnostic environment, all the control unit’s signals will be system is thus reduced to available for observation. Consequently, a generating an appropriate model behavior model of the control unit could never of the system to be diagnosed. be part of a diagnostic hypothesis, and would As stated above, componenttherefore be useless. oriented modeling is a natural z
23
Thema
Evaluation on the Demonstrator Vehicle The software for the on-board diagnosis prototype consists of two components: a module for the conversion of raw signals into qualitative observations, and z a model-based run-time system that performs diagnosis on the basis of these observations. z
This was based on components of the commercial RAZ’R system of OCC’M Software that offers a development environment for diagnostic models as well as a run-time version of a consistency-based diagnosis engine ([9]). In the VMBD project, a Volvo 850 TDI demonstrator car was made available for handson experimentation with the DTI application. Failures can be induced in the car during various operational conditions of the engine with the model-based diagnosis system running, and the results can be compared with the conventional diagnostic capabilities of the control unit. The various failures in the demonstrator car can be adjusted by potentiometers and triggered by switchboards from inside the passenger compartment (see Figure 4). A pneumatic leakage, for example, is simulated by additional valves opened and closed by electrical switches.
Fig.4: View of the Volvo Demonstrator Car showing the notebook connected to the ECU. The glove compartment (behind) contains the switchboard for controlling the built-in faults. We were particularly interested in failures that were not captured by existing on-board diagnostics. Since increased legislative and customer demands have lead to new requirements especially for aspects related to emissions and performance of the system in the Volvo car, we concentrated on effects that involve incomplete fuel combustion and increased carbon emissions due to an excessive quantity of fuel injected or insufficient airflow to the engine (called „black smoke“ problems). Types of failures which can 24
lead to black smoke symptoms involve leakages Figure 5 shows the diagnostic results for a slowly in pipes, malfunctions of valves (e.g. stuck-atopening leakage during stalling the engine. The open or stuck-at-closed), increased friction in upper part of the window shows the control bearings (resulting in a delay of actuators) or unit signals listed above. The measurement runs signal disturbances due to electrical failures. for 9.75 seconds and yields 1064 quantitative One scenario in the demonstrator car consists of observation vectors. The signal transformation a leakage in the air hose between the turbine outlet module reduces them to only 12 qualitative and the engine intake manifold. The scenario was observation vectors (indicated by the small realized in the car by installing an electric motor „peaks“ at the base of the signal window). which opens a valve to release pressure from the inter-cooler system via a 12mm opening. If the leakage is opened, air (oxygen) mass is lost after having passed the air mass sensor. The fuel quantity calculated by the control unit which is based on this signal will therefore be too high for the actual amount of oxygen in the combustion chamber. This leads to incomplete Fig.5: Screenshot of the model-based run-time diagnosis prototype for the combustion of the DTI turbo control subsystem diesel fuel, which causes increased carbon emissions in the exhaust The two single fault hypotheses generated by gas (due to non-burnt particles) and reduces the the system contain the component where the torque of the engine. This effect is, depending on failure was actually induced („Junction3“, see the driving condition, perceivable for the driver mark in Figure 5 within the window depicting as black smoke emerging from the exhaust the system structure). system. The runtime for the example (on a Windows/ Pentium PC) is 25,85 seconds without using temFrom the available control unit data, the following poral caching, and 2,87 seconds if temporal subset of signals was fed to the prototype for caching is activated. This means that, for this diagnosing the described scenarios: example, the performance of the on-board system is in the order of magnitude of real-time. In summary, this demonstrator, like two others z atmospheric pressure sensor signal produced in VMBD (see [4], [1]), successfully z boost pressure sensor signal proved the feasibility of model-based techniques z mass airflow sensor signal for on-board diagnostics of vehicles. z engine speed sensor signal z duty cycle of the turbo control valve The IDD Project z current fuel quantity injected. The results of the VMBD project triggered the interest of the European car industry in further The on-board diagnosis prototype uses only steps towards the introduction of the technology these control unit signals, and no further signals into industrial practice. This requires to refer to from additional sensors. The current control unit the actual industrial work processes related to software in the turbo control system is not able the design and implementation of on-board to detect any of the above failures based on the diagnostics. same signals. The frequency at which the control At present, there is no correspondence between unit reads the signals from the sensors varies the important role of diagnosis in onboard with the speed of the engine, therefore the time systems and a similar role that diagnosis should points at which observations occur are not evenly play in the design process chain. distributed. Telematik 2/2002
Thema
The European Fifth Framework project „Integrated Design Process for onboard Diagnosis“ (IDD) pursues the goal to formalize and standardize the diagnostic design process, and to enable the introduction of diagnosis early in the chain. This methodological goal has to be combined with another important objective: giving to the designers a set of model-based tools that can help them in evaluating and understanding the effects of each choice on the system being designed. The IDD project was started February 2000 with a duration of three years and involves both industrial and academic partners: Fiat CRF (Torino), Magneti-Marelli SpA (Torino), PSA, Peugeot Citroen (Paris), Renault (Paris), DaimlerChrysler AG (Stuttgart), OCC’M Software GmbH (München), Universita di Torino, Université de Paris Nord, XIII, and Technische Universität München.
tasks, despite the fact that there are important interdependencies. As a consequence, requirements and constraints arising from one of these tasks can be dealt with by the other ones only in the next inner design loop, i.e. changes in the design of control algorithms can have impact on FMEA/ diagnosis only during the next inner design loop and vice versa, thus causing additional iterations and time delay.
that these tasks can be effectively supported or automated by computer tools based on the model, i.e. they have to be model-based tools.
These tools rely on model-based systems and will be based on a common set of models and a common model-based diagnostic system core. The new process and the respective tools should be integrated or combined with the simulation tools, that are currently used for the design of control strategies and typically based on quantitative models. In IDD, this is Matlab/Simulink. This requires software that transforms the models created in these environments into qualitative diagnostic models that form the basis for the model-based tools. The foundations of one of the implementations and a critical discussion of the practical experiences are presented in [11]. Figure7 summarizes the overall architecture of Fig.6: The reference process, one iteration of the inner design loop the new design support system .
Analysis of the Current Process of Design and Generation of Diagnostics The project started with an analysis of the current processes of each industrial partners with a focus on the integration of the diagnostic process and diagnosis-related processes into the whole design process of mechatronic subsystems. Based on this analysis, a „merged process“ has been developed that is based on the similarities recognized, ignoring details and small differences. The abstraction of this process is used as a comprehensive reference for the current design processes. This analysis and its consequences are presented in more detail in [2]. The core process the project is focused on is the „inner design loop“ which is concerned with the design of the ECU-based control system and components. Each iteration involves the design of the control algorithms, failure-modes-andeffects analysis (FMEA), diagnostic development, implementation of the ECU (hardware and software) and verification of the algorithms, as shown in Figure 6. The verification step at the end of the first iterations is performed using models (software/ hardware in the loop), whereas, later, the physical system is used. Depending on the achieved results, there are several iterations, each one of them producing an advanced prototype. A major deficiency of the current practice concerns the interaction between FMEA and the development of diagnostics on the one hand, and the development and design of control algorithms of the system on the other hand. Currently, these are carried out as two substantially separate Telematik 2/2002
Tools for a New Process Based on the analysis of the reference process and the required improvements, we propose a frame for a new process which is closely connected to a new tool architecture. In summary, the framework for a new process has to satisfy the requirement that the designers (the different experts involved in the design) should be supported in performing the different activities in an interleaved way and in evaluating different designs and in making choices about the best design of a system.
Fig.7: Tools architecture for the new process
Such a tight integration of different activities and the aim to perform them concurrently require the fast and reliable exchange of information about any changes in the design introduced by any of the activities. This is why we propose that the model of the system being designed must play a central role in the new process. z The aims to update FMEA, diagnosability analysis and OBD generation quickly after a change and to consider different design alternatives in parallel establishes the requirement z
In the following, we discuss the foundations for the diagnosability analysis tool that forms a specific contribution of the project, in a little more detail. Diagnosability Analysis Engine Diagnosability analysis is expected to answer two different types of questions: „For a particular design and a chosen set of sensors, determine: 25
Thema
Fault detectability, i.e. whether and under which circumstances the possible faults considered can be detected (by the ECU) z Fault (class) discriminability, i.e. whether and under which circumstances the ECU is able to distinguish different classes of faults.“ z
The second question is a generalization of the fault identification task („Determine the present fault mode unambiguously“). This generalization is motivated by on-board diagnosis requirements: full fault identification is usually not possible and also not required for on-board purposes, since there is a limited set of possible recovery actions that can be performed by the control unit and which are to be selected dependent on the general type of fault and its severity rather than the individual fault. For instance, only certain critical faults may require immediate shut-off of the engine while others allow continued operation possibly under certain limitations. Also off-board diagnosis is appropriately characterized as fault class discrimination where the classes comprise the faults of the various smallest replaceable units. More generally, diagnosis is usually a discrimination task whose goal is defined by the available „therapy“ actions. Discriminability is the fundamental task, because detectability can be formulated as discriminability from the normal behavior. Although the ultimate goal is to discriminate classes of behavior modes from each other, the analysis has to based on the discriminability of each pair of individual faults taken from any pair of classes, which is unfortunate from a computational point of view. In our framework, (fault) behavior modes are represented as finite relations, and discriminability analysis becomes the task of computing the observable distinctions between two relations. So, let Vobs be the set of observable variables. In an on-board situation, this corresponds to the set of actuator and sensor signals. Since we want to characterize the situations under which detection or discrimination is possible, we introduce a set of variables Vcause that are exogenous or „causal „ variables w.r.t. the physical system (i.e. the subsystem excluding the ECU). This set includes the actuator signals but also other quantities that influence the behavior of the physical system. Some of the latter may be observables, e.g. the atmospheric pressure, while other are not (directly) measurable, such as the load. Since onboard diagnosis can rely only on what is observable to the ECU, we define: 26
and
Vo-cause =Vobs ∩ Vcause Vobs\cause = Vobs \ Vcause
individual modes of required to determine the discriminability of classes of modes. Consider the trivial example of one inverter with two mode classes:
as well as the respective projections, PROJobs, C1 ={output-stuck-0, output-stuck-1}, PROJo-cause. The abstract example in Figure 8 will provide an C2 ={shorted, ok}. intuition about possible answers to the discriminability question. The vertical axis Figure 9a and b display the four faults in the represents the observable causal variables and observable space i, o, grouped in the two classes. the horizontal axis the remaining observables. There may be many unobservable variables, but the shown projection to the space of observables is all that matters. Two different fault modes ( or, more generally, behavior modes) are represented by two relations. As illustrated by the figure, we can distinguish three different Fig.9: Behavior classes of the inverter for fault classes C1 (a) and cases: C2 (b) z· In the upper section the relations cover each
other, i.e. for any causal stimulus in the projection of this intersection area, the observable set of consistent tuples for the two behavior modes are the same, and, hence, they cannot be discriminated from each other. z In the lower section, they are totally disjoint, i.e. any of the respective causal inputs always leads to different system behavior and, thus, deterministically discriminates between the two modes. z For all other causal inputs, the two modes can possibly be discriminated, because the actual response of the system may be outside one of the relations, but is not guaranteed to.
Fig.8 Three categories of discriminability of two behavior modes With this translation of the task to the analysis of relations, we can also support our previous claim, that, in general, a pairwise comparison of
Obviously, the faults are pairwise discriminable, and, hence, so are the two classes of faults. However, if we would try to represent each class as the disjunction of its modes and associate with it the union of the respective relations, then both of these class relations cover the entire behavior space and are not distinguishable. The deeper reason is that a fault class represents more than a (exclusive) disjunction of modes. We also make a persistence assumption, namely that one particular mode occurs in all inspected situations (i.e. for all inputs). Before we give formal definitions and computable expressions for the concepts, we introduce one last element: operating conditions. This reflects the common practice of distinguishing between ranges of internal or external quantities that result in qualitatively different behaviors and are often reflected by different states of the system and its control. Examples are engine idle, clutch engaged, cold engine, brake pedal pushed. Often, the analysis of fault effects and diagnosability can be restricted to certain operating conditions and is futile for others. For instance, one may not be extremely interested in the detectability of a fault in the air intake system under conditions where the engine is not running (one has to be cautious with such restrictions, though, because firstly, there may be a requirement to perform fault detection beforehand, such as Telematik 2/2002
Thema
checking the operability of the airbag system or the ABS, and secondly, a broken component could affect operating modes in which it is not intended to be active). In our approach, an operating condition has to be expressed as a constraint on a subset of model variables. Often, but not always, they will refer to exogenous variables such as the angle of the accelerator pedal or air temperature, and typically, but not exclusively, they are observables (the load, for instance, is not directly observable). In most cases, the constraint that defines an operating condition will be a conjunction of restrictions on variable values to some interval or state like temperature>120°C or ignition = ON. Restricting the analysis to certain operating conditions then boils down to computing the intersection of a behavior relation with their respective constraints. Definition 1 (Discriminability of behavior modes) Let MODELfault1, MODELfault2 be the behavior relations of two modes, OPCi an operating condition, and SITÌ DOM(V O-CAUSE), a non-empty relation on the observable causal variables. For OPCi and SIT, two faults are called z iff (i)
z
not discriminable, written ND(fault1, fault2, OPCi, SIT), SIT ⊆ SITND =PROJo-cause(OPCi) \ PROJo-cause (PROJobs (MODELfault1 ∩ OPCi)\ PROJobs (MODELfault2 ∩ OPCi) ∪ PROJobs (MODELfault2 ∩ OPCi)\ PROJobs (MODELfault1 ∩ OPCi)) deterministically discriminable , written DD(fault1, fault2, OPCi, SIT),
iff (ii) SIT ⊆ SITDD =PROJo-cause(OPCi) \ PROJo-cause (PROJobs (MODELfault1 ∩ OPCi) ∩ PROJobs (MODELfault2 ∩ OPCi)) z possibly discriminable , written PD(fault1, fault2, OPCi , SIT), iff SIT ⊆ PROJo-cause(OPCi) \ (SITND ∪ SITDD),
where SITND and SITDD are the maximal relations that satisfy (i) and (ii), respectively.
Definition 2 ( Discriminability of mode classes) Let FCj ={faulti,j}, j =1,2 be two fault classes and OPCi an operating condition. Let furthermore SIT-SET = {SITkl} ⊂ P(DOM (Vo-cause)) be a set of non-empty relations of observable causal variables. FC1, FC2 are called z
not discriminable, written ND(FC1, FC2, OPCi) iff there exists a pair of modes that is completely nondiscriminable: ∃ fault1k ∈ FC1 ∃ fault2l ∈ FC2 ND(faultlk, fault 2l, OPCi, PROJo-cause (OPCi)) z deterministically discriminable, written ND(FC1, FC2, OPCi, SIT-SET), iff each pair of modes is deterministically dicriminable for some element of SIT-SET: ∀ fault1k ∈ FC1 ∀ fault2l ∈ FC2 ∃ SITkl ∈ SIT-SET DD(faultlk, fault 2l, OPCi, SITkl) z Possibly discriminable, written PD(FC1, FC2, OPCi, SIT-SET), otherwise, iff all SITkl are in the complement of the non-discriminable situations: ∀ kl SITkl ∩ SITND,kl = ∅
optimization of sensor placement or deeper diagnostic performance. Thereby, the guiding applications serve, on the one hand, as case studies for the application of the new techniques and, on the other hand, as test cases and demonstrators of the results of the project. The guiding applications chosen cover on the one hand different mechatronic systems with central ECU-functions, and on the other hand the general application of diagnostic tasks to multiplexed architecture systems. They include The air delivery system for diesel engines (Figure 10), comprising the exhaust gas turbocharging system and the exhaust gas recirculation system (EGR. and the Common Rail Injection System (Fiat and MagnetiMarelli). z The cooling system (DaimlerChrysler AG), including an intercooler, which on the one hand increases the efficiency of the engine by cooling the compressed air and, hence, increasing the air charge rate, and on the other hand decreases NOx emissions by keeping the combustion at lower temperature (Figure 11). z
Status and Future Work As of now, two different alternatives have been implemented to generate the qualitative diagnosis models from existing numerical models which both use Matlab itself to compute the tuples of the modeling relation. In addition, a library of qualitative models will be created manually that allows to configure the model based on the structural description only. Based on a use case analysis, the core of the diagnosability analysis tool and the model-based on-board diagnosis engine have been developed. IDD will use a number of guiding Fig.11: Guiding application: Cooling system applications with the goal to demonstrate how the diagnostic tasks described can be performed by using the new process and the new tools architecture. Furthermore, we aim to demonstrate how additional advantages of the new method can be achieved, e.g. Fig.12: Guiding application: Air conditioning system
z The air conditioning system
These definitions characterize the three cases discussed above w.r.t. Figure 8. The sets SITND and SITDD are computed by operations on the extensional constraint representation generated by the model compiler. Based on the discriminability of modes, discriminability of fault classes can be defined and computed. Telematik 2/2002
Fig.10: Guiding application: Air delivery system
(Peugeot Citroën PSA) which consists of two loops that supply a cold heat exchanger and a hot heat exchanger (Figure 12). z The multiplexed architecture (Renault) involving ECUs, sensors, actuators, functions (EF = elementary functions), busses and data frames (Figure 13). The design engineer will be enabled to 27
Thema
run a program directly on the representation of a designed architecture and receive the results of an analysis of the interdependency of faults and functions in this architecture.
CT199-00058) and by the German Ministry of Education and Research (#01 IN 509 41).
References [1] P. Bidian, M. Tatar, F. Cascio, D. Theseider-Dupré, M. Sachenbacher, R. Weber, C. Carlén: Powertrain Diagnostics: A Model-Based Approach, Proceedings of ERA Technology Vehicle Electronic, Systems Conference ’99, Fig.13: Guiding application: Multiplexed architecture Coventry, UK, 1999 [2] R. Brignolo, F. Cascio, L. Console, P. A first version of models for these guiding Dague, P. Dubois, O. Dressler, D. Millet, applications has been developed and will be used B. Rehfus, P. Struss. Integration of Deto validate and improve the model abstraction sign and Diagnosis into a Common module and to evaluate the tools. By the end of Process. In: Electronic Systems for the project in January 2003, we hope to Vehicles, pp. 53-73. VDI Verlag, demonstrate the utility of the tools and the Duesseldorf, 2001. benefits of the modified design process based on [3] R. Bryant: Symbolic Boolean Manipulatiexamples that are close to reality. on with Ordered Binary-Decision Diagrams ACM Computing Surveys, Vol. Acknowledgements 24, No. September 1992 Many thanks to all partners in the VMBD and [4] F. Cascio, L. Console, M. Guagliumi, M. IDD projects, in particular to my direct Osella, A. Panati, S. Sottano, D. collaborators Oskar Dressler, Alessandro Theseider-Dupré: Strategies for on-board Fraracci Martin Sachenbacher und reinhard Wediagnostics of dynamic automotive ber. The work reported here has been supported systems using qualitative models, AI by the Commission of the European Union Communications, June 1999. (Projects no. BE 95/2128 and no. G3RD -
28
[5]
J. de Kleer, A. Mackworth und R. Reiter: Characterizing Diagnoses and Systems. Artificial Intelligence, 56, 1992 [6] O. Dressler und P. Struss: The Consistencybased Approach to Automated Diagnosis of Devices. In: Brewka, G. (ed.), Principles of Knowledge Representation, CSLI Publications, Stanford, pp. 267311, 1996. [7] W. Hamscher, L. Console, J. de Kleer (eds.): Readings in Model-based Diagnosis, Morgan Kaufmann Publishers, San Mateo, CA, 1992 [8] California’s OBD-II regulation, section 1968.1, title 13, California code of regulation, Resolution 93-40, 1993. [9] Raz’r Version 1.6, Occ’m Software GmbH, see http://www.occm.de [10] M. Sachenbacher, P. Struss, R. Weber: Advances in Design and Implementation of OBD Functions for Diesel Injection Systems based on a Qualitative Approach to Diagnosis, SAE 2000 World Congress, Detroit, USA, 2000. [11] P. Struss: Automated Abstraction of Numerical Simulations Models - Theory and Practical Experience. In: Sixteenth International Workshop on Qualitative Reasoning, Sitges, Catalonia, Spain, 2002.
Telematik 2/2002