Jun 13, 2014 - incorporate expert knowledge into species distribution modelling. I hope that the ... am thankful to the ITC helpdesk, and facility services that spoiled me with ...... In: SEO/BirdLife monitoring programmes in 2009-2010 eds.
KNOWLEDGE ORIENTED SPECIES DISTRIBUTION MODELLING
Aidin Niamir
PhD dissertation committee: Chair Prof. dr. ir. A. Veldkamp
University of Twente
Promoters Prof. dr. A. K. Skidmore Prof. dr. R. Real Giménez
University of Twente University of Malaga
Assistant promoter Dr A. G. Toxopeus
University of Twente
Members Prof. dr. ir. W.H. van der Putten Prof. dr. T. Hickler Prof. dr. ing. W. Verhoef Prof. dr. V.G. Jetten Dr A. R. Muñoz Gallego
Wageningen University Goethe-University Frankfurt University of Twente University of Twente University of Malaga
ITC dissertation number 250 ITC, P.O. Box 217, 7500 AE Enschede, the Netherlands ISBN: 978-90-365-3687-5 DOI: 10.3990/1.9789036536875 Printed by ITC Printing Department © Aidin Niamir, Enschede, the Netherlands, 2014
KNOWLEDGE ORIENTED SPECIES DISTRIBUTION MODELLING
DISSERTATION
to obtain the degree of doctor at the University of Twente, on the authority of the rector magnificus, prof. dr. H. Brinksma, on account of the decision of the graduation committee, to be publicly defended on Friday 13 June 2014 at 12:45 hrs
by Aidin Niamir born on May 22nd, 1980 in Tehran, Iran.
This dissertation is approved by Prof. dr. A. K. Skidmore, promoter Prof. dr. R. Real Giménez, promoter Dr A. G. Toxopeus , assistant promoter
Preface The outcome of my master project was the beginning of my PhD research path. The results of the project had fully satisfied the statistical performance measures; however it was always subjected to doubts and questions by biologists’ community. In that project my intention was to use available - though scarce - species observation records along with rigorous statistical modelling techniques to understand the habitat preference, and to map the distribution of a poorly-studied raptor in southern Spain. After presenting the final results to the local ornithologists, I realised that the produced maps were not consonant with their expectations, though the maps fully satisfied statistical measures. They could come up with examples which disapproved my findings, or could describe situations that would significantly contribute to the quality of the maps, if I had known them earlier. These encounterments were the defining moments that made me realize the gap between widely used inductive approaches and expert knowledge in habitat studies and species distribution modelling. I recognized that incorporation of knowledge into the novel distribution models has not been yet well-studied. At this moment biodiversity conservation requires reliable information and comprehensive understanding regarding species interaction with their surrounding environment more than ever. Expert knowledge can be a vital and trustworthy source of information as an alternative for conservation management decisions, when inadequate data make the inductive models unreliable. There are many locations, for example my own country Iran, that are scars in systematic species observation data, but there are experts and local people who hold valuable knowledge in that regard, gathered from their personal experiences and observations. Harnessing this knowledge and put to use next to computational advances and statistical developments can be a solution for biodiversity conversation in these situations. My aim in this research was to develop a framework to i
incorporate expert knowledge into species distribution modelling. I hope that the outcome of my study contributes in bridging the above mentioned gap and becomes a steppingstone in slowing down the biodiversity deterioration. This dissertation is the result of my PhD project which was jointly based at the Department of Natural Resources, Faculty of Geo-Information Science and Earth Observation, University of Twente* (Enschede, the Netherlands) and the Department of Animal Biology, Faculty of Science, University of Malaga† (Malaga, Spain). The project was jointly supervised by Professor Dr Andrew Skidmore (Enschede) and Professor Dr Raimundo Real (Malaga). The project was partly funded by European Erasmus Mundus Program‡, administered by the University of Twente, and performed at the two work places mentioned above. Foundation Migres § (Algecira, Spain) kindly hosted the fieldworks and surveys in 2009 and 2010. Aidin Niamir Enschede, March 2014
*
http://www.itc.nl/nrs http://www.uma.es/departamentos/info/4438/departamento-biologia-animal/ ‡ http://eacea.ec.europa.eu/extcoop/call/index.htm § http://www.fundacionmigres.org/ †
ii
Acknowledgements After five years I am finally seeing the end of my PhD road. An achievement only made possible with the help of family members, friends and colleagues all of whom I am deeply grateful to. I would like to thank my supervisors at ITC, Andrew Skidmore and Bert Toxopeus who gave me the opportunity to pursue this PhD in the first place and offered their help and advice whenever I needed. Andrew, you taught me the principal of parsimony in science. You always advised me not to look for complex explanations when a simple one will do; ‘thanks for everything I have learned during the past five years’. I really enjoyed the first half of every single meeting discussing politics, economy and culture, that widened my view to life. Bert, what can I say? Since I walked in to your room for the first time in 2005 to check those poor cross-eyed stuffed birds on the wall of your office, you were always more than a supervisor to me, you were my friend. You kept encouraging me and consistently insisting that everything will be fine while I was not very optimistic. Fortunately, you were right and I was wrong. My supervisors in Malaga, Raimundo Real and Antonio Munoz deserve a big “muchas gracias”. Throughout my PhD project, I spent more than 10 wonderful months in Andalucía. Thank you Raimundo, for kindly hosting me in the visits. You taught me the philosophy of science. My work greatly benefited from your conceptual ideas and your critical feedback, for which I express my sincere gratitude. I would like to thank Antonio for all his collaborations not only during my PhD, but ever since I started my Master project in 2008. You kindly connected me to a large number of ornithologists in Spain. More importantly, you taught me the priorities in life and how family comes first. During my PhD, I was lucky to get the chance of meeting a big crowd of fantastic people in Enschede and Malaga. These people deserve a huge iii
“Thank You” because they made me feel home and comfortable where I was. First, I would like to thank Babak Naimi and Sam Khosravifard, with whom I had spent a lot of time in Enschede. Babak, I learned a lot from our endless scientific and in-depth discussions. I do appreciate your critical advices and valuable help. My friend Sam, I enjoyed every single discussion we had over lunch. You helped me to learn how to present science to the community. Thank you both for the great company. In the early days of my PhD, collaborations with David Rossiter and Thomas Groen helped me to find my way around geostatisitics. David, you directed me to open-source statistical computing, you actually taught me to fish. I am also grateful to Alexey Voinov for his honest and realistic comments when I was expressing my research ideas and concerns over our lunch meetings. Life at ITC was made a lot easier; by Loes Colenbrander who took care of my graduate program from very beginning to the graduation ceremony, by Esther Hondebrink who dealt with all meeting arrangements, and departmental affairs, by Theresa van den Boogaard, Bettine Geerdink, and Marie Chantal Metz who dealt with all the bureaucracy that comes along with an international PhD student, and by Marion Pierik who did her best to put down all the financial anxieties. I am grateful to the staff of ITC library. I had a privilege of having Marga Koelen, Carla Gerritsen, and Desiree Snoek in the library making sure that I unrestrictedly access research materials, journal papers, books and even Dutch languages tests. I am thankful to the ITC helpdesk, and facility services that spoiled me with their great support. Special thanks to Aiko Mulder for preparing me spare laptops in a very short notice. I also would like to thank Roelof Schoppers for happily greeting me every morning in the past five years, and Benno Masselink and Job Duim for their support and dealing with my variety of requests. I am grateful to the entire Biogeography, Diversity and Conservation Research Team of the University of Malaga. Special thanks to Jesús Olivero, Ana Luz Márquez, Pelayo Acevedo, David Romero, and Alberto iv
Jiménez Valverde for your great company. I felt welcome in the team from the very beginning. There is a working environment that one would wish to be part of it and this is due to the great atmosphere which is built and maintained by its people. I would like to also express my appreciation and love to people who have always been there for me. My wonderful parents have always supported me in achieving my goals. Jaleh and Iraj, I always felt that I am standing on your strong shoulders and nothing can slow down my progress. You are the greatest mum and dad I could ever wish for. My sister Leila, you gave me pure love endlessly. Your “Sure you can!” motto always made me feel stronger. The person who has shared her life with me since the early days of my PhD and certainly had to suffer the most through my ups and downs was Maral. My dear Maral, you have brought happiness to my life and with you I am the luckiest man in the world. I love you and I am looking forward to see what life will bring us next.
v
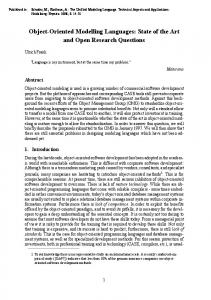
Cover caption: Bonelli’s Eagle (Aquila fasciata( Photo: Juan Luis Muñoz
vi
Table of Contents Preface .................................................................................. i Acknowledgements ................................................................. iii Chapter 1: GENERAL INTRODUCTION .......................................... 1 1.1 Introduction .............................................................. 3 1.2 Species distribution modelling ......................................... 5 1.3 Expert knowledge ...................................................... 10 1.4 Proposed approach ..................................................... 12 1.5 Research objectives ..................................................... 13 1.6 Outline of the dissertation............................................. 14 1.7 The study area ........................................................... 15 Chapter 2: FINESSING ATLAS DATA FOR SPECIES DISTRIBUTION MODELS ......................................................................... 17 2.1 Abstract .................................................................. 19 2.2 Introduction ............................................................. 20 2.3 Methods .................................................................. 22 2.3.1 Study area .............................................................. 22 2.3.2 Species occurrence data ................................................. 23 2.3.3 Target Species .......................................................... 24 2.3.4 Expert layers and rules ................................................. 27 2.3.5 Explanatory variables .................................................. 29 2.3.6 Bayesian expert system ................................................. 29 2.3.7 Hybrid method.......................................................... 31 2.3.8 Evaluation .............................................................. 32 2.4 Results .................................................................... 33 2.5 Discussion ................................................................ 37 Acknowledgments ............................................................... 41 Chapter 3: USE OF TAXONOMY TO DELINEATE ENVIRONMENTAL EXTENT FOR SPECIES DISTRIBUTION MODELLING ...................... 43 3.1 Abstract .................................................................. 45 3.2 Introduction ............................................................. 46 3.3 Methods and Materials ................................................. 48 3.3.1 Species data ............................................................. 48 3.3.2 Taxonomically delimited species occurrence datasets .................. 49 3.3.3 Species distribution models ............................................. 52 vii
3.3.4 Model evaluation ....................................................... 53 3.4 Results .................................................................... 54 3.5 Discussion ................................................................ 60 Acknowledgments ............................................................... 63 Chapter 4: ACCOUNTING FOR KNOWLEDGE UNCERTAINTY IN SPECIES DISTRIBUTION MODELLING ....................................... 65 4.1 Abstract .................................................................. 67 4.2 Introduction ............................................................. 68 4.3 Explanation of Dempster-Shafer theory of evidence .............. 70 4.4 Experimental settings .................................................. 75 4.4.1 Study area .............................................................. 75 4.4.2 Choice of species ........................................................ 75 4.4.3 Choice of experts ........................................................ 77 4.4.4 Environmental predictors ............................................... 77 4.4.5 Conventional species distribution models .............................. 77 4.4.6 Performance measures .................................................. 78 4.5 Using Dempster-Shafer evidence theory ............................ 79 4.6 Results .................................................................... 81 4.6.1 Assignment of belief functions .......................................... 81 4.6.2 Combination of belief functions ........................................ 85 4.6.3 Performance of the inductive models ................................... 90 4.6.4 Variability in knowledge domain ...................................... 90 4.7 Discussion ................................................................ 92 Acknowledgements ............................................................. 96 Chapter 5: KNOWLEDGE ORIENTED SPECIES DISTRIBUTION MODELLING; SYNTHESIS ..................................................... 97 5.1 Introduction ............................................................. 99 5.2 Revisiting the research objectives .................................. 102 5.2.1 Finessing spatial quality of species occurrence data ................. 102 5.2.2 Delimiting environmental extent..................................... 103 5.2.3 Accounting for self-acknowledged ignorance ........................ 105 5.3 Lesson learned......................................................... 106 5.3.1 Broad application of expert knowledge .............................. 106 5.3.2 Method for expert knowledge elicitation ............................. 107 5.3.3 Expert knowledge has more to offer .................................. 108 5.4 Recommendations .................................................... 109 5.4.1 Tools to support knowledge elicitation ............................... 109 viii
5.4.2 Critically evaluate expert knowledge ................................ 110 5.4.3 Forwarding species distribution models in time ...................... 111 Appendix I: EXAMPLES OF SPECIES DISTRIBUTION MAPS OBTAINED USING ATLAS DATASET AND TAXONOMICAL EXTENTS ................. 113 Appendix II: KNOWLEDGE ELICITATION ONLINE QUESTIONNAIRE .............................................................. 117 Bibliography ........................................................................ 125 Summary ........................................................................... 149 Samenvatting ....................................................................... 151 Biosketch ........................................................................... 157 Publications ........................................................................ 158 PE&RC Training and Education Statement ................................... 160 ITC Dissertation List ............................................................. 162
ix
x
Chapter
1
:
GENERAL INTRODUCTION
1
General Introduction
2
Chapter 1
1.1
Introduction
Species distribution models are defined as models that associate species occurrence at known locations with information on the environmental characteristics of those locations (Elith & Leathwick 2009). The spatial prediction of species distribution in unknown locations has been recognized as a fundamental component of conservation planning (Guisan & Zimmermann 2000; Austin 2002; Elith et al. 2002). These models have been widely employed to understand the relationship between a species and its biotic and abiotic environment; they are based on observations to test ecological or biogeographical hypotheses about species distribution and range. Species distribution models have also been used to predict the occurrence of a species, either for certain locations or at times where survey data were lacking or unobtainable (Franklin 2013). There is a variety of terms to address species distribution models with different emphases and implications: bioclimatic models (Heikkinen et al. 2006; Jeschke & Strayer 2008), ecological niche models (Peterson 2003; Soberón & Peterson 2005; Soberon & Nakamura 2009), habitat models (Luck 2002), and resource selection functions (Boyce & Mcdonald 1999). Modern quantitative modelling of species distribution emerged when advances in physical geography, concepts from field-based ecological studies, and developments in statistics and information technology coincided. Every day huge amounts of distributional data including sampling and tracking, as well as museum and herbarium records, are made available in global and national biodiversity databases (Soberón & Peterson 2004). In response, a wide variety of modelling techniques has been specially designed and enhanced to accurately model species distribution using the available occurrence data (Jiménez-Valverde et al. 2008). Published examples indicate that species distribution models can characterize the distribution of species to a satisfactory level when wellsurveyed species occurrence data and relevant explanatory environmental variables are analysed with a well specified algorithm. In contrast, 3
General Introduction
applications that extrapolate models in time or space, or are trained based on inadequate species observation data or explanatory environmental variables, are more challenging and the results are more equivocal (Elith & Leathwick 2009). An adequate species dataset consists of records describing known occurrences (presence), as well as records where the species was not observed (absences). Radiotelemetry data collected in wildlife studies as well as museum records, which are now utilized based on the millions of records compiled in digital form from natural history collections (Graham et al. 2004a; Soberón & Peterson 2004), are lacking information about absences of species. Therefore, rigorous species distribution methods that require pseudo-absence data along with presence data as input are proposed to compensate for this shortfall. Contrary to popular belief, there are very few methods that only require presence data (Barbet-Massin et al. 2012). So-called presence-only methods such as MaxEnt (Phillips et al. 2006) or GARP (Stockwell 1999) actually do require the use of pseudoabsence or background data. Indeed, the value of such methods could be of particular importance, but there is a danger of developing species distribution models based on a variety of statistical assumptions without a conceptual ecological background (Jiménez-Valverde et al. 2008), as false absence data can have negative effects on species distribution models (Gu & Swihart 2004). An increasing number of recently published studies are questioning the theoretical aspects of distribution models and are discussing a reflection of the conceptual basis that underlies model practices (Soberón & Peterson 2005; Araujo & Guisan 2006; Real et al. 2006; Austin 2007; Jiménez-Valverde & Lobo 2007; Jiménez-Valverde et al. 2008; Lobo 2008; Kearney et al. 2010). Expert knowledge is commonly used to generate and evaluate hypotheses, sample design, model development, and interpretation of results (Fazey et al. 2005). It forms an authentic source of information where empirical data are scarce or unaffordable. Expert knowledge can be the result of training, research, or personal experience and observation (Burgman et al. 2011). 4
Chapter 1
Expert knowledge is also utilized in conservation science (Martin et al. 2012).The need to characterize dynamic and complex interactions between a species and its biotic surroundings, limited resources to collect new empirical data, and the urgency of conservation decisions (Sutherland 2006; Kuhnert et al. 2010) are the main reasons for incorporation of expert knowledge in conservation science, in particular species distribution modelling. In this dissertation we argue that the use of expert knowledge in species distribution modelling may converge theoretical concepts and advance statistical techniques. The outcome of knowledge oriented species distribution models versus conventional approaches as a proxy to reflect on the theoretical concepts that underlie species distribution modelling methodologies will be discussed. Alternative knowledge oriented approaches that outperform the most conventional agreed upon settings in species distribution modelling are also provided.
1.2
Species distribution modelling
Literature that provides comprehensive reviews on species distribution modelling include Guisan & Zimmermann (2002), Guisan & Thuiller (2005), Elith et al. (2006), Richards et al. (2007), Elith & Leathwick (2009), and Franklin (2009). Here we briefly present species distribution modelling using the framework adapted from Austin (2002). This framework consists of four parts: ecological, data, statistical, and graphical models (Figure 1.1). The ecological model encompasses ecological concepts or biogeographical hypotheses tested in the study. The data model “consists of the decision made regarding how the data are collected and how the data will be measured or estimated” (Austin 2002). The choice of statistical techniques, evaluation methods and experimental settings form the statistical model. 5
General Introduction
The graphical model includes visualization and graphical representation of the models
Theory / Hypothesis
Species Data
Environmental Data
Approach Method
Visualization
Ecological Model
Data Model
Statistical Model
Graphical Model
Figure 1.1 Classic components of species distribution modelling
6
Chapter 1
Developing a species distribution model starts with a theoretical or conceptual model of the abiotic and biotic (De Araujo et al. 2014) factors affecting species occurrences in space and time. Hypotheses generation, using the physical environment preferences of species and species interactions with other species in competition or coexistence, form a primary step. Collecting adequate data on species occurrences and environmental explanatory variables comes next. Species occurrence data can be collected through a systematic sampling scheme, or obtained directly – where available – from biodiversity data bases. Species interactions with their environment are often complex and only some of the relevant explanatory variables can be translated into this spatial representation. Sometimes environmental preference and habitat favourability of species can be determined using expert knowledge. In the next step a function is derived using either the correlation between species occurrences and the environmental variables, or expert knowledge. The model will then be applied to the values of the environmental variables to predict the favourability of unobserved locations. A map of species occurrence can be produced using the predicted favourability. Diverse factors operating dynamically with a variety of intensities at different scales (Pearson et al. 2002; Pearman et al. 2008; Gaston & Fuller 2009) determine the distributional area of a species, which is a complex expression of its ecology and evolutionary history (Brown 1995). Soberón and Peterson (2005) have defined three classes to assist in determining the location of a species; abiotic conditions, biotic factors, dispersal accessibility and evolutionary capacity. They further discuss the idea of using the MAB diagram (Figure 1.2). If a species is present (shown by a yellow star in the diagram) at a given location the following conditions have been met: abiotic conditions must be favourable (A), an appropriate suit of species is present and absent (B), and the area is within reach for the species from established distribution areas in ecological time (M). For further information please see Soberón & Peterson (2005) and Soberón & Nakamura (2009). 7
General Introduction
accessible area to the species in ecological sense, without barriers to moment and colonization
appropriate set of abiotic factors right combination of interaction species
Figure 1.2 MAB diagram (adopted from Soberón & Peterson 2005)
Regarding the M factor some argue that absence records indicate whether the sampling site was unsuitable or suitable but unoccupied, perhaps because of inaccessibility (Jiménez-Valverde et al. 2009). However, other external factors (e.g. anthropogenic factors) may also result in the absence of a species from its suitable habitat or its presence in an unsuitable ones (Pulliam 2000). What we actually can derive from species observation records and statistical models is the realized, but also with some caution the potential, geographical distribution of species (Araujo & Guisan 2006; Peterson et al. 2007; Kearney et al. 2010). Potential distribution of a species refers to the places where a species could live, while realized distribution refers to the places where a species is actually living. Calibration and validation of a species distribution model to represent either of these two concepts need adequate species occurrence data (Jiménez-Valverde et al. 2008) on both presence and absence of species. Complicated statistical techniques have the potential to discriminate between species presence locations and unknown locations, hence edge 8
Chapter 1
closer to a realized distribution of a species. Notwithstanding that their evaluation will be biased toward higher discrimination capacity (Elith et al. 2006; Tsoar et al. 2007). The primacy of such complicated machine learning techniques over simpler linear approaches for species potential distributing modelling remained unproved. Almost all species distribution models actually do require data on both presence and absence of species. There is ongoing discussion on how to best model potential distribution of a species when reliable absence data are not available. There are several so-called presence-only species distribution models that use presence data against randomly sampled (i.e. pseudo-absence) or numerous (i.e. background) unknown locations. Methods of detecting and dealing with absence locations can have an effect on results and the ecological interpretation of outputs (Lutolf et al. 2006; Niels Raes 2007; Ortega-Huerta & Peterson 2008; Phillips et al. 2009; Aranda & Lobo 2011; Beaugrand et al. 2011). Some acknowledge that the models would be ecologically meaningful and interpretative if presenceabsence data were input to the modelling process (Kent & Carmel 2011). Another advantage of the availability of presence-absence data is that it enables analysis of bias, goodness-of-fit (Jiménez-Valverde 2014), and prevalence (Phillips et al. 2009; Lawson et al. 2014). However, this will have notable impact on the type of data that needs to be collected. Contrary to records describing known occurrences (presence), reliable absence data is rare and often unaffordable. Often there are spatial correlations among and within environmental variables that violate the assumption of independency in most standard statistical procedures (Legendre 1993b). Spatial structure of environmental variables can be measured using the variance inflation factor as a measure of multicollinearity, and the Moran’s I statistic as a measure of univariate spatial autocorrelation. However, decisions regarding eliminating correlating variables remain with the modeller. Selecting a relevant and ecologically informative set of variables is fundamental in species 9
General Introduction
distribution modelling, and interpretation of models may vary with different environmental explanatory variables. Problems related to uncertainty in species distribution modelling are difficult to deal with and are often ignored (Elith & Graham 2009). This is largely because it is difficult to quantify errors, and the problem seems overwhelming. Although there have been a number of reviews on, as well as theoretical ways to treat, uncertainty sources in species distribution modelling (Elith et al. 2002; Rocchini et al. 2011), little has been done in practice to illuminate the actual effect of likely uncertainties on modelled predictions. Rocchini (2011) highlighted the need for a “map of ignorance” to provide an overview where the reliability of predictions is unknown. Uncertainty in species distribution models mostly results from the input data, i.e. inadequate species occurrence, bias in sampling, geographical position accuracy, and species misdetection (Heikkinen et al. 2006; Hortal et al. 2008; Heikkinen et al. 2012). This topic has received significant attention in recent years (Orton & Lark 2007; Refsgaard et al. 2007; Buisson et al. 2010; Luoto et al. 2010; Lukey et al. 2011; Rocchini et al. 2011; Synes & Osborne 2011; Mcbride et al. 2012a; Naimi et al. 2013). The use of pseudo-absence and background as a substitute for absence locations is considered to be another source of uncertainty. The geographical extent of background locations or pseudo-absence sampling, affects the output of the modelling practices; the results may vary between different sampling strategies (Acevedo et al. 2012).
1.3
Expert knowledge
An expert in our view is either a scientist, who researches and formally publishes their knowledge, or a practitioner, who applies scientific knowledge but does not necessarily conduct research or publish his knowledge. An expert may be specialist on a specific topic (for example, an authority in the migration sea birds), or a skilled individual (for example an expert on identifying raptors or tracking carnivores), or a sage practitioner 10
Chapter 1
(for example an experienced Griffon Vulture biologist) (Perera et al. 2012). Experts are often well-known to their peers for their skill and knowledge (Choy et al. 2009), therefore peer-recognition may be a reliable initial filter for identifying experts. Expert knowledge is implicit by nature. It is typically not documented and remains tacit until its expression is demanded. Experts express their knowledge in different forms, thus it may appear fragmented and properties such as uncertainty may remain unassessed (Forsyth 1984; Burgman et al. 2011; Perera et al. 2012). The value of expert knowledge now goes beyond traditional expert systems. They may be able to bypass complex systems and provide parsimonious solutions that focus on the key aspects of a situation (Perera et al. 2012). What experts know based on their observations, readings and discussions, can then deductively provide insights on complex patterns and processes. The growing use of expert knowledge in conservation science and in particular in species distribution models is driven by limited resources for collecting adequate empirical data on species occurrences and the imminent nature of many conservation decisions (Martin et al. 2012). Conservation scientists may find useful applications for expert knowledge in all aspects of research and development. A wide variety of experts are mentioned in the literature with reference to the use of their knowledge in conservation science. Indeed, expert knowledge is now commonly used in conservation science (Borsuk 2004; Comber et al. 2005; Fazey et al. 2005; Choy et al. 2009; Janssen et al. 2010; Kuhnert et al. 2010). Only a relatively small number of studies to date addressed the incorporation of expert knowledge into the species distribution modelling realm (Murray et al. 2009). Utilizing expert knowledge in distribution modelling was mainly practiced through the analytical hierarchy process and multi-criteria evaluation system, or fuzzy set theory (Zadeh 1965), where sampled data were unreliable or inadequate (Anselin et al. 1989; Skidmore 1989; Salski 1992; Store & Kangas 2001; Ozesmi & Ozesmi 2004; Rüger et al. 2005; Doswald et al. 2007; Estrada et al. 2008; Niamir et al. 2011; Olivero et al. 2013). These 11
General Introduction
approaches are very promising for producing deductive distribution models, and forming a basis for developing more quantitative models regarding the species-environment relationship. Expert knowledge would be an efficient source of information for the species distribution modeller (Murray et al. 2009; Newbold 2010). Experts provide valuable insight into species-environment interactions and they may offer predictions given specific environmental conditions (Kuhnert 2011). Furthermore, conservation managers might rely on experts as an alternative source of knowledge (Murray et al. 2009; Martin et al. 2012) and get them involved in the components (see Figure 1.1) of species distribution modelling. There are several examples of attempts to employ expert knowledge for species distribution modelling (Dennis 1996; Pearce et al. 2001; Ferrier et al. 2002; Hobbs 2003; Choy et al. 2009; Bierman et al. 2010). In practice, however, incorporation of expert knowledge into the species distribution modelling procedure presents challenges (Ferrier et al. 2002) and has not been adequately utilized and promoted yet (Carpenter 2002; Lehmann et al. 2002; Franklin 2009).
1.4
Proposed approach
We believe that expert knowledge can potentially support species distribution modelling practices by proposing parsimonious solutions for complex natural processes. Expert knowledge is also an efficient source of information for filling the gaps where species data are scarce or unreliable. In this dissertation we propose two approaches to employ expert knowledge in species distribution modelling. One approach is to incorporate knowledge into the data model (see figure 1.1) to facilitate making informed decisions regarding species data preparation. This is a hybrid approach that makes use of the advantages of inductive and deductive approaches. Another approach is to incorporate knowledge directly into the statistical model (see figure 1.1) to directly set species preferences. We then evaluate the effect of incorporating expert 12
Chapter 1
knowledge into components of species distribution modelling. We hypothesise that the use of expert knowledge improves the performance of distribution models particularly when species interactions with their surrogates are complex or data are unobtainable, biased or inadequate. This assumption is justified by the fact that inductive distribution modelling approaches are absolutely dependent on the species data. So, even if a method for distribution modelling provides an accurate relationship between a species and the habitat, the adequacy of the input would still significantly affect the outcome. Expert knowledge about natural phenomena is subject to uncertainty. This uncertainty is partly due to lack of knowledge of the expert, which can be compensated by learning or adding more experts to the knowledge domain, and partly due to substantive uncertainty in natural phenomena themselves. Our proposed approach towards uncertainty management in expert knowledge is to consider both sources of uncertainty through a novel method that accommodates an expert’s self-acknowledged uncertainty and level of ignorance. By ignorance here we refer to absence of fact, understanding, insight, or clarity about something unknown (Firestein 2012). In summary, our approach aims to utilize expert knowledge by taking the “unknown” pieces of information into account and pursuing ignorance in species distribution modelling.
1.5
Research objectives
The overall objective of this thesis is to contribute to understanding of how existing knowledge may enhance species distribution modelling practices. The four chapters of the thesis aim to explore and evaluate a variety of approaches to incorporate knowledge and ignorance into distribution modelling. In particular, we explore and evaluate the potential contribution of experts’ knowledge for spatial quality enhancement of occurrence data, 13
General Introduction
where available data are too coarse for the desired application and finer resolution distribution maps are required; investigate the effect of considering species taxonomical information on the performance of the distribution models, by delimiting unknown localities using species ancestor’s presence; propose a novel approach for accounting for self-acknowledge ignorance when modelling species distributions, using solely experts’ knowledge, and compare the outcomes with conventional data-driven approaches; set a framework for a distribution modeller where expert knowledge is available and species occurrence data are scarce or unobtainable.
1.6
Outline of the dissertation
The dissertation consists of five chapters. Apart from the General Introduction and the Synthesis, the chapters are either under review or have been accepted in scientific peer reviewed journals. Each paper has been presented as a stand-alone chapter and deals with one specific research question. The structure and content of the manuscripts are largely retained for the purpose of this thesis. The 1st chapter, the General Introduction, gives an overview of the background and objectives of the dissertation. The 2nd chapter outlines the incorporation of existing knowledge into a conventional approach to predict the distribution of Bonelli’s eagle at a resolution 100 times finer than available atlas data, in Malaga province, southern Spain. Chapter 3 demonstrates the use of species taxonomy to delineate environmental extent and evaluates how this affects the 14
Chapter 1
performance of species distribution models for 356 terrestrial species in mainland Spain. The 4th chapter explores the application of the Dempter-Shafer Theory of Evidence in modelling the distribution of a well-known (Bonelli’s eagle), and a poorly-studied (Short-toed Eagle) species in mainland Spain. Chapter 5, the Synthesis, summarizes and discusses the main findings, and outlines perspectives for future research.
1.7
The study area
Considering the research questions, the availability of materials and of a corporative network of experts, it was decided to conduct the study in Spain at two different scales: local scale (Malaga Province) and national scale (Spain). Peninsular Spain is situated in south-western Europe and covers an area of 493.518 km2. Spain may be divided into three climatic areas: Atlantic, Mediterranean and Interior. The Atlantic area has mild winters and relatively cool summers, and abundant precipitation throughout the year. The Mediterranean part is characterized by hot summers and mild winters with low rainfall, occurring mainly during spring and autumn. Hot summers, mild winters, and scarce precipitation characterize the Interior (Capel Molina 1981). Spain also comprises important mountain ranges, situated mainly in the north (Pyrenees and Cantabrian mountains) and the southeast (Baetic mountains), with relevant mountain chains traversing central Spain from west to east (Iberian and Central systems). Ecologically, mainland Spain is a relatively homogenous unit with sufficient variability as well as the target species of this study being of particular interest in a European context. The province of Malaga (7267 km2) is a mountainous region situated in Andalusia, southern Spain, ranging in altitude from sea level along the Mediterranean shoreline to almost 2000 m. The climate is Mediterranean and the natural vegetation in 15
General Introduction
the valleys and lowlands has been transformed into olive groves, cereal crops, and coastal urbanization, interspersed with small fragments of Mediterranean scrubland. (Richards et al. 2007)
16
Chapter
2
:
FINESSING ATLAS DATA FOR SPECIES DISTRIBUTION MODELS Niamir, A., Skidmore, A.K., Toxopeus, A.G., Munoz, A.R. & Real, R. Diversity and Distributions (2011) 17, 1173-1185
Parts of this chapter also appear in: Niamir, A. et al. “Downscaling species atlas data using expert-system”, in the proceedings of the 5th International meeting of the International Biogeography Society, 2011, Iraklion, Greece Niamir, A. et al. “Enhancing coarse-resolution species atlas”, in the proceedings of the Netherlands Ecological Annual Meeting 2011, Lunteren, the Netherlands Niamir, A. et al. “Generating finer resolution species distribution data using an expert system”, in the proceedings of the Ecological society of Australia, annual conference 2010. Canberra, Australia. 17
Finessing Atlas Data for Species Distribution Models
18
Chapter 2
2.1
Abstract
The spatial resolution of species atlases and therefore resulting model predictions are often too coarse for local applications. Collecting distribution data at a finer resolution for large numbers of species requires a comprehensive sampling effort, making it impractical and expensive. This study outlines the incorporation of existing knowledge into a conventional approach to predict the distribution of Bonelli’s eagle at a resolution 100 times finer than available atlas data in Malaga province, southern Spain. A Bayesian expert system was proposed to utilize the knowledge from distribution models to yield the probability of a species being recorded at a finer resolution (1 x 1 km) than the original atlas data (10 x 10 km). The recorded probability was then used as a weight vector to generate a sampling scheme from the species atlas to enhance the accuracy of the modelling procedure. The Maximum Entropy for species distribution modelling (MaxEnt) was used as the species distribution model. A comparison was made between the results of the MaxEnt using the enhanced and, the random sampling scheme, based on four groups of environmental variables: topographic, climatic, biological and anthropogenic. The models with the sampling scheme enhanced by an expert system had a higher discriminative capacity than the baseline models. The downscaled (i.e. finer scale) species distribution maps using a hybrid MaxEnt/expert system approach were more specific to the nest locations, and were more contrasted than those of the baseline model. The proposed method is a feasible substitute for comprehensive field work. The approach developed in this study is applicable for predicting the distribution of Bonelli’s eagle at a local scale from a national level occurrence dataset; however, the usefulness of this approach may be limited to well-known species.
19
Finessing Atlas Data for Species Distribution Models
2.2
Introduction
Species distribution modelling (SDM) is being widely used to predict the occurrence of species at locations where survey data are lacking (Guisan & Thuiller 2005), which is the case for most of the earth’s surface (Franklin 2009). To define the suitability of a location for a species, SDM links data about a species distribution data to the environmental characteristics of those locations and then extrapolates the relationship over space or time (Oindo et al. 2003; Guisan & Thuiller 2005). For the majority of species, data describing distributions are scarce and in the form of coarse resolution atlases (Newbold 2010). Species atlases provide a convenient display, using near-equal areas (grids) on maps (Araujo et al. 2005), of the extent-ofoccurrence based on historical observations, museum records and often a complementary field survey. A species is marked as “present” if there is at least one record of that species at a location within a pre-defined grid (Bierman et al. 2010). Such grid maps are typically available in the form of systematic 10 × 10 km grid cells at a national level or in coarser resolutions at continental and global level, while application usually occurs on a local level of around one hundred hectares (Rouget 2003). Atlas data plays an important role in conservation biogeography by providing species distribution data for developing new concepts, analytical approaches, and to address a range of conservation problems (Araujo et al. 2005). Therefore, to generate a reliable fine resolution distribution map, the gap between the available coarse resolution species occurrence datasets and the desired resolution has to be bridged (Hobbs 2003). Developing an empirical approach to deal with uncertainties in the downscaling process remains a challenge (Boitani et al. 1999; Barbosa et al. 2003; Araujo et al. 2005; Graham et al. 2008). Projection to a finer resolution of statistical relationships calibrated at a coarse resolution is a conventional approach (Collingham et al. 2000; Araujo et al. 2005; Barbosa et al. 2009; Barbosa et al. 2010). However, the extrapolation of models built for one resolution to a different resolution 20
Chapter 2
increases the uncertainty in the model predictions because they are extended beyond the model’s original scale and error can vary among scales (Araujo et al. 2005). Another downscaling approach investigated point-sampling (Lloyd & Palmer 1998; Barbosa et al. 2003; Hartley et al. 2003; Mcpherson et al. 2006), where the species occurrence dataset consisted of a random point within each coarse resolution grid cell (50 x 50 or 10 x 10 km) along with fine resolution (1 x 1 km) environmental variables informing the SDM. A critical issue in this approach was the model’s uncertainty, derived from prediction inconsistency over different random sampling iterations (Costa et al. 2010). Furthermore, the expense of an intensive field survey is often high and cannot be afforded (Skidmore & Turner 1992; James et al. 2001). Since there are insufficient field data available, expert knowledge could be an efficient source of information (Murray et al. 2009). Translation of such knowledge into a rule-based script poses a challenge (Ferrier et al. 2002), and has not been widely promoted (Carpenter 2002). There have been concerns that prior knowledge (i.e. expert opinion) might drive the modelling process rather than guide it (Dennis 1996). There are several examples which attempted to incorporate expert knowledge into SDM procedures (Pearce et al. 2001; Ferrier et al. 2002; Hobbs 2003; Choy et al. 2009; Bierman et al. 2010), but this has not been adequately utilized in species data optimization and sampling strategies (Lehmann et al. 2002). A species is recorded as present in an atlas grid if the database holds at least one record of that species from a location within that grid. The term “recorded probability” is used to address the probability of a species being recorded at a location. Bayesian inference is an accepted statistical tool among ecologists (Pereira & Itami 1991; Dennis 1996; Ellison 2004; Clark 2005; Mccarthy 2007). Bayes’ Theorem provides a clear method for estimating parameters and expressing the degree of confidence and uncertainty in those estimates. Bayesian expert-systems (Lee et al. 1987) have been defined to handle complex, real world problems and attempt to solve problems by reasoning 21
Finessing Atlas Data for Species Distribution Models
like an expert (Forsyth 1984; Skidmore 1989; Heikkinen & Hogmander 1994). Expert-systems used to combine diverse data sources with remotely sensed images in order to map soils (Skidmore et al. 1996), vegetation (Skidmore 1989; Schmidt et al. 2004; Wang et al. 2009) and habitat characterization (Bierman et al. 2010; Wang et al. 2010). This study outlines the incorporation of existing knowledge into a pointsampling approach to predict the distribution of Bonelli’s eagle (Aquila faciata) in Malaga province, southern Spain, at a resolution 100 times finer than atlas (modelled) data (Marti & Del Moral 2003). An experiment was designed to evaluate the discriminative capacity of a Bayesian expert system model with an enhanced sampling scheme and four groups of environmental explanatory variables: topographic, climatic, biological, and anthropogenic. This model (termed “hybrid” model hereafter) consisted of a Bayesian expert system combined with a conventional SDM technique: Maximum Entropy species distribution modelling (MaxEnt)(Phillips et al. 2006). The aim was to assess whether an expert system could improve the accuracy and robustness of predictions for local conservation applications by utilizing existing ecological knowledge, where empirical data were missing or difficult to obtain.
2.3
Methods
2.3.1 Study area
The province of Malaga (7267 km²) is a mountainous region situated in Andalusia, southern Spain, ranging in altitude from sea level along the Mediterranean shoreline to almost 2000 meters. The climate is Mediterranean with mean annual rainfall ranging from 400 to 1200 mm and annual temperatures ranging from 12.6 to 19.2 °C (Font 2000). The natural vegetation has been transformed in the valleys and lowlands to olive
22
Chapter 2
groves, cereal crops, and coastal urbanization interspersed with small fragments of Mediterranean scrublands. 2.3.2 Species occurrence data
Bonelli’s eagle is a resident species in the Malaga province, with only juvenile birds dispersing. Therefore, it was assumed that the presence of active nests indicated the presence of the species throughout the year. Occurrence data for Bonelli’s eagle in 10 × 10 km grids for Malaga province were obtained from the Atlas of Spanish breeding birds (Marti & Del Moral 2003) and updated with the Atlas of raptors of Malaga province (Jiménez & Muñoz 2008). Malaga province is covered by 104 atlas grids (10 x 10 km), with Bonelli’s eagle marked “present” in 67 (70%) of the grids and “absent” in the others (Figure 2.2a), which indicates that the density for the species in Malaga province is the highest one known in Europe. Three species sampling datasets were generated. The first dataset termed the ‘random points’ dataset consisted of 100 iterations of a random point in a coarse resolution grid (10 x 10 km) which was originally marked as ‘present’ in the atlas (n=67). The second dataset (termed the ‘enhanced’ dataset) was generated based on the same procedure, except that the recorded probability (as quantified by the expert system) was used as a weighting factor. This meant that a grid cell with a higher recorded probability had a higher probability of being sampled. In order to test whether the developed SDMs differ significantly from what would be expected by chance, 1000 random points were generated over the study area (Malaga province) and used as inputs for the null models (Raes & Ter Steege 2007). An independent evaluation dataset was collected consisting of 80 nest locations (presences). Nest locations were provided by local ornithologists monitoring breeding territories from 2005 to 2009 in Malaga province.
23
Finessing Atlas Data for Species Distribution Models
The absence points (n=1000) were randomly generated using the atlas data (Marti & Del Moral 2003) within cells where the species was not observed. 2.3.3 Target Species
Bonelli’s eagle is a medium to large sized raptor (Figure 2.1) with its western Palaearctic populations mainly distributed in the Mediterranean area (Del Hoyo 1994). The European population has suffered a marked decline and has been listed as an endangered European Species in recent decades (Rocamora 1994; Birdlife-International 2000, 2004, 2008, 2011). Spain supports 730 – 800 breeding pairs (Real 2003) or about 75% of the total European population. Malaga supports about 10% of the Spanish population of the species (Del Moral 2006), considered one of the last strongholds of the Bonelli’s eagle in Europe (Balbontín 2005). Existing knowledge about favourable nest locations for Bonelli’s eagle was elicited from literature and retrieved from the Web of Science® on 1 January 2010 through three key words: “Bonelli’s eagle”, “Hieraaetus fasciatus”, and “Aquila fasciata”.
Figure 2.1: Bonelli’s Eagle (Photo: Juan Luis Muñoz) 24
Chapter 2
Table 2.1 lists the studies that describe the variables that are considered to be important for determining the distribution of the species. Disagreement among different sources was discussed with local experts and their contribution has been evaluated subjectively. It was concluded that topographic attributes formed a critical factor in favourable nest locations for Bonelli’s eagle. Experts consistently mentioned slope gradient and altitude as important topographic explanatory variables. Another critical factor frequently mentioned in the literature was formed by land cover attributes, e.g. distance to artificial surfaces and human disturbance. Table 2.1 Details of studies which have been used for knowledge extraction on the habitat preferences of Bonelli’s Eagle. Data 1 Region Parameters Cádiz, Spain Topographic features, and Human P (Balbontín 2005) disturbance Catalonia, Spain P Human disturbance (Bosch et al. 2010) Spain Climate, vegetation, and interspecific A (Carrascal & Seoane 2009) relationships Murcia, Spain P Prey availability (Carrete et al. 2002) Granada, Spain Distance to villages, topographic P (Gil-Sánchez et al. 1996) irregularity, and cultivation Human disturbance, interspecific Granada, Spain P relationships, and topographic (Gil-Sanchez et al. 2004) variables Castellón, Spain Cragy slopes, human disturbance, P (Lopez-Lopez et al. 2006) climate, and landuse Valencia, Spain A Altitude, and slope (Lopez-Lopez et al. 2007a)
25
Finessing Atlas Data for Species Distribution Models
Table 2.1 (continued) Data 1 P P P SP, A A A SP SP SP P P P SP 1
Region Castellón, Spain (Lopez-Lopez et al. 2007b) Alicante, Spain (Martinez et al. 2008a) Alicante and Murcia, Spain (Martinez et al. 2008b) Western Europe (Moleon et al. 2009) Spain (Moreno-Rueda et al. 2009) Spain (Muñoz et al. 2005) Granada, Spain (Ontiveros & Pleguezuelos 2003a) Granada, Spain (Ontiveros & Pleguezuelos 2000) Western Mediterranean (Ontiveros & Pleguezuelos 2003b) Andalucia, Spain (Ontiveros et al. 2005) Portugal (Palma et al. 2006) Valencia, Spain (Rico et al. 1999) Spain (Soutullo et al. 2008)
Parameters Altitude Landcover Intra- and interspecific relationships Prey availability, and local territorial features Anthropogenic disturbances, temperature, and prey diversity Slope, temperature, and precipitation Landscape features, and prey accessibility Landcover, and Aspect Climatic constraints, and anthropogenic disturbances Landcover and, prey availability Prey accessibility, and landscape composition Altitude Anthropogenic disturbances
Species data: SP, subpopulation; A, atlas/lattice; P, points
26
Chapter 2
2.3.4
Expert layers and rules
Using the ASTER elevation model (Abrams et al. 2010) two topographic explanatory variables was compiled: elevation and slope irregularity. To generate the irregularity layer for slope (Skidmore 1989) and elevation, the maximum values were subtracted from the mean within a 1 x 1 km grid, resulting in higher values representing higher irregularity and lower values describing homogenous topographic landscape. The CORINE (Coordination of Information on the Environment of the European Environmental Agency (European Environment Agency 2012)) land cover 1995 and 2006 maps (Bossard et al. 2000) with a 250 x 250 meter resolution was also downloaded and aggregated to a 1 x 1 km resolution using the Raster package (Hijmans & Van Etten 2010). Land cover and topographic irregularity were selected as environmental layers in the expert model, reflecting the fact that this species is geographically widespread in Malaga province with its fragmented bare rocks and high human disturbance. These three environmental explanatory variables (expert layers) were then used in the expert system. Since spatial correlation among (Montgomery 1982) and within (Dormann et al. 2007; Naimi et al. 2011; Naimi et al. 2013) predictors violates the assumption of independence of most standard statistical procedures (Legendre 1993a), the spatial structure of the expert layers was investigated using the variance inflation factor (VIF) as a measure of multicollinearity, and the Moran’s I statistic as a measure of univariate spatial autocorrelation. Formulation of expert rules was based on the integration of knowledge from several sources, including the reviewed literature, knowledge acquired through discussion with experienced local researchers, as well as personal field observation. Where disagreement occurred between the different sources, a subjective decision was made based on field knowledge. The expert rules and their associated probabilities are listed in Table 2.2.
27
Finessing Atlas Data for Species Distribution Models
Table 2.2 Variables and their corresponding rules included in the expert system to calculate the probability of recording a nest of Bonelli’s eagle in Malaga. Variables Elevation Diff. (m) Moran’s I = 0.367 VIF = 1.187 Slope gradient (%) [Max – Mean] Moran’s I = 0.483 VIF = 1.271
Land cover Moran’s I = 0.909 VIF = 1.468
28
Evidence less than 100 meters between 100 to 200 meters more than 200 meters less than 30 30 - 45 45- 60 more than 60 Continuous urban fabric Discontinuous urban fabric Industrial or commercial units Road and rail networks and associated land Port areas Airports Mineral extraction sites Construction sites Sport and leisure facilities Non-irrigated arable land Permanently irrigated land Vineyards Fruit trees and berry plantations Olive groves Crops associated with permanent crops Complex cultivation patterns Agriculture and natural vegetation Agro-forestry areas Broad-leaved forest Coniferous forest Mixed forest Natural grasslands Sclerophyllous vegetation Transitional woodland-shrub Bare rocks Burnt areas Water courses Water bodies
P(E|H) 0.3 0.5 0.9 0.2 0.3 0.5 0.9 0.1 0.1 0.1 0.1 0.1 0.2 0.2 0.2 0.2 0.3 0.2 0.3 0.3 0.3 0.3 0.3 0.3 0.4 0.3 0.4 0.4 0.5 0.7 0.3 0.9 0.5 0.1 0.1
Chapter 2
2.3.5
Explanatory variables
The environmental explanatory variable sets have a direct interaction with species and were chosen based on ecological theory (Austin 2007). Usually there is a wide variety of potential predictor variables to choose from, but the effects of making a choice between variables are poorly known (Synes & Osborne 2011). In this case, the explanatory environmental variables were grouped into four categories (see Appendix S1 in Supporting Information); topographic, climatic, anthropogenic, and biological. The basis for grouping was to create consistent variable sets for input to, and comparison of the SDM predictions. Topographic variables (TPG) consisted of elevation, slope, and aspect along a north-south axis derived from the ASTER elevation model (Abrams et al. 2010). For climatic variables (BCL), all 19 bioclimatic layers (1 x 1 km) (Hijmans et al. 2005) were used. The approximate distance to roads, the approximate distance to urban areas, and the land cover map comprised the anthropogenic variables (ANT). The most commonly used parameter for quantifying productivity and above-ground biomass of ecosystems is the Normalized Difference Vegetation Index (NDVI). For biological variables (BIO), atmospherically corrected SPOT4 and SPOT5 Vegetation Sensor were obtained from SPOT Vegetation Program*. The decade average (1998 -2008) of the 10-day composite NDVI-images (S10 product) at 1 km2 resolution was then calculated (36 images). For more information on NDVI and faunal distribution see (Leyequien et al. 2007). 2.3.6
Bayesian expert system
Bayesian theory in SDM offers an alternative approach to statistical inference and differs from conventional frequentist inference in
*
http://www.vgt.vito.be 29
Finessing Atlas Data for Species Distribution Models
fundamental ways. Frequentist inference estimates the probability of the evidence (E) given hypothesis (H), while Bayesian inference estimates the probability that a hypothesis is true given evidence and defines it as the degree of belief in the likelihood of the evidence (Wade 2000; Ellison 2004). Here a forward chaining expert system, originally developed by Skidmore (1989), was used to infer the posterior probability that a Bonelli’s eagle nest occurs at a given cell based on the predictors and the expert rules. The forward chaining approach is essentially a data driven approach (Naylor 1984) and has been applied satisfactorily in remote sensing and image classification (Skidmore et al. 1996; Schmidt et al. 2004; Wang et al. 2010). Bayesian methods explicitly recognize and combine four components of knowledge: prior knowledge, data, model and posterior knowledge (Mccarthy 2007). In this study, prior knowledge from coarse resolution atlas data was combined with expert rules to estimate the recorded probability of a nest location at a finer resolution. Let (N ) be a nest occurring at location ( X i , j ) and let ( Eb ) be an item of evidence (for b=1,..,k) known at location ( X i , j ) . Set a hypothesis (H ) that a nest (N ) occurs at location ( X i , j ) . A rule may be defined thus: given ( Eb ) then (H ) , that is: given a piece of evidence ( Eb ) , then infer (H ) . However, there may be uncertainty associated with this rule (Forsyth 1984), and the probability of the rule may not be 0 (i.e. false) or 1 (i.e. true), but rather lie between 0 and 1, depending on how “sure” the experts are that the rule is true (Skidmore 1989).
30
Chapter 2
Bayes’ Theorem was used to update the probability of the rule that the nest of Bonelli’s eagle (H ) occurs at ( X i , j ) given an environmental explanatory variable:
P( H | Eb )
P( E b | H ) P( H ) P( Eb )
(Equation 1)
where P( Eb | H ) is the probability that there is a piece of evidence ( Eb ) (e.g. bare rocks) given that a nest occurs at location ( X i , j ) , also known as conditional probability which is based on expert rules (Table 2.2); P(H ) is the probability for the hypothesis (H ) that a nest occurs at location ( X i , j ) , initially obtained from the species atlas data (a priori). On iterating with further pieces of evidence, P( Eb | H ) : b 1 replaces P(H ) in equation 1. P( Eb ) is the probability of the evidence alone:
k
P( Eb ) P( Eb | H ) P( H ) b 1
(Equation 2)
The evidence ( Eb ) must be spatially independent (Table 2.2), otherwise P( Eb ) would become larger or smaller, thereby decrementing or incrementing (H ) , causing the posterior probabilities to be incorrect. 2.3.7 Hybrid method
A hybrid method for species distribution was constructed, incorporating a Bayesian expert system and a machine learning model, to increase the discriminative capacity compared to methods without an expert system. 31
Finessing Atlas Data for Species Distribution Models
Machine learning methods in contrast to deductive and knowledge-driven approaches include various kinds of algorithms implemented to learn the classification rules directly from data (Breiman 2001a). The Maximum Entropy model for species distribution modelling (MaxEnt) (Phillips et al. 2006) has generated higher predictive accuracy than many other methods (Elith et al. 2006; Hernandez et al. 2006). MaxEnt also outperformed others where sampling was poor (Costa et al. 2010), data were collected with sampling bias (Phillips et al. 2009; Rebelo & Jones 2010) and across different sample sizes (Wisz et al. 2008). Therefore the MaxEnt version 3.3.1 was employed here as distribution modelling core. For more information about MaxEnt and its statistical explanation see (Elith et al. 2011). 2.3.8 Evaluation
The PresenceAbsence package (Freeman & Moisen 2008) in R 2.11.1 (R Development Core Team 2013) was used to assess the capacity of the downscaled models to discriminate between validation presence and absence points (validation dataset) by analysing their receiver operation characteristic (ROC) curves. The area under this curve (AUC) provided a threshold-independent measure across all possible classification thresholds for each model (Fielding & Bell 1997). Then the R’s wilcox.test function was used to perform a Mann-Whitney-Wilcoxon rank-sum test (termed Wilcoxon test hereafter) to check whether the hybrid model had a higher AUC value than the MaxEnt model. AUC combines specificity and sensitivity (Fielding & Bell 1997) thus it is not possible to explore whether the improvement in model performance has to do with reduction of commission or omission, or both errors. AUC ignores the goodness-of-fit of the predictions (Lobo et al. 2008; Jiménez-Valverde 2012), therefore it is possible that a poorly fitted model retains good discrimination power (Hosmer & Lameshow 2000). To deal with this limitation sensitivity and specificity of models was also calculated. 32
Chapter 2
2.4
Results
The probability of a nest being recorded (at the finest resolution of 1 x 1 km) was estimated using the Bayesian expert system. The mean of the posterior probabilities (μ = 0.24) was low. Two-thirds (76%) of all fine resolution grids had a recorded probability of 0.5 or less. In line with expectation, the range of recorded probabilities was wide with a mean (95% CI) of 0.81 among presence coarse resolution grids, indicating that there are few cells with a high and many cells with a low recorded probability in each presence atlas grid (Figure 2.2b). Intersection of validation nest location with the recorded probability revealed that 30 (37.5%) of the nests were located in cells with a 0.75 or higher recorded probability, 47 (58.7%) were located in cells with a 0.5 or higher recorded probability, and 8 (10%) in cells with a 0.1 or lower recorded probability. The average recorded probability for nest locations (presences), was 0.57 (with standard deviation 0.27).
Figure 2.2: (a) Distribution of Bonelli’s Eagle in Malaga, based on the Spanish Atlas of Breeding Birds and Atlas of raptors of Malaga province. (b) Probability of a nest being recorded over presence atlas grids based on expert knowledge.
33
Finessing Atlas Data for Species Distribution Models
The random, null-points, and enhanced species dataset along with four categories of environmental variables (TPG, BCL, ANT, and BIO) were input to MaxEnt. The baseline models (built using the random point dataset) were compared with the “hybrid” models (built using the enhanced dataset). The hybrid models had a higher mean AUC than the baseline models. However, not all models were equally improved by incorporating the expert system. The favourable nesting locations were accurately discriminated from unfavourable locations over the study area (Figure 2.2). The mean AUC score in models with ANT variables increased the most by replacing the baseline with hybrid models: from 0.71 to 0.83 (Wilcoxon tests, p 0.001 ); and there was a 8% improvement in discrimination capacity of the models with TPG ( AUCBaseline 0.74 to AUCHybrid 0.81 , Wilcoxon
tests,
p 0.001 )
and
BIO
( AUCBaseline 0.75
to
AUCHybrid 0.82 , Wilcoxon tests, p 0.01 ), whereas the models with bioclimatic variables (BCL) only slightly increased the AUC score, from 0.75 to 0.79 (Wilcoxon tests, p 0.001 ) (Table 2.3). The evaluation of the null models also revealed that all models are significantly different than what is expected by chance. The mean of the probabilities (of favourable nest locations) was always significantly higher at ‘presence’ sites (i.e. n = 80 nest locations), than at ‘absence’ sites (Wilcoxon tests, for ANT, TPG and BIO: p 0.001 and for BCL: p 0.01 ). The proportion of presence validation points in areas with high probability ( 0.75 ) was always significantly higher than the proportion of localities available within those areas for both hybrid and baseline models. The proportion of presences in areas of low probability ( 0.25 ) was generally lower than expected by chance (Wilcoxon tests, for ANT, TPG and BIO: p 0.01 and for BCL: p 0.05 ). The mean probability of occurrence values were also consistently higher at presence validation points and lower at absence validation points than at any of the
34
Chapter 2
random site samples (null-points) for hybrid models (Wilcoxon tests, for presence: p 0.01 and for absence p 0.05 ). The hybrid approach had considerably higher specificity (pseudo-absence location correctly predicted), whereas the sensitivity (nest location correctly predicted) was decreased at lower thresholds. The threshold probability where specificity is equal to sensitivity was lower in the hybrid than the baseline models. However, the proportion of the correctly predicted nest locations was higher at the above mentioned threshold (Figure 2.3). This is reflected in the predicted distribution maps. The least favourable locations ( 0.25 ) were discriminated from less favourable locations ( 0.25 f 0.5 ) in the hybrid approach (Figure 2.3). Uncertainties in the prediction (standard deviation of AUC) over 100 iterations were significantly smaller in hybrid models than in the baseline models (Table 2.3), revealing that the hybrid models were more robust in their discrimination. Table 2.3: Evaluation of model performance, Mean and (Standard Deviation) of the AUC scores over 100 iterations for null model, baseline (random sampling) and hybrid (Bayesian expert system) models. Significant levels are associated with the Wilcoxon’s test. Model
Null model
Baseline
Hybrid
Topographic
0.60 (0.078)
0.74 (0.114)
0.81 (0.027) ++
Bioclimatic
0.56 (0.047)
0.75 (0.019)
0.79 (0.019)++
Biological
0.55 (0.039)
0.75 (0.045)
0.82 (0.015)+
Anthropogenic
0.57 (0.058)
0.71 (0.072)
0.83 (0.019)++
++
P < 0.001, + P < 0.01, ns not significant
35
Finessing Atlas Data for Species Distribution Models
Figure 2.3 Comparison of fine resolution prediction maps generated by baseline (right column) and hybrid (left column) models using topographic (TPG), bioclimatic (BCL), biological (BIO), and anthropogenic (ANT) environmental explanatory variables for Bonelli’s eagle in Malaga 36
Chapter 2
2.5
Discussion
For all environmental explanatory variables, the downscaled predictions based on the hybrid approach were significantly related to the location of survey nests and improved the discriminative capacity of the distribution models. This suggests that such a hybrid approach may be a valid way to incorporate existing knowledge into the modelling procedure in regions that are poorly known or where fine resolution species information is too costly and time consuming to gather. The main aim of this paper was to introduce the Bayesian expert system as a promising alternative, incorporating existing knowledge into the analysis of species atlas data. Since the proposed approach enhances the quality of input species data, other SDMs than MaxEnt may also be employed for the prediction of species distribution. In fact, any parametric model may be suitable to build up a hybrid approach using our expert system. No a priori assumption was made as to the form of the relationship between the proxy variable for the expert layers and the recorded probability. However, it is possible to take into account the importance of environmental explanatory variables based on the expert knowledge by assigning weights to (Equation 2), and consequently updating (Equation 1). The methodology presented in this paper extends the methodology by Skidmore (1989) by including a species distribution model in which the recorded probability of the species is modelled as a function of environmental variables. Higher discrimination capacity of the hybrid approach is due to its higher specificity rather than sensitivity. When considering a 10 x 10 km atlas data grid, there are many favourable locations for a nest that might not be used for many reasons, e.g. the territorial behaviour of the species. Consequently, a model should be capable of discriminating unfavourable locations (even if they are biophysically favourable). A reasonable model would be expected to be not only sensitive, but also specific to the nest locations. Sensitivity is equal to specificity (sensitivity and specificity lines cross each other) at a higher proportion value in the hybrid model, and at a 37
Finessing Atlas Data for Species Distribution Models
1.0 0.8 Sensitivity Specificity
0.0
0.2
0.4
0.6 Null
0.8Sensitivity1.0
0.0
Specificity
0.4
0.6
0.8
1.0
0.0
0.2
0.4
0.6
0.8
1.0
0.2
0.4
0.6
0.8
0.20.6 0.2 0.00.4 0.20.6 0.40.8 0.61.0 0.8
0.2 0.00.4 0.20.6 0.40.8 0.61.0 0.8
0.0
1.0
Figure 2.4 Variation of sensitivity (solid lines), Threshold the proportion of correctly predicted nest location versus specificity (dashed lines), the proportion of correctly predicted absences in baseline (blue) and hybrid (red) models, using four categories of environmental explanatory variables for Bonelli’s eagle in Malaga. Grey lines represent null models. 38
0.2
0.4
0.0
0.2
0.4
0.0
0.2
0.4
Thresho
0.0
Threshold (presence) Threshold probability
0.0
Accuracy Measures Measures Accuracy correct Proportion
Climatic
0.0
1.0
0.2
1.0
0.0
0.40.8
0.61.0 Baseline
0.00.4
0.20.6
Specificity
0.2
Sensitivity
0.0
0.61.0 0.40.8
Hybrid
0.00.4 0.2
Topographic
Accuracy Measures Accuracy Measures correct Proportion
0.8
1.0
threshold closer to the prevalence of nest presence compared to the baseline model (Figure 2.4).
0.0
0.2
0.4
Thresho
1.0
1.0
Chapter 2
0.8
0.4
0.6
0.8
1.0
0.4
0.6
0.8
0.0
0.2
0.4
0.6
0.8
Proportion correct 1.0
0.40.8
Specificity
0.0
0.2
0.4
0.6
0.8
1.0 Sensitivity
Null
Specificity
0.0
0.2
0.4
0.6
0.8
1.0
0.0
0.2
0.4
0.6
0.8
1.0
0.0
0.2
0.4
0.6
Threshold
Threshold (presence) Threshold probability
0.0
Threshold
0.2 0.00.4 0.20.6 0.40.8 0.61.0 0.8
Biological
0.0
0.2 0.00.4 0.20.6 0.40.8 0.61.0 0.8
0.20.6
1.0
Sensitivity
Baseline
1.0
0.2
1.0
0.0
Accuracy Measures Accuracy Measures
0.00.4
Proportion correct
0.61.0
0.2
Specificity
0.0
0.0
Sensitivity
Hybrid
0.2
0.61.0 0.40.8 0.20.6 0.00.4
Anthropogenic
0.0
0.2
Accuracy Measures Accuracy Measures
0.8
Figure 2.4 (continued)
0.8
1.0
0.0
0.2
0.4
0.6
0.8
1.0
Threshold
Expert systems offer many advantages and some disadvantages over conventional statistical approaches for species distribution modelling. The major advantage is that existing knowledge about the species-environment relationship can be encapsulated into the modelling process. In this study the inductive model, (MaxEnt) produced the suitability for nest occurrence, based on random points within coarse resolution grids. The 39
Finessing Atlas Data for Species Distribution Models
known ecological relationship between environmental variables and the location of a nest yielded the most likely nest location (recorded probability). The expert system handled the uncertainty in these relationships through the use of probability (e.g. it is fairly certain that the Bonelli’s eagle will nest on bare rock, but this may not always be the case). This is in contrast with crisp models (Estrada et al. 2008), which try to describe the relationship in a binary format (i.e. does the nest of a Bonelli’s eagle occur in sclerophyllous vegetation, yes or no?). Another advantage of expert systems is that expert judgment on the effect of scale can be quickly incorporated as the implicit relationship between data layers and the dependent variable being modelled becomes clear. For example many bare rock pixels were aggregated with other dominant pixels within 1 x 1 km grids. Therefore in this study, experts expressed their knowledge in the form of topographic irregularity to diminish the aggregation effects. This flexibility gives an expert the opportunity to build their own expert knowledge base, even manually drawing their ideas on a map using a graphical interface. Therefore, in such hybrid approaches the ecological realism and acceptability to the user community may improve as well as the predictive performance. An obvious disadvantage of expert systems for species distribution modelling is that experts may not agree among themselves, causing inconsistencies in the existing knowledge on the ecological factors affecting distribution of the target species. The “robustness” of a recorded probability map generated by an expert system has to be gauged against the criteria defined by the expert or other source of knowledge, as well as against a validation data set. Another disadvantage of expert systems, as with all other modelling techniques, is that they do not respond well to incomplete knowledge or extrapolation into an area beyond the region of expertise (Murray et al. 2009). In such a situation, the probabilities associated with the rules may have to be adjusted to better reflect the gap in knowledge or the addition of explanatory variables may be required (Skidmore 1989). As the results revealed, existing knowledge was more 40
Chapter 2
accurate in describing unfavourable locations for nests than favourable locations. Therefore it may be beneficial to model the unsuitability, using absence points instead of presence points, and then taking the inverse of the predicted distribution map (Lobo et al. 2010). In other words, the presented hybrid model may be employed to incorporate expert knowledge on either suitability or unsuitability for a certain species into distribution models. A number of studies have investigated the performance of inductive (datadriven) SDM at predicting distribution and species ecological characteristics (Segurado & Araujo 2004; Elith et al. 2006; Guisan et al. 2007; Evangelista et al. 2008) and it appeared that generalist species with a wide geographical range yielded models with a lower discriminative capacity than species with strict geographical boundaries (Buisson et al. 2010). This is the stage that our hybrid approach will be most usefully applied. It is easier to discriminate favourable from unfavourable habitat for generalist species, by incorporating a deductive (knowledge-driven) method, thereby describing the ecological niche. The novel technique described here may not be successful for species that are not well known or minimally studied. However all SDMs suffer the same restrictions.
2.6
Acknowledgments
This research was funded by the European Union Erasmus Mundus program External Cooperation Windows 2008/2441/001 MUN ECW 157-2008, and by the Spanish Ministry of Education and Science and FEDER (project CGL2009-11316, BOS subprogram). The authors wish to thank the local ornithologists who kindly shared their knowledge and observations of the Bonelli’s eagle in Andalucia, as well as the many volunteer fieldworkers who contributed to the Spanish atlas of breeding birds. Babak Naimi provided crucial tips on the use of R. The language editing was done by Eva Skidmore. Many thank to Mark Robertson and the
41
Finessing Atlas Data for Species Distribution Models
three anonymous reviewers for their comments on a previous version of this paper.
42
Chapter
3
:
USE OF TAXONOMY TO DELINEATE ENVIRONMENTAL EXTENT FOR SPECIES DISTRIBUTION MODELLING Niamir, A., Skidmore, A.K., Toxopeus, A.G. & Real, R. Resubmitted after revision to Global Ecology and Biogeography
Parts of this chapter also appear in: Niamir, A. et al. “"Accounting for species taxonomy improves distribution models"”, in the proceedings of The International Statistical Ecology Conference 2014, Montpellier, France 43
Use of taxonomy to delineate environmental extent for species distribution modelling
44
Chapter 3
3.1
Abstract
The use of species atlas data and correlational modelling approaches has become common practice in species distribution modelling. However, the effect of spatial extent on the performance of species distribution models remains unclear. We propose using species taxonomy to delineate environmental extent (and ipso facto study area), and assess how this affects the performance of species distribution models. Using atlas data, two taxonomically enhanced datasets were created for 356 terrestrial species from mainland Spain. As well as a species’ presence, its absence was recorded. However, an absence was only recorded for localities where another species of the same family or order was known to be present. We then assessed the effects of environmental extent on the predictive performance of five species distribution models, namely on model calibration (Miller’s statistic) and discrimination (area under the curve of the receiver operating characteristic plot), comparing the results to those obtained with the original atlas dataset. Using family and order datasets significantly improved the calibration of the species distribution models. While the discrimination capacity decreased for several species when using the family dataset, this drop was significant when the models were trained with the order dataset. The species distribution model algorithms differed only slightly in performance. Enhancement of atlas data by excluding irrelevant absences based on species taxonomy significantly improved the calibration of species distribution models and thus their capacity to predict environmental potential. We therefore recommend the inclusion of species taxonomical extent when atlas data are employed in distribution models.
45
Use of taxonomy to delineate environmental extent for species distribution modelling
3.2
Introduction
Using species atlas data in combination with a variety of modelling approaches has become a common practice in species distribution modelling. However, the effect of the spatial extent, being considered for a particular species, on the performance of the distribution models remains unclear. For the majority of species, atlases provide the most reliable and convenient sources depicting the area of distribution of a species (Araujo et al. 2005; Franklin 2009; Niamir et al. 2011). Species atlas data have been widely used to study species distribution patterns (Sillero et al. 2009; Barbosa et al. 2012) as well as for undertaking conservation planning at varying spatial and temporal scales (Hopkinson et al. 2000; Rouget 2003; Barbosa et al. 2010; Bombi et al. 2012). The extent of an atlas is often in accordance with geopolitical boundaries. Atlas data are usually a compilation of historical observations, museum records and, sometimes, complementary systematic field surveys. A species is marked ‘present’ if there is at least one record of that species within the extent of a pre-defined grid cell, and marked ‘absent’ for any grid cell without a record of the species. Customarily, the extent of the study area used for species distribution modelling is identical to the area reported in the atlas including all present and absent gird cells, regardless of the range of the species and without biological justification (Meyer & Thuiller 2006). There have been attempts to investigate the effect of the extent of a study area on the performance of species distribution models (Jiménez-Valverde et al. 2008; Barve et al. 2011; Acevedo et al. 2012). The discrimination capacity of the models has shown a positive association with the extent of the study area (Lobo et al. 2010; Lobo & Tognelli 2011). Including more uninhabited and unsuitable localities – which are traditionally considered absences or background – improves the discrimination capacity of the models (Lobo et al. 2008). This is the case with specialist species that have a relatively narrow distribution caused by biological interaction or physical environment. By contrast, delimiting the study area to unoccupied, but 46
Chapter 3
suitable, localities increases the calibration and informational contents of the distribution model (Anderson & Raza 2010; Acevedo et al. 2012), although it may reduce the discrimination capacity. Distribution models for generalist species with a broader environmental envelope (Carpenter et al. 1993) struggle to discriminate between suitable and unsuitable localities (Jiménez-Valverde et al. 2008). The geographic range of a species is a basic unit of biogeography (Brown et al. 1996). Setting appropriate geographic range limits for a species is critical when creating reliable distribution models (Roy et al. 2009). However, the selection of spatial and environmental limits has been largely ignored by modellers (Hortal et al. 2012). These limits arise from complex interactions between biological interactions B, the physical environment A, and the dispersal ability M of a species (see BAM diagram Soberon and Peterson 2005). M is the geographic region that has been accessible to the species over relevant periods of time. The extent of this region is determined by two factors operating at different intensity and scale: the region the species has had access to, dispersing from some original area, and the evolutionary capacity the species has shown in adapting to new conditions (Soberón & Peterson 2005; Soberon & Nakamura 2009). Acevedo et al. (2012) assessed the use of geographic criteria, such as trend surface analysis, to restrict the inclusion of absence records from beyond the geographic domain of the species in distribution models. However, they recognized that a spatial pattern generated with trend surface analysis cannot be considered a geographical representation of M, as the concepts underlying each approximation do not necessarily converge on the same geographical space. Brave et al. (2011) proposed the use of information related to the dispersal capacity of a species to define an appropriate extent for modelling purposes. The ideal extent for model development should comprise a set of localities that has been accessible to the species of interest over relevant time periods. An appropriate extent for studying the distribution of a target species includes ‘reliable’ presences as well as reliable absences. Recording reliable 47
Use of taxonomy to delineate environmental extent for species distribution modelling
absences and therefore excluding unknown/not-sampled localities, requires more effort than recording presences (Mackenzie 2005). Therefore, inclusion of ‘not’, or ‘inadequately’, surveyed localities in the modelling procedure affects the performance of species distribution models. In this study, we propose a species-specific, practicable procedure to refine the extent of a study area, and consequently, the extent of certain environmental conditions, based on species taxonomy. We argue that to develop a reliable species distribution model, the extent of the study area should be appropriately defined. This may be done by assuming that in the atlas data “presence” localities relating to other species of the same family or the same order may be used to qualify the absence localities of the target species as true and relevant. Considering a species’ ancestors’ distribution would minimize inclusion of irrelevant absences. Since atlas data are basically a compilation of observation reports, the probability of unnoticed presence of the target species at localities where other species of the same order are recorded, is relatively lower than at localities without such recordings. By irrelevant absences we mean those localities that either due to their environmental remoteness are not informative for an ecological model, or were not sampled specifically for the target species. In this context, our main objective is to propose an approach which incorporates the taxonomy of a species and therefore delineate the extent of study for species distribution model. We assess the effect of this enhancement on the calibration and discrimination capacity of 5 conventional modelling algorithms over 356 terrestrial species in mainland Spain.
3.3
Methods and Materials
3.3.1 Species data
The target species were terrestrial vertebrates of mainland Spain including mammals, birds, reptiles, and amphibians. We obtained the species distribution, consisting of presence and absence data, from the Spanish 48
Chapter 3
Terrestrial Species Inventory* using Universal Transverse Mercator (UTM) 10 × 10 km grid cells (n = 4684). A species was recorded as present in a grid cell if the Spanish Terrestrial Species Inventory database holds at least one reliable record of that species from a location within that grid. The species list was first screened counting the number of UTM grid cells where a species was marked as present, removing species with less than 20 ‘present’ or ‘absent’ records in the study area to assure an appropriate number of species occurrences to train models. In total 356 species were selected; 81 mammal species from 14 families in 7 orders, 213 bird species from 39 families in 15 orders, 36 reptile species from 7 families in 3 orders, and 26 amphibian species from 6 families in 2 orders. 3.3.2 Taxonomically delimited species occurrence datasets
We generated three species occurrence datasets. In all three datasets the presence of a species was exactly the same as those in the Spanish Terrestrial Species Inventory, while absences differed. The absences of species in the first dataset (called the atlas dataset hereafter) were identical to the absences of species in the national inventory. To generate the second dataset (the order dataset hereafter) the absence of a species was only recorded where at least one other species from the same order was recorded as present. We extended this restriction to the family level for our third dataset (the family dataset), with the absence of a species being recorded only in the presence of at least one species from the same family. Figure 3.1 illustrates schematically the procedure used to generate the three described datasets.
*
Ministry of Agriculture, Food and Environment [Access May 2013]
http://www.magrama.gob.es/es/biodiversidad/temas/inventarios-nacionales/inventario-especiesterrestres/default.aspx 49
Use of taxonomy to delineate environmental extent for species distribution modelling
Occurrences of species
Occurrences of species in Family
Occurrences of species in Order
Atlas Dataset
Family Dataset
Order Dataset
A
A
A
A
A
A
A
A
P
A
A
P
A
P
P
A
P
P
A
A
A
P
A
A P
A
A
A
P
A
A
P
P
A
A
A
P
Species observed
Other species in the same Family observed Other species in the same Order observed
A
Absence
P
Presence
Figure 3.1 Schematic explanation of atlas, family and order datasets
50
Chapter 3
Table 3.1 Environmental predictors used to model the distribution of species and their range of values in the study area (mainland Spain) Predictor Code Range Mean altitude (m)a Alti 0 to 2630 Mean slope (degrees) (calculated from Alti) Slop 0 to 19.6 Mean annual precipitation (mm)b Prec 154 to 2621 b Mean relative air humidity in January at 07:00 h (%) HJan 60.7 to 95.0 Mean relative air humidity in July at 07:00 h (%)b HJul 50.6 to 92.4 Mean annual insolation (h/year)b Inso 1603 to 3172 b Mean annual solar radiation (kwh/m2/day) SRad 304 to 507 b TJan 3.7 to 13.2 Mean temperature in January (◦C) b TJul 13.5 to 28.8 Mean temperature in July (◦C) b Temp 3.9 to 19.4 Mean annual temperature (◦C) Mean annual number of frost days DFro 0 to 117.7 (minimum temperature ≤ 0 ◦C)b Mean annual potential evapotranspiration (mm)b PET 599 to 1036 Mean annual actual evapotranspiration (mm) AET 154.6 to (=minimum [PET, Prec]) 923.9 Maximum precipitation in 24 h (mm)b MP24 52.1 to 474.5 Relative maximum precipitation (=MP24/Prec) RMP 0.1 to 1.0 Mean annual number of days with DPre 16.1 to 193.2 precipitation ≥ 0.1 mmb TRan 8.2 to 21.5 Annual temperature range (◦C) (=TJul−TJan) Annual relative air humidity range (%) HRan 0.1 to 41.3 (=|HJan−HJul|) Distance to the nearest highway (km)c DHi 0.5 to 105.2 Distance to the nearest town with more than U100 0.1 to 154.0 100,000 inhabitants (km)c Distance to the nearest town with more than U500 0.1 to 301.9 500,000 inhabitants (km)c Lati 36.1 to 43.7 Latitude (◦N)c c Long -9.3 to 3.3 Longitude (◦E) a
U.S. Geological Survey (1996); Font (1983, 2000); c I.G.N. (1999); data on the number of inhabitants of urban centres taken from the Instituto Nacional de Estadística (http://www.ine.es) for Spain. b
51
Use of taxonomy to delineate environmental extent for species distribution modelling
3.3.3 Species distribution models
Five distribution models, specifically the generalized linear model (Mccullagh 1989), generalized additive model (Hastie & Tibshirani 1990), boosted regression trees (Friedman 2001), random forests (Breiman 2001b), and support vector machine (Drake et al. 2006), were tested for each species using the three datasets and 23 environmental predictors (Barbosa et al. 2009) related to topography, climatology, and human activity (Table 3.1). The environmental predictors were chosen on the basis of availability and potential predictive power for terrestrial species in Spain (Barbosa et al. 2003; Naimi et al. 2011). The generalized linear model (GLM) uses a parametric function to link the response variable to a linear, quadratic or cubic combination of explanatory variables. We used a GLM ordinary polynomial with an automatic stepwise model selection based on the Akaike Information Criterion. The generalized additive model (GAM) uses nonparametric functions to fit nonlinear functions. In this study, a GAM with a cubic spline smoother and an automated stepwise process was employed. The boosted regression trees (BRT) algorithm fits complex nonlinear relationships by combining two algorithms of regression trees and boosting; the former to relate a response to their predictors by recursive binary splits, and the latter to combine many single models to improve the performance. We followed the recommended default settings: viz. a maximum number of trees equal to 3000 and a learning rate of 0.001 (Elith et al. 2008). The random forests (RF) algorithm selects many bootstrap samples from the data and fits a large number of regression trees to each of these subsamples. Each tree is then used to predict those that were not selected as bootstrap samples. The classification is given by considering each tree as a ‘vote’, and the predicted class of an observation is determined by the majority vote among all trees (Cutler et al. 2007). The models presented here used 500 trees. The support vector machine (SVM) is a machine-learning generalised linear classifier that estimates the potential distribution of a species subject to the 52
Chapter 3
environmental conditions, by separating the ecological space by hyperplanes into suitable and unsuitable environmental conditions (Reiss et al. 2011). The optimality criterion used to find the separating hyper-plane is the maximised distance to the training data points. All models were executed in the R environment v. 3.0.1 (R Development Core Team 2013). 3.3.4 Model evaluation
The area under the curve of the receiver operating characteristic (ROC) plot was computed to assess the discrimination capacity of the models for each data set. A ROC curve plots sensitivity values (true positive fraction) on the y-axis against 1– specificity values (false positive fraction) for all thresholds on the x-axis. The area under the curve (AUC) is a single measure of model discrimination capacity, which provides a thresholdindependent measure across all possible classification thresholds for each model (Fielding & Bell 1997). We randomly split the data using 70% to train the models and the remaining 30% to measure the discrimination capacity of the models. We also assessed the calibration of the models using Miller’s calibration statistic (Miller et al. 1991; Pearce & Ferrier 2000) based on whole datasets for each species. Miller's calibration statistic evaluates the ability of a distribution model to correctly predict the proportion of species occurrences with a given environmental profile. It is based on the hypothesis that the calibration line – perfect calibration – has an intercept of zero and a slope of one. The calibration plot shows the model’s estimated probability (x-axis) against the mean observed proportion of positive cases (y-axis) for 10 equally sized probability intervals. To be able to compare the models’ performance we calculated the Root Mean Square Error (RMSE) of the calibration graph for each model (Armstrong & Collopy 1992).
53
Use of taxonomy to delineate environmental extent for species distribution modelling
The effect of taxonomic extent – varying in three datasets – on the model performance measures for each species was assessed using all five species distribution models. We assessed the variation in discrimination capacity (AUC), and calibration (RMSE) of the models based on the atlas, order, and family datasets using the Mann–Whitney U test (Hollander & Wolfe 1973).
3.4
Results
Delimiting absences using species taxonomy (Table 3.2) reveals that the inclusion of family and order datasets significantly improved the calibration of the models. While discrimination capacity dropped for several group of species and modelling techniques when using the family dataset, this drop became more significant when the models were trained with the order dataset. Overall, the calibration of models improved for 83% of species for both the family and order dataset, while the discrimination capacity decreased in 51% and 43% of species respectively. Amphibians benefited most: 90% for calibration and 74% for discrimination, when using the family dataset. Calibration improved for 75% of the bird species with both the family and the order dataset (Figure 3.2). For some species the drop in discrimination capacity was significant. Closer inspection of these species revealed that either they were geographically widely spread, or they belonged to narrowly spread families/orders, resulting in few absence occurrences remaining after correction with the atlas data. Those species for which delimiting their extent sharply downgraded the calibration of the models were mainly specialist species with geographically limited occurrences. Figure 3.3 illustrates the distribution maps obtained using atlas, family and order datasets and five species models for Vipera latasti as an example (See Appendix I for more examples).
54
Chapter 3
Table 3.2 Summary of results of the SDM algorithms used to assess the effect taxonomical extent has on the performance of five models. Numbers represent the proportion of species models with improvement in their performance measures. GLM
GAM
SDM algorithms RF
BRT
SVM
Family dataset
Calibration (RMSE)
Mammals Birds Reptiles Amphibians
0.91 (+ **) 0.88 (+ **) 0.80 (+ **) 0.92 (+ **)
0.90 (+ **) 0.69 (+ **) 0.77 (+ **) 0.88 (+ **)
0.82 (+ ns) 0.82 (+ *) 0.89 (+ *) 0.88 (+ *)
0.91 (+ **) 0.74 (+ **) 0.75 (+ **) 0.96 (+ **)
0.75 (+ **) 0.60 (+ **) 0.91 (+ **) 0.88 (+ **)
0.87 (+ **) 0.74 (+ **) 0.80 (+ **) 0.84 (+ *)
0.85 (+ ns) 0.84 (+ *) 0.88 (+ ns) 0.88 (+ ns)
0.86 (+ *) 0.76 (+ **) 0.72 (+ **) 0.92 (+ *)
0.82 (+ **) 0.67 (+ *) 0.91 (+ **) 0.96 (+ **)
0.57 (+ *) 0.38 (- **) 0.38 (- ns) 0.77 (+ ns)
0.45 (- *) 0.41 (- *) 0.36 (- ns) 0.69 (+ *)
0.64 (+ *) 0.40 (- *) 0.55 (+ ns) 0.80 (+ ns)
0.68 (+ ns) 0.47 (- *) 0.56 (+ *) 0.73 (+ ns)
0.54 (+ *) 0.46 (- **) 0.44 (- *) 0.34 (- *)
0.58 (+ ns) 0.47 (- **) 0.31 (- *) 0.27 (- *)
0.64 (+ *) 0.47 (- *) 0.56 (+ ns) 0.61 (+ ns)
0.68 (+ **) 0.48 (- **) 0.44 (- ns) 0.53 (+ ns)
Order dataset
Mammals Birds Reptiles Amphibians
0.91 (+ *) 0.76 (+ **) 0.77 (+ *) 0.84 (+ **) Family dataset
Discrimination (AUC)
Mammals Birds Reptiles Amphibians
0.59 (+ ns) 0.48 (- * ) 0.39 (- ns) 0.73 (+ *) Order dataset
Mammals Birds Reptiles Amphibians
0.69 (+ *) 0.47 (- **) 0.41 (- ns) 0.42 (- ns)
+ : General improvement in calibration or discrimination capacity; : General decrease in calibration or discrimination capacity; **: P