The Astrophysical Journal, 488:L87–L90, 1997 October 20 q 1997. The American Astronomical Society. All rights reserved. Printed in U.S.A.
PHENOMENOLOGY OF THE LOCAL ANGULAR DIAMETER TO REDSHIFT RELATION I. E. Segal1 and J. F. Nicoll2 Received 1997 March 4; accepted 1997 August 21; published 1997 September 18
ABSTRACT A phenomenological study from first principles is made of the putative parameter p such that the redshift varies locally as the pth power of the distance. The Copernican principle implies that p 5 1 only with the further assumption that the redshift is a Doppler effect, which is not made here. For each p, predictions of cosmologyindependent quantities are derived from nonparametric maximum-likelihood estimates of the luminosity function, on the basis of the sample complete in angular diameter of de Vaucouleurs et al. (1991), consisting of more than 10,000 galaxies. These predictions are then compared with the directly observed values. Subject headings: cosmology: observations — galaxies: distances and redshifts — galaxies: luminosity function, mass function pression of corresponding relations between directly observable quantities such as the redshifts and the apparent magnitudes or angular diameters of the sources, which have an a priori known relation to distance. The absolute diameter M is an auxiliary concept that is definable in the same way as the absolute magnitude, by the equation
1. INTRODUCTION
The local redshift-distance law plays a fundamental role in cosmology and extragalactic observation. It therefore appears important that it be examined periodically. Some statistically efficient tests of complete samples at low redshifts have in fact been contraindicative of the linear law, and supportive of a square law (e.g., Segal & Nicoll 1996, Segal et al. 1993, Segal, Nicoll, & Blackman 1994a, Segal, Nicoll, & Wu 1994b, and references therein). However, the samples in question have mostly numbered only in the hundreds, have examined only two particular laws, and have focused on the observed fluxredshift relation. The ESO sample of de Vaucouleurs et al. (1991, hereafter RC3) is complete in angular diameter rather than in flux in the range 500 ! cz ≤ 15, 000 h km s21, and includes 11,508 galaxies in a complete sample. It is thus an important candidate for analysis in connection with the local redshift-distance relation. We summarize here the results of a statistically efficient and equitable study of the cosmological implications of this sample.
m 5 (5/p) log z 1 M 1 K.
(1)
Here K is a constant that washes out of the statistical analysis, and may be taken for present purposes as zero. The purpose of this analysis is to determine the best fitting value of p, in the sense of the capacity to predict the directly observed v-z relation. Having determined this value of p, distances r may then be determined from the relation z 5 Cr p , where C is a function of the cosmic distance scale, which must be independently estimated. For each value of p, or local “cosmology,” the luminosity function (LF) was derived by nonparametric maximum-likelihood estimation (Nicoll & Segal 1980, 1983). The LF is assumed constant in each bin, and these constants (which are the values of the differential LF) are the parameters that are subjected to maximum-likelihood estimation. In observational practice, bins are generally of the order of 1 mag, but on occasion 0.5 mag. For simplicity of interpretation, these fixed bin sizes are used for all values of p. However, the actual number of bins decreases as p increases, by almost a factor of 3 as p decreases from 1 to 3. Predictions of directly observable quantities are uniquely determined by the cosmology and the LF. A practical and observationally intelligible way to do this, which is used here, is by Monte Carlo simulations. In this, one constructs a random sample by drawings from the LF, which are placed successively at the observed redshifts, subject to the given limiting diameter. If the object appears too small at the redshift in question, it is rejected and the procedure is continued until an object of sufficiently large angular diameter (i.e., such that the apparent diameter at this redshift exceeds the limiting diameter) is obtained. Having set up in this way a random sample based on the given cosmology, its LF, and the given limiting angular diameter, one may then compute the statistic in question for this random sample, such as if it were an observed sample. This construction for random samples is then iterated an appropriate number N of times. The mean of the statistic in question in the N samples then provides a statistically consistent predicted value for it. Similarly, the standard error of the N-values of the statistic in the random samples is a
2. TECHNICAL PRELIMINARIES
No assumptions are made regarding the data other than the absence of discrimination in selection on the basis of apparent diameter, down to the reported limiting diameter of 19, in the range z ! 0.05. The basic physical assumption is the usual one that the absolute diameters are independent of the distances of the sample objects (or equivalently, that there is no evolution in angular diameter up to z 5 0.05). No assumption as to the spatial distribution of the objects is needed or made. We treat putative redshift-distance relations of the form z 5 Cr p, where r is the distance and p is a constant, the “redshift-distance exponent.” Objects at redshifts below 500 km s21 were excluded from the sample analyzed, resulting in a sample of 11,508 objects, for which D25 angular diameters are given. To facilitate comparison with other studies, we have used a Pogson scale, according to which the “geometric magnitude” m is defined as 25 log D 1 20, where D is the apparent diameter in arcminutes. The range of p was limited to 1 ≤ p ≤ 3. Inasmuch as extragalactic distances are not directly observable, a redshiftdistance law is in empirical terms essentially a succinct ex1 Massachusetts Institute of Technology, 77 Mass. Avenue, Cambridge, MA 02139;
[email protected]. 2 Institute for Defense Analyses, 1801 Beauregard Street, Arlington, VA 22311;
[email protected].
L87
L88
SEGAL AND NICOLL
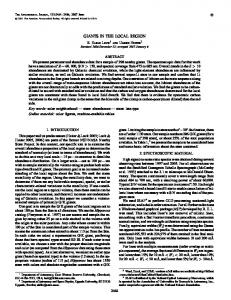
Fig. 1.—rms (in mag) of the deviations from the observed values of predictions of AmFzS in 10 redshift bins, as a function of the redshift-distance exponent, p. Here m is the apparent geometric magnitude and z is the geometric mean of the redshifts of the bin.
statistically consistent estimate of its standard error. In samples of more than 1000 galaxies, as here, N 5 25 is normally sufficient to insure stability; when more or different random samples are made, the changes in the predictions are inconsequential. The most basic measure of agreement between theory and observation is probably the rms of the deviations between the theoretical prediction for the mean magnitudes at given redshifts and the observed values of AmFzS. The theoretical prediction for AmFzS is the average with respect to the LF of M 1 (5/p) log z, where M denotes the absolute magnitude, in the region M 1 (5/p) log z ≤ m∗ , where m∗ denotes the sample limiting magnitude. More specifically, if f (M) is the differential LF, then the expected apparent magnitude at redshift z, in a sample with limiting magnitude m∗, takes the form m(z, p, f ) 5
E
[(5/p) log z 1 M] f (M)dM/
E
f (M)dM.
(2)
The integrals in equation (2) are over the range from 2` to the absolute magnitude M ∗(z) 5 m∗ 2 (5/p) log z, which is the faintest absolute magnitude for an object at redshift z that would be observed in a sample with limiting magnitude m∗ . The “rms error” is essentially the rms of the quantities mobs 2 m(z, p, f ), as z ranges over all the observed redshifts. The variation of this rms with p is dominated by the large intrinsic dispersion in M, in consequence of which the p-dependence is more visible when the sample is divided into some number n of equal-sized bins arranged in order of increasing redshift. The ranking in predictive efficiency of different values of p is substantially unchanged when this is done. Each mobs is correspondingly replaced by the mean mobs for the bin, and
Vol. 488
Fig. 2.—Deviations from its observed value of the predicted slope of the regression line of geometric magnitude on log redshift, as a function of the redshift-distance exponent p.
m(z, p, f ) by the corresponding mean of the theoretical predictions, as z varies over the bin. For simplicity, the value n 5 10 was used in Figure 1, below. The most traditional measure is perhaps the deviation of the predicted from the observed slope of the magnitude-redshift relation. The dispersion in apparent magnitude is cosmologically more sensitive than the slope, and reflects the possible existence of factors other than distance that affect redshifts. These factors include peculiar motions, random absorption, and other forms of noise that are incapable of model-independent removal. The existence of such factors would provide an additional source of dispersion that could not be taken into account in the theoretical prediction and thus would be likely to result in an underestimate of the magnitude dispersion. Both the slope and the magnitude dispersion were estimated from samples constructed by placing at the observed redshifts simulated objects randomly drawn from the LF subject to the limiting diameter. The mean of the corresponding quantities in each of 25 such samples is then the statistically appropriate theoretical prediction for it used below. 3. SUMMARY OF RESULTS
In order to be as far removed as possible from theoretical preconceptions, only the predictions for these cosmology-independent directly observed quantities were determined and compared with actual observation. The results are summarized in Figures 1, 2, and 3. Figure 1 shows the rms of the deviations of the predicted values of AmFzS in 10 redshift bins from the observed values of AmFzS in the bins. When the same is done for bins of size 1 object, the dispersion in absolute diameter nearly overwhelms the differences seen in Figure 1, but the relative ranking of the predictive power of the respective cos-
No. 2, 1997
LOCAL ANGULAR DIAMETER TO REDSHIFT RELATION
Fig. 3.—Deviations from its observed value of the predicted standard deviation of the geometric magnitudes, as a function of the redshift-distance exponent, p.
mologies is virtually unaffected. The slope of the redshift-distance relation is the origin of the concept of a relation between redshift and distance and is shown in Figure 2. The dispersion in apparent magnitude is shown in Figure 3.
L89
Fig. 4.—Same as Fig. 1 for regions of the sky as follows, in terms of galactic coordinates b and l, and supergalactic coordinates b9 and l9: (1) lbl ! 40, 0 ! l ! 180; (2) lbl 1 40, 180 ! l ! 360; (3) lbl ! 40, 0 ! l ! 180; (4) lbl ! 40, 0 ! l ! 180; (5) lb9l ! 30, 0 ! l9 ! 180; (6) lb9l 1 30, 0 ! l9 ! 180; (7) lb9l ! 30.
4. DISCUSSION
The possibility that variations in the magnitude-redshift relation across the sky could interact and combine to produce a specious apparent redshift-distance exponent was tested by separate treatment of different parts of the sky. The results regarding the rms, using the bins of size 0.5 mag. (more favorable to p 5 1 than bins of size 1.0 mag.) are shown in Figure 4. There is some variation from region to region, and the predictions of p 5 1 are relatively more accurate in certain supergalactic regions, considered by de Vaucouleurs & Bollinger (1979). However, the rms errors of p 5 2 are less than half those of p 5 1 in all the samples. The mean redshift of the sample treated here is 4775 km s21 and thus substantial relative to the redshifts involved in recent investigations of local extragalactic perturbations, but modest on a cosmic scale. The possibility that at higher redshifts, the predictive efficiency of p 5 1 would be enhanced was tested by studies of two higher redshift samples: (1) the QDOT IRAS sample of Saunders et al. (1990), in the range 500 ! cz ! 30,000 km s21, consisting of 1994 galaxies with a mean redshift of 9600 km s21, assumed complete to 0.6 Jy at 60 microns; (2) the EMSS-AGN X-Ray sample in the range 0 ! z ! 0.2, consisting of 176 AGNs with a mean redshift of 40,000 km s21, assumed complete to a limit of 2 flux units. The results for the rms, obtained by the procedure and Pogson scale as above, using LF bins of size 0.5 mag, are shown in Figure 5. They give no apparent indication for the applicability of a lower value for p at higher redshifts.
Fig. 5.—Same as Fig. 1 for two higher redshift samples: (a) QDOT IRAS sample, in range z ≤ 0.1 (1994 galaxies); (b) EMSS-AGN X-Ray sample, in range z ≤ 0.2 (176 AGNs).
L90
SEGAL AND NICOLL
It does not seem to be generally understood that the Copernican principle does not in itself imply p 5 1, but requires in addition the assumption that the redshift is a motion (or Doppler) effect. For example, in chronometric cosmology, in which the universe is fixed in size, there is no preferred position in space or time, while locally p 5 2. The redshift can be interpreted as of space curvature origin, as suggested by Hubble & Tolman (1935), in the Einstein universe (e.g., Segal & Zhou 1995), in which the curvature does not vary with time. The classic work of Milne (1935) suggests p 5 1 entirely on the basis of motion considerations.
Vol. 488 5. CONCLUSION
From a purely informational standpoint the value p 5 2 is indicated by the present study as approximately the most efficient overall for the representation of the cosmological thrust of the RC3 observations. Surprisingly, the value p 5 1 appears as overall the least efficient in the range 1 ≤ p ! 3 . These results are consistent with those of the studies cited above, and those summarized here, that test for possible effects of variations across the sky and of higher redshifts.
REFERENCES de Vaucouleurs, G., & Bollinger, G. 1979, ApJ, 233, 433 de Vaucouleurs, G., de Vaucouleurs, A., Buta, R. J., Corwin, H. G. Jr., Fouque, P., & Paturel, G. 1991, Third Reference Catalog of Bright Galaxies, Vol. 3, (New York: Springer) (RC3) Hubble, E., & Tolman, R. C. 1935, ApJ, 82, 302 Milne, E. A. 1935, Relativity Gravitation and World-Structure (Oxford: Clarendon) Nicoll, J. F., & Segal, I. E. 1980, A&A, 82, L3
Nicoll, J. F., & Segal, I. E. 1983, A&A, 118, 180 Saunders, W., et al. 1990, MNRAS, 242, 318 Segal, I. E., & Nicoll, J. F. 1996, ApJ, 465, 578 Segal, I. E., Nicoll, J. F., & Blackman, E. 1994a, ApJ, 430, 63 Segal, I. E., Nicoll, J. F., & Wu, P. 1994b, ApJ, 431, 52 Segal, I. E., Nicoll, J. F., Wu, P., & Zhou, Z. 1993, ApJ, 411, 465 Segal, I. E., & Zhou, Z. 1995, ApJS, 100, 307