Open Access Journal of Sports Medicine
Dovepress open access to scientific and medical research
ORIGINAL RESEARCH
Open Access Full Text Article
Laboratory- and field-based testing as predictors of skating performance in competitive-level female ice hockey
Tommy Henriksson 1,2 Jason D Vescovi 3 Anncristine FjellmanWiklund 4 Kajsa Gilenstam 1 1 Sport Medicine Unit, Department of Community Medicine and Rehabilitation, 2The National Graduate School of Gender Studies, Umeå University, Umeå, Sweden; 3 Faculty of Kinesiology and Physical Education, University of Toronto, Toronto, ON, Canada; 4Physiotherapy Unit, Department of Community Medicine and Rehabilitation, Umeå University, Umeå, Sweden
Objectives: The purpose of this study was to examine whether field-based and/or laboratorybased assessments are valid tools for predicting key performance characteristics of skating in competitive-level female hockey players. Design: Cross-sectional study. Methods: Twenty-three female ice hockey players aged 15–25 years (body mass: 66.1±6.3 kg; height: 169.5±5.5 cm), with 10.6±3.2 years playing experience volunteered to participate in the study. The field-based assessments included 20 m sprint, squat jump, countermovement jump, 30-second repeated jump test, standing long jump, single-leg standing long jump, 20 m shuttle run test, isometric leg pull, one-repetition maximum bench press, and one-repetition maximum squats. The laboratory-based assessments included body composition (dual energy X-ray absorptiometry), maximal aerobic power, and isokinetic strength (Biodex). The on-ice tests included agility cornering s-turn, cone agility skate, transition agility skate, and modified repeat skate sprint. Data were analyzed using stepwise multivariate linear regression analysis. Linear regression analysis was used to establish the relationship between key performance characteristics of skating and the predictor variables. Results: Regression models (adj R2) for the on-ice variables ranged from 0.244 to 0.663 for the field-based assessments and from 0.136 to 0.420 for the laboratory-based assessments. Singleleg tests were the strongest predictors for key performance characteristics of skating. Single leg standing long jump alone explained 57.1%, 38.1%, and 29.1% of the variance in skating time during transition agility skate, agility cornering s-turn, and modified repeat skate sprint, respectively. Isokinetic peak torque in the quadriceps at 90° explained 42.0% and 32.2% of the variance in skating time during agility cornering s-turn and modified repeat skate sprint, respectively. Conclusion: Field-based assessments, particularly single-leg tests, are an adequate substitute to more expensive and time-consuming laboratory assessments if the purpose is to gain knowledge about key performance characteristics of skating. Keywords: exercise physiology, test methodology, sport, physiological characteristics
Introduction Correspondence: Tommy Henriksson Sports Medicine Unit, Department of Community Medicine and Rehabilitation, Umeå University, Gösta Skoglunds väg 3, Umeå SE-90187, Sweden Tel +46 90 786 66 11 Email
[email protected]
Ice hockey is a high-intensity intermittent contact sport with high physical demands of the neuromuscular and cardiovascular systems.1 Performance in ice hockey is determined through an interaction of several factors, which poses challenges to capture all aspects that could potentially impact the ability to compete at a high level.2 The assessment of physical and physiological attributes is considered a valuable component for monitoring player development, talent identification, as well as prediction of specific performance variables, such as skating.3–5 So far, most research regarding 81
submit your manuscript | www.dovepress.com
Open Access Journal of Sports Medicine 2016:7 81–88
Dovepress
© 2016 Henriksson et al. This work is published and licensed by Dove Medical Press Limited. The full terms of this license are available at https://www.dovepress.com/terms. php and incorporate the Creative Commons Attribution – Non Commercial (unported, v3.0) License (http://creativecommons.org/licenses/by-nc/3.0/). By accessing the work you hereby accept the Terms. Non-commercial usesetof al. theThis work work are permitted withoutbyanyDove furtherMedical permission Dove Medical Limited, provided the workCommons is properlyAttribution attributed. ForLicense. © 2016 Henriksson is published PressfromLimited, and Press licensed under a Creative permission for commercialTheusefull of this work,ofplease see paragraphs 4.2 and 5atof http://creativecommons.org/licenses/by/4.0/. our Terms (https://www.dovepress.com/terms.php). The license permits unrestricted use, distribution, terms the License are available
http://dx.doi.org/10.2147/OAJSM.S109124
and reproduction in any medium, provided the original author and source are credited.
Dovepress
Henriksson et al
physiological factors associated with skating performance are based on males.6 Research on female hockey, and particularly competitive-level female hockey, is somewhat limited.5 However, because of different biological, sociocultural, and financial preconditions, knowledge of male hockey cannot outright be applied on female hockey.7 Thus, while skating is considered the most important skill in ice hockey,8 factors that might best explain key performance characteristics of skating in competitive-level female ice hockey remains largely unknown. Consequently, it is also currently unknown whether laboratory- or field-based tests are best suited for assessing key performance characteristics of skating in competitivelevel female ice hockey.4,9,10 Laboratory-based assessments are performed under wellcontrolled environments, provide highly accurate outcomes, and might replicate the physiological demands of ice hockey; however, they require expensive equipment, expertise, are time-consuming, and lack movement specificity11 in comparison to field-based assessments.12 Some researchers have indicated that field-based testing is a valid predictor for successful performance in male ice hockey,10,13 while others considered field-based testing as proxies for specific components of hockey performance.14,15 This is a relatively unexplored area in female ice hockey; however, one recent study16 has indicated that field-based assessments can be used to predict speed and recovery ability in lower level (division III) female ice hockey. Currently, no study has compared the predictive value of physiological and physical outcomes from laboratory- and field-based protocols to key performance characteristics of skating. Thus, the purpose of this study was to examine whether field-based and/or laboratory-based assessments are valid tools for predicting key performance characteristics of skating in competitive-level female hockey players. In accordance with the principle of specificity, exercise adaptions are specific to the mode and intensity of training.17 As much of
the time for a skater is spent on one leg,18 our hypothesis is that single-leg exercises are more sport-specific for a hockey player and will thus provide more useful information regarding key performance characteristics of skating than two-leg exercises.
Methods This study had a cross-sectional design, and the protocol was reviewed and approved by the Regional Ethical Review Board at Umeå University, Department of Medical Research (Dnr: 2012-22-31M). Experimental procedures and study risks were verbally described, and written informed consent was obtained from the participants (and parents when appropriate) prior to volunteering in the study. Prior to testing, participants completed a questionnaire regarding general health status, assuring they were not sick, injured, or using any medication that could affect their health or performance. The participants were instructed to refrain from food and caffeine within 3 hours of testing. Twenty-three female ice hockey players volunteered for the study (Table 1). Athletes were recruited from a single team participating in the highest league (Riksserien) in Sweden. Participants had 10.6±3.2 years of playing experience, typically trained 9–10 hours, and competed in two games per week. The participants were tested pre- (n=18) or postseason (n=5). Inter- and intraday testing order was standardized (Table 2). Physiological and performance assessments were
Table 1 Participant characteristics (n=23) Variable
Mean ± SD
Range
Age (years) Body mass (kg) Body height (cm) DXA body fat (%) DXA lean body mass (kg)
18.04±2.14 66.11±6.27 169.45±5.50 25.57±4.73 46.67±4.23
15.00–25.00 56.90–79.70 158.70–179.50 17.00–34.50 37.11–53.38
Abbreviations: DXA, dual X-ray absorptiometry; SD, standard deviation.
Table 2 Testing schedule: inter- and intraday testing order Field-based assessments
On-ice tests
Laboratory-based assessments
Day 1
Day 2
Day 3
Day 4
Anthropometrics 20 m sprint Squat jump Countermovement jump Bosco 30-second repeated jump test Standing long jump Single-leg standing long jump 20 m shuttle run
1RM squat 1RM bench press Isometric leg pull
Agility cornering s-turn Cone agility skate Transition agility skate MRSS
DXA Maximal aerobic power Isokinetic strength
Notes: Days 1–2 were performed off-ice, day 3 on-ice, and day 4 in laboratory. Days 1–3 were performed during 3 consecutive days, followed by day 4 approximately 1–2 weeks later. At least 5 minutes of recovery was provided between trials to minimize fatigue. Abbreviations: DXA, dual X-ray absorptiometry; MRSS, modified repeat skate sprint; 1RM, one-repetition maximum.
82
submit your manuscript | www.dovepress.com
Dovepress
Open Access Journal of Sports Medicine 2016:7
Dovepress
Laboratory- and field-based testing
Table 3 Test data (n=23) Description Field-based assessments Isometric leg pull (kg) Isometric leg pull (kg/kg body mass) Squat – 1RM (kg) Squat – 1RM (kg/kg body mass) Bench press – 1RM (kg) Bench press – 1RM (kg/kg body mass) Beep test (km) Bosco test fatigue (%) Standing long jump (m) Standing long jump right (m) Squat jump (cm) Countermovement jump (cm) Sprint 20 m (s) Laboratory-based assessments Biodex quadriceps 90°/s peak torque (N·m) Biodex quadriceps 90°/s peak torque/bw (%) Biodex quadriceps 90°/s time to peak (MSEK) Biodex quadriceps 90°/s total work (J) Biodex quadriceps 210°/s peak torque (N·m) Biodex quadriceps 210°/s peak torque/bw (%) Biodex quadriceps 210°/s time to peak (MSEK) Biodex quadriceps 210°/s total work (J) Ergo meter cycle test (mL/kg/min) Ergo meter cycle test (L/min) On-ice performance variables MRSS total time (s) Transition agility average (s) Cone agility average (s) S-cornering average (s)
Mean ± SD
Range
111.25±14.28 1.65±0.26 89.79±14.17 1.37±0.19 47.03±6.70 0.72±0.09 1.70±2.67 0.74±0.10 2.03±0.16 1.71±0.15 26.04±3.82 28.02±5.13 3.50±0.18
89.50–139.70 1.20–2.10 60.00–115.00 1.01–1.70 35.00–60.00 0.50–0.89 1.04–2.14 0.58–1.01 1.71–2.39 1.33–1.98 19.30–33.60 16.72–37.80 3.21–3.98
142.12±21.03 217.02±33.62 416.09±104.48 802.55±124.95 106.25±17.08 162.54±28.98 219.13±91.70 1,022.39±148.88 47.24±6.16 3.11±0.42
96.80–176.90 151.80–268.00 190.00–590.00 625.60–1,108.80 84.60–148.20 121.80–241.80 110.00–480.00 778.40–1,384.50 37.90–59.20 2.30–4.00
62.28±3.81 11.93±0.89 9.47±0.47 9.6±0.28
55.81–72.09 10.73–14.10 8.53–10.55 8.88–10.23
Note: All Biodex measurements represent right-side values. Abbreviations: min, minutes; MRSS, modified repeat skate sprint; s, seconds; 1RM, one-repetition maximum; SD, standard deviation.
performed during 4 days through field-based, laboratorybased, and on-ice tests (Table 3). Days 1–3 were performed during 3 consecutive days in the team’s own premises, followed by day 4 approximately 1–2 weeks later at Umea University’s sport-testing facility. The interval between laboratory and field tests was required because of traveling distance to our laboratory and in consideration to the team’s own activities. Prior to any physical testing, the participants performed a standardized warm-up of ∼10 minutes, including exercises such as jogging, shuffling, sprinting, skating, and dynamic stretching exercises. Prior to each performance, test procedures were thoroughly introduced and demonstrated so the participants were familiar with the criteria for correct execution. Furthermore, the participants were allowed to some test trials before each of the actual tests. Day 1 was performed in the gym. Body mass was measured to the nearest kilogram (kg) with a digital scale (Fitbit Aria, WS-30; Fitbit Inc., San Francisco, CA, USA). Height
Open Access Journal of Sports Medicine 2016:7
was measured to the nearest 0.5 cm with the participant standing against a flat wall and a rectangular object placed concurrently against both the subject’s head and the wall.19 Timing gates (ChronoJump Co., Barcelona, Spain; Version 1.3.9.0) were used for the 20 m sprint. Participants began the test from a stationary sprint start with one foot in line with the laser. Participants were allowed a voluntary start and received two trials with at least 2 minutes of recovery in between trials. The best score was recorded to the nearest 0.01 s. The countermovement and squat jump tests as well as the 30-second repeated jump tests were performed as described by Bosco20 using a Chronojump (ChronoJump Co.; Version 1.3.9.0). For the countermovement and squat jump tests, each subject received three trials with at least 60 seconds of rest in-between jumps. The best of three trials was recorded to the nearest 0.1 cm. For the 30-second repeated jump tests, the height of every jump was recorded to the nearest 0.1 cm. Dropoff percent was calculated and recorded to the nearest 0.1%.
submit your manuscript | www.dovepress.com
Dovepress
83
Dovepress
Henriksson et al
The standing long jump was performed with toes behind the start line; participants performed a countermovement and jumped as far forward as possible. Participants were provided with at least 60 seconds of rest between attempts. Distance was measured to the back edge of the nearest heel, and the best of three trials was recorded to the nearest 1 cm. Single-leg standing long jumps were performed following the same procedures. Participants took off from a single leg but were instructed to land on both feet to reduce the risk of injury. The 20 m shuttle run (Beep test) was performed according to the procedure of Léger and Lambert.21 Briefly, participants ran back-and-forth on a 20 m course being paced by audible beeps, which become progressively faster. When participants failed to reach two consecutive end lines on time, the test was terminated and the total completed distance (m) was recorded as the result. Day 2 was performed in the gym. The one-repetition maximum (1RM) back squat and 1RM bench press were performed following the procedures described by Fleck and Kreamer.22 For a successful squat attempt, participants must lower until their hamstrings/thighs were parallel to the floor. For a successful bench press attempt, participants must lower the bar until it touches the chest, while retaining the feet, buttocks, and shoulders in contact with the surface. Participants were instructed to reach 1RM within four to five attempts to avoid fatigue; 2–4 minutes of rest between the sets were mandatory. The maximal approved load was registered as their result. Isokinetic leg pull was performed using a strength dynamometer (Vetek AB, Vaddo, Sweden; VZ101BH 500 kg). The
17.7 m
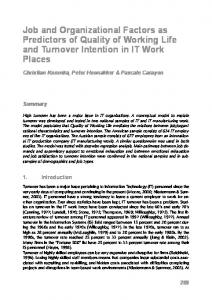
participants were instructed to stand upright on the base of the dynamometer with the feet shoulder width apart, arms hanging straight down to hold the center of the bar with both hands, palms facing the body. The chain was adjusted so that the bar was set just below the kneecaps. In this position, back slightly bent, forward at the hips, head held upright, the participants were instructed to pull as hard as possible and try to straighten their legs without bending their back. No jerky movements were allowed. Participants received two trials with 2–3 minutes rest in between, and the maximum force was recorded to the nearest 0.1 kg. Day 3 was performed on-ice. Participants were tested wearing full equipment, including their stick. The agility cornering s-turn test was modified from the protocol of Gilenstam et al7 by reducing the distance between goal lines to 17.7 m. Participants began behind the goal, completed an s-shaped pattern around the face-off circles, and finished by the nearest blue line (Figure 1A). Participants started at the blue line for the cone agility test, skated as quickly as possible around three pylons situated on the center red line (two cones) and blue line (one cone), and finished back over the blue line (Figure 1B).15 The transition agility test followed the protocol of the National Skills Standards and Testing Program published by Hockey Canada.23 The participants started on the line at the bottom of circle, skated forward to far right-side pylon, pivoted, and skated backward to lower side pylon. The participants then pivoted and skated forward to left-side pylon, pivoted, and skated backward to lower left pylon. The participants then pivot and skate forward over the far goal line at the far end of the circle (Figure 1C).
8.8 m Goal
Start 7.32 m 9.12 m
Start
22.5 m A
9.12 m
7.32 m
B
Goal
C
9.12 m
Goal 53 m
D
Start
35.4 m
Figure 1 Description of on-ice tests. Notes: A: Agility cornering s-turn, B: cone agility, C: transition agility, D: modified repeat skate sprint.
84
submit your manuscript | www.dovepress.com
Dovepress
Open Access Journal of Sports Medicine 2016:7
Dovepress
The modified repeat skate sprint (MRSS) test was modified from the one described by Bracko and George3 by having the athletes skate four repetitions of 88.4 m on a 30-second clock. Participants skated from one end line to the other (53 m) and then returned to the initial blue line (35.4 m). After each repetition, the athletes had the remainder of 30 seconds for recovery before the next repetition was initiated (Figure 1D). Participants received two trials on each test (except for the MRSS). The direction was reversed for the second trial. Dual hand-timed stopwatches were used to record the time. The average between the two trials was recorded to the nearest 0.01 second. Day 4 was performed in the laboratory. Body composition was assessed via Lunar iDXA (GE Medical Systems Lunar, WI, USA; Encore Version 14.10.022). DXA is considered a reliable method for clinical assessment of body composition.24 Maximal aerobic fitness was assessed via direct gas analysis using a ramp protocol, which was applied using an electronically braked cycle ergometer (Monark 839E) to volitional fatigue. The initial intensity was 40 W with 40 W increments every 3 minutes up to the attainment of a blood lactate concentration of 4 mmol/L, at which point intensity was increased 20 W every 30 seconds to volitional fatigue. The participants were asked to pedal at 70–80 rpm for the duration of the test. Expired respiratory gases were measured continuously using a Jaeger Oxycon Pro system Version 5.3 (Viasys Healthcare, Conshohocken, PA, USA). Values for O2 were averaged over 20 seconds with the highest value recorded as O2 peak. An indwelling catheter was used to sample venous blood following each stage and analyzed for blood lactate concentration (YSI 2300 STAT PLUS; Yellow Springs International, Yellow Springs, OH, USA). Participants then recovered for 4 hours before isokinetic strength was assessed through a calibrated isokinetic dynamometer for the knee flexors and extensors (Biodex System 4; Biodex Co., New York, NY, USA) as illustrated by Gilenstam et al7 each leg assessed in random order. Following some test-specific warm-up repetitions in the dynamometer, participants were given a 2-minute recovery period before performing the test. Participants performed five maximal concentric (utilizing quadriceps and hamstrings) contractions in the knee joint, at the angular velocity of 90°/s, and ten maximal contractions at 210°/s, separated by a 2-minute recovery period. Peak torque/kg body mass and total work were recorded at both speeds. Data were analyzed by using SPSS 22.0 (IBM Corporation, Armonk, NY, USA).
Open Access Journal of Sports Medicine 2016:7
Laboratory- and field-based testing
Data were analyzed for patterns of missing values, which showed that much information would likely be lost if simple list-wise deletion was used. Little’s25 missing completely at random test failed to reject the null hypothesis, which indicated that missing values were completely random. Missing values confirmed as random allowed data transformation through maximum likelihood estimation. The method uses all available data to identify the parameter values with the highest probability of producing the sample data and replace missing values.26 Data were tested for normality through Shapiro–Wilks test, P>0.05, which indicated normality. Pearson’s product–moment correlation was used to assess relationships between right and left leg values in all single-leg exercises. The analysis showed right and left leg values to be significantly correlated (r=0.586–0.950, P