Lack of Evidence for Vasoactive and Inflammatory Mediators in the Promotion of Macular Edema Associated with Epiretinal Membranes Brooks P. Applewhite, M.D.1#, Savalan Babapoor-Farrokhran, M.D.1#, David Poon, M.D.1, Syed Junaid Hassan, M.S.1, Elizabeth Wellmann, A.A.1, Howard S. Ying, M.D., Ph.D.2, Gregg L. Semenza M.D., Ph.D.3, Silvia Montaner M.P.H., Ph.D.4, and Akrit Sodhi M.D., Ph.D.1* #B.P.A. and S.B.F. contributed equally to this manuscript. 1Wilmer
Eye Institute, Johns Hopkins University School of Medicine, Baltimore, MD 21287, USA of Ophthalmology, Boston University School of Medicine, Boston, MA 02346, USA 3Vascular Program, Institute for Cell Engineering; Departments of Pediatrics, Medicine, Oncology, Radiation Oncology, Biological Chemistry, and Genetic Medicine, Johns Hopkins University School of Medicine, Baltimore, MD, 21205, USA 4Department of Oncology and Diagnostic Sciences, School of Dentistry; Department of Pathology, School of Medicine; Greenebaum Cancer Center, University of Maryland, Baltimore, MD 21201, USA 2Department
Running head: Vasoactive cytokines, Macular Edema & Epiretinal Membranes
*Correspondence: Akrit Sodhi, M.D., Ph.D. Wilmer Eye Institute, Johns Hopkins School of Medicine 400 N. Broadway St., Smith Building, 4039 Baltimore, MD 21287, United States FAX: 410-614-8577 Email:
[email protected]
Applewhite et al., S1
List of Supplement Elements:
eTable 1 eTable 2 eFigure 1 eTable 3 eFigure 2 eTable 4 eTable 5
Applewhite et al., S2
eTable 1. Characteristics of patients with fovea-involving ERMs. Patient
Age
Sex
Phakic Statusa
OCT CST (μm)
VA
VA LogMAR
P1 P2 P3 P4 P5 P6 P7 P8 P9 P10
59 70 79 68 62 82 70 72 68 78
F F F M M M M M F F
P P PP PP P PP P P PP P
353 353 397 432 451 488 544 585 614 642
20/20 -1 20/50 -1 20/25 -2 20/40 20/63 +2 20/50-1 20/60 20/80 +2 20/150 20/30
0.020 0.418 0.137 0.301 0.458 0.418 0.477 0.562 0.875 1.176
(a) Phakic status at the time of sample collection. P, phakic; PP, pseudophakic; OCT, optical coherence tomography; CST, central subfield thickness; VA, visual acuity.
Applewhite et al., S3
eTable 2. Pre- and post-operative characteristics of patients with idiopathic ERMs with ME used in analyses. Patient
Phakic Statusa
Pre-Op OCT CST (μm)
Pre-Op VA
Pre-Op VA LogMAR
ERM 1 ERM 2 ERM 3 ERM 4 ERM 5 ERM 6 ERM 7 ERM 8 ERM 9 ERM 10 ERM 11 ERM 12 ERM 13 ERM 14 ERM 15 ERM 16 ERM 17 ERM 18 ERM 19 ERM 20 ERM 21 ERM 22 ERM 23 ERM 24 ERM 25 ERM 26 ERM 27 ERM 28 ERM 29 ERM 30 ERM 31
PP PP P P P P P P PP P P P P P P P PP P PP P P PP P P P P P PP P P PP
266 273 331 341 362 410 419 441 457 460 505 518 547 570 588 610 299 387 402 410 418 419 420 427 436 457 482 505 514 544 614
20/160 -1 20/20 -1 20/160 -1 20/40 20/100 20/200 20/40 20/50 -1 20/30 20/30 20/150 20/40 -2 20/40 -2 20/80 20/70 +1 20/64 20/150 20/60 +2 20/50 -1 20/40 +3 20/40 -2 20/40 20/50 -2 20/40 20/25 20/60 +2 20/32 20/60 20/32 -2 20/35 -2 20/150
0.923 0.020 0.923 0.301 0.699 1.000 0.301 0.418 0.176 0.176 0.875 0.341 0.341 0.602 0.524 0.505 0.915 0.437 0.418 0.241 0.341 0.301 0.438 0.301 0.097 0.437 0.224 0.477 0.244 0.283 0.338
Post-Op OCT CST (μm) 223 -223 433 428 367 295 400 380 445 352 382 360 419 432 423 -284 390 331 368 314 351 356 353 547 491 338 413 406 458
Post-Op VA
Post-Op VA LogMAR
20/50 -20/50 20/40 20/20 20/60 20/25 -1 20/20 20/20 20/60 20/70 20/30 -2 20/20 20/200 20/20 20/50 -20/40 -1 20/40 20/25 -1 20/20 20/32 20/25 +2 20/30 20/32 +2 20/40 -1 20/50 20/25 -2 20/20 20/20 20/70
0.398 -0.398 0.301 0.000 0.477 0.117 0.000 0.000 0.477 0.544 0.216 0.000 1.000 0.000 0.398 -0.321 0.301 0.117 0.000 0.204 0.057 0.176 0.164 0.321 0.398 0.137 0.000 0.000 0.544
(a) Phakic status at the time of sample collection. P, phakic; PP, pseudophakic. OCT, optical coherence tomography; CST, central subfield thickness; VA, visual acuity. Mean time separating pre-op and post-op visual acuity and CST assessment is 164 days (range 21-400 days).
Applewhite et al., S4
600
0.8
**
***
n=29
500 n=29
400
300
Visual Acutiy LogMAR
n=29 0.6
n=29 0.4
0.2
p Po
st
-O
O ePr
p Po
st
-O
O ePr
p
0.0
200 p
Central Subfield Thickness (um)
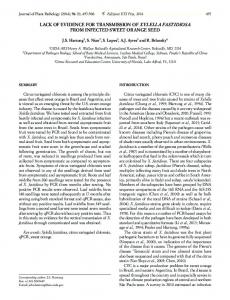
eFigure 1. CST and visual acuity outcomes for patients with ERM with ME following surgical intervention. A B
Surgical outcomes for idiopathic epiretinal membranes (ERMs) with ME as reflected by change in central subfield thickness (CST) (A) and visual acuity (B). Mean time separating preop and post-op visual acuity and CST assessment is 164 days (range 21-400 days).
Applewhite et al., S5
eTable 3. Patient characteristics of vitreous samples analyzed with ELISA and cytokine array. Patient ERM Patients ERM 1 ERM 2 ERM 3 ERM 4 ERM 5 ERM 6 ERM 7 ERM 8 ERM 9 ERM 10 ERM 11 ERM 12 ERM 13 ERM 14 ERM 15 ERM 16 ERM 17 ERM 18 ERM 19 ERM 20 ERM 21 ERM 22 ERM 23 ERM 24 ERM 25 ERM 26 ERM 27 ERM 28 ERM 29 ERM 30 ERM 31 ERM 32 ERM 33 ERM 34
Age
Sex
Diabetes Mellitus
71 70 72 61 67 91 66 67 59 65 60 79 58 66 59 59 91 68 65 71 73 73 64 60 59 65 46 68 73 63 68 62 84 79
F M F M F F M M M F M F M F F F M F M F F F M M F F F F M M F M F M
Yes No Yes No No Yes No No No No Yes No No No Yes No No No Yes No No No No No Yes No No No No No No No No No
Applewhite et al., S6
eTable 3. Patient characteristics of vitreous samples analyzed with ELISA and cytokine array (continued). ERM 35 ERM 36 ERM 37 ERM 38 ERM 39 ERM 40 ERM 41 ERM 42 ERM 43 ERM 44 ERM 45 ERM 46 ERM 47 ERM 48 Control Patients Control 1 Control 2 Control 3 Control 4 Control 5 Control 6 Control 7 Control 8 Control 9 Control 10 Control 11 Control 12 Control 13 Control 14 Control 15 Control 16 Control 17 Control 18 Control 19 Control 20 Control 21
65 75 67 59 70 81 56 62 71 63 70 79 69 63
M M F F F M F M M M F M F M
No No No No No No No No No No No No No No
76 86 92 60 71 73 70 78 62 64 62 43 61 65 74 84 55 46 70 74 85
F M F F M M M F M M F F F F M F M M M F F
Yes No No No No No No No No No No No No No No No No No No No No
Applewhite et al., S7
eTable 3. Patient characteristics of vitreous samples analyzed with ELISA and cytokine array (continued). Control 22 Control 23 Control 24 Control 25 Control 26 Control 27 Control 28 Control 29 Control 30
74 45 82 74 64 58 51 85 52
M M M F M F M M F
No No No No No No No No No
Applewhite et al., S8
eFigure 2. Cytokines in the array with similar concentrations in patients with ERM with ME and control patients. E 250000 A control
Chitinase 3-like
Control Patients
mild
Mild Edema
moderate
Moderate Edema
severe
ERM
Severe Edema
200000
control
Angiogenin mild
moderate severe
ERM
C Complement Factor D
control
mild
moderate
150000
Mean Density
B
100000
severe
ERM
D RBP4
control ERM
mild
moderate
50000
severe
0 Chitinase 3-like1
Angiogenin
Complement Factor D
RBP4
Cytokine arrays identified 4 out of 102 proteins (A) chitinase 3-like 1, (B) angiogenin, (C) complement factor D, and (D) retinol binding protein 4 (RBP4) that were present with similar concentrations amongst controls and patients with ERMs with mild, moderate, and severe ME. (E) Intensity analysis of dot blot showing mean density of spots from 4 cytokines. Densities are normalized to internal assay controls.
Applewhite et al., S9
eTable 4. List of cytokines identified in the cytokine array whose levels were increased in ERM patients with severe ME compared to ERM patients with mild or moderate ME and to control patients. Gene/Cytokine CCL2/MCP-1 HGF SHBG ENG/Endoglin FGF2/FGF basic IFNG/IFN-gamma ANGPT2 BDNF IL1A/IL-1a BSG/EMMPRIN KLK3/Kallikrein 3 PTX3/Pentraxin 3
Control (n=8) 0 0 0 0 0 0 0 0 0 0 0 1
Mild (n=4) 0 0 0 0 0 0 0 0 0 0 0 0
Moderate (n=4) 0 0 0 0 0 0 0 0 0 0 0 0
Severe (n=8) 5 4 3 3 3 3 3 3 3 3 3 5
MCP-1: monocyte chemotactic protein-1; HGF: hepatocyte growth factor; SHBG: sex hormone binding globulin; FGF: fibroblast growth factor; IFN-gamma: interferon gamma; ANGPT2: angiopoietin 2; BDNF: brain-derived neurotrophic factor; IL-1α: interleukin-1α; EMMPRIN: extracellular matrix metalloproteinase inducer; PTX3: pentraxin 3.
Applewhite et al., S10
eTable 5. List of ERM patients with severe ME with elevated levels of each of the cytokines identified in the cytokine array. Gene/Cytokinea CCL2/MCP-1 HGF SHBG ENG/Endoglin FGF2/FGF basic IFNG/IFN-gamma ANGPT2 BDNF IL1A/IL-1a BSG/EMMPRIN KLK3/Kallikrein 3 PTX3/Pentraxin 3
ERM 9
ERM 10 2.72 55.00 4.78 1.23 0.31 1.49 2.96 2.47 1.60 0.26 1.00 2.20
ERM 11 2.11
0.77
ERM 12 5.20 112.30 5.30 6.44 3.57 6.28 9.05 6.61 2.25 4.08 2.45 3.99
ERM 13 1.00 1.00 1.00 1.00 1.00 1.00 1.00 1.00 1.00 1.00 1.00 1.00
ERM 14 3.61
ERM 15
ERM 16 30.20
1.53
(a) Values presented are fold-inductions normalized to patent ERM 13 who expressed the lowest recorded mean density for the majority of the listed cytokines among the subset of ERM patients with severe ME. MCP-1: monocyte chemotactic protein-1; HGF: hepatocyte growth factor; SHBG: sex hormone binding globulin; FGF: fibroblast growth factor; IFN-gamma: interferon gamma; ANGPT2: angiopoietin 2; BDNF: brain-derived neurotrophic factor; IL-1α: interleukin-1α; EMMPRIN: extracellular matrix metalloproteinase inducer; PTX3: pentraxin 3.
Applewhite et al., S11