Land Use Classification using Convolutional Neural Networks Applied to Ground-Level Images Yi Zhu and Shawn Newsam Electrical Engineering & Computer Science University of California at Merced
arXiv:1609.06653v1 [cs.CV] 21 Sep 2016
yzhu25,
[email protected] ABSTRACT Land use mapping is a fundamental yet challenging task in geographic science. In contrast to land cover mapping, it is generally not possible using overhead imagery. The recent, explosive growth of online geo-referenced photo collections suggests an alternate approach to geographic knowledge discovery. In this work, we present a general framework that uses ground-level images from Flickr for land use mapping. Our approach benefits from several novel aspects. First, we address the nosiness of the online photo collections, such as imprecise geolocation and uneven spatial distribution, by performing location and indoor/outdoor filtering, and semisupervised dataset augmentation. Our indoor/outdoor classifier achieves state-of-the-art performance on several benchmark datasets and approaches human-level accuracy. Second, we utilize high-level semantic image features extracted using deep learning, specifically convolutional neural networks, which allow us to achieve upwards of 76% accuracy on a challenging eight class land use mapping problem.
Categories and Subject Descriptors I.4.8 [Image Processing and Computer Vision]: Scene Analysis; H.2.8 [Database Management]: Database Applications—spatial databases and GIS ; I.5.4 [Pattern Recognition]: Applications
Keywords Geo-referenced images, land use classification, convolutional neural networks, indoor/outdoor image classification
1.
INTRODUCTION
Innovative geographic knowledge discovery is becoming increasingly possible through analyzing large-scale online geotagged photo collections. For example, the authors in [7] recently introduced an approach called “timelapse mining” for synthesizing time-lapse videos of popular landmarks. Another interesting line of work that deals with image gePermission to make digital or hard copies of all or part of this work for personal or classroom use is granted without fee provided that copies are not made or distributed for profit or commercial advantage and that copies bear this notice and the full citation on the first page. Copyrights for components of this work owned by others than ACM must be honored. Abstracting with credit is permitted. To copy otherwise, or republish, to post on servers or to redistribute to lists, requires prior specific permission and/or a fee. Request permissions from
[email protected]. SIGSPATIAL ’15, November 03-06, 2015, Bellevue, WA, USA Copyright 2015 ACM ISBN 978-1-4503-3967-4/15/11 ...$15.00 DOI: http://dx.doi.org/10.1145/2820783.2820851.
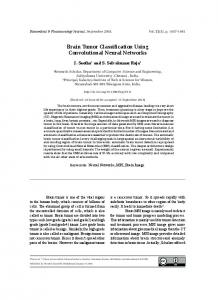
Figure 1: Sample ground-level images of Stanford University. What can these images tell us about the various land use classes found on the campus? olocation was initiated by Hays and Efros [4] and explores the problem of estimating the spatial coordinates of an image using a large dataset of images with known location. Other work, such as that of [13], leverages large collections of geotagged images to discover spatially varying cultural differences among concepts such as “wedding cake”. There are also individual projects such as the marvelous “Geotaggers” World Atlas by Erik Fischer, who aims to discover the world’s most interesting places and the routes that people follow between them. There remain many opportunities for novel geographic knowledge discovery from this rich but complex data that is being acquired by millions of citizen sensors. In this work, we focus on the challenging problem of mapping land use. The salient contributions of our work include: • We map a broader range of land use classes than previous work [6]. • We utilize semantic image features learned by training convolutional neural networks, a form of deep learning, on a large collection of scene images. • We develop an indoor/outdoor image classifier which achieves state-of-the-art performance. It helps correct for image location errors. • Region shape files are used to further correct for image location errors as well as to create precise maps. • A base set of training images is generated in an automated fashion and then augmented in a semi-supervised fashion to address class imbalance.
2.
RELATED WORK
Our work has several lines of related research. Large-scale geotagged photo collections Computer vision researchers have been leveraging large collections of geotagged photos for geographic discovery for around a decade. This includes mapping world phenomenon [2], multimedia geo-localization [4], landmark recognition [10], smart city [9], land cover and land use classification [6, 8] and ecological discovery. However, online photo collections are a noisy dataset, which presents a number of challenges in using them for geographic discovery. We address two of these challenges here. We use a semi-supervised learning framework to create a balanced training dataset, and we use shape files and indoor/outdoor classification to reduce geolocation error. Convolutional neural networks Deep learning is advancing a number of pattern recognition and machine learning areas. Deep convolutional neural networks (CNNs) have resulted in often surprising performance gains in a range of computer vision problems [5]. These networks, whose training is made possible by the large-scale parallelization of graphical processing units (GPUs), consist of a number of convolutional layers which learn increasingly higher-level or semantic feature maps followed by one or more fully connected layers which perform classification. Indeed, in this paper, we use features learned from a large-scale scene classification task and achieve very promising results. Land cover and land use classification Land cover classification is typically performed through the automated analysis of overhead imagery; e.g., the national land cover database (NLCD). However, the NLCD Level II (16 classes) overall accuracy for the 2006 map is only 78% [11]. Land use classification is even more difficult since it is often not possible from an overhead vantage point. However, the maps produced by land cover and land use classification are critical for a range of important societal problems. Researchers have performed some initial investigation into using ground-level photo collections for land cover [8] and land use [6] classification, but there remains significant opportunity to expand upon this initial work.
3.
LAND USE CLASSIFICATION
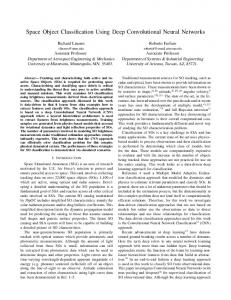
We focus on land use classification on a university campus since it represents a compact region containing a range of classes, and for which manually generating a ground truth is feasible. We consider eight land use classes on the Stanford University campus: Study, Residence, Hospital, Park, Gym, Playground, Water and Theater. Figure 1 shows the map of the Stanford University campus from OpenStreetMap1 and figure 2(a) shows the ground truth land use map that we manually created. We use the Flickr API to download images located within the campus region, and each downloaded image is assigned a land use label according to its geographic location on the ground truth map. The workflow of our proposed framework is illustrated in figure 3 and will be discussed in the following sections.
Figure 3: Workflow of the proposed framework. FE indicates image feature extraction. The dashed rectangle corresponds to the hierarchical model which incorporates indoor/outdoor classification. related) images and reduces our dataset from 79,658 images to 16,789; (2) Precision: The ground truth land use map in figure 2(a) was generated using the shape files. It is very precise and could be published with very few modifications such as overlaying the street network. Compared with the tiling approach of previous work [6, 11], incorporating shape files results in maps that are significantly more geo-informative.
3.2
Dataset Augmentation
We note, however, our campus dataset is quite unbalanced because of the uneven spatial distribution of Flickr photos. We thus propose a semi-supervised approach to augment the training set. This approach has three benefits: (1) it results in a balanced, richer training set; (2) it sets aside the vast majority of images with location for the test set; and (3) it is efficient and largely automated. The proposed procedure first randomly selects 20% of each category in the geolocated dataset as the base training set, and the remaining geolocated images form the test set. Next, we perform a simple keyword search on Flickr for additional training images and augment the base training set with these auxiliary images which results in approximately 3,000 images per category. In addition to the actual category name, we perform searches using related keywords. We find the top retrievals are largely relevant and result in an effective augmented training set as demonstrated by our results below.
3.3
High-Level, Semantic Image Features
We use the polygonal outlines of the land use regions to filter noisy images and to produce more precise maps. Using the shape files as in figure 2(a) has two benefits: 1). Filtering: We ignore the images which do not fall in one of the regions we want to classify. This removes a lot of noisy (un-
Prior to recent advances in deep learning as applied to computer vision, image classification and scene understanding tasks largely utilized hand-crafted low-level features or combinations thereof. With the advent of large scale CNNs, we now have access to mid- to high-level image features that are derived in a data-driven fashion. These features have resulted in improved performance for a wide range of computer vision problems. Our work in this paper uses such features from a pretrained CNN model. The authors in [14] introduce a large scene-centric dataset called Places with over 7 million labeled images. We use their released CNN-205 model2 to extract our image features which are from layer seven as they perform better for our problem.
1
2
3.1
Geo-Filtering with Shape Files
https://www.openstreetmap.org/
http://places.csail.mit.edu/
(a)
(b)
(c)
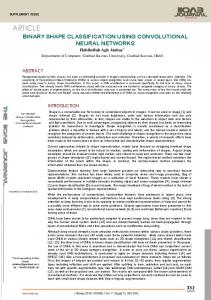
Figure 2: (a) Ground truth land use map. Gray, brown, red, dark green, yellow, light green, blue, and purple indicate study, residence, hospital, park, gym, playground, water, and theater, respectively. (b) Predicted land use maps without indoor/outdoor classification. (c) With indoor/outdoor classification. Table 1: Precision, recall, and F1 scores for image-level land use classification. Study Residence Hospital Park Gym Playground Water Theater Average
3.4
Precision Recall F1 score
0.5289 0.7952 0.6352
0.6282 0.3596 0.4574
Without 0.3145 0.4762 0.3788
indoor/outdoor classification 0.8168 0.9676 0.9653 0.7165 0.8627 0.9772 0.7633 0.9121 0.9712
0.6638 0.6814 0.6725
0.7823 0.8128 0.7973
0.7084 0.7102 0.6985
Precision Recall F1 score
0.5581 0.8092 0.6606
0.6315 0.3771 0.4721
With indoor/outdoor classification 0.4465 0.8352 0.9726 0.9666 0.5868 0.7342 0.8767 0.9810 0.5071 0.7815 0.9222 0.9737
0.7155 0.7155 0.7155
0.7972 0.8277 0.8121
0.7404 0.7385 0.7306
Indoor/Outdoor Classification
While we cannot correct completely for images falling into the wrong region, we can use semantic-level signals, such whether an image is of an indoor or outdoor scene, to improve our land use classification. The details of our hierarchical classification framework are as follows. Training phase: 1) We first train an indoor/outdoor classifier leveraging the SUN dataset [12], then use this classifier to separate the training set into indoor and outdoor training sets (for each land use class); 2) We then train two eight-way land use classifiers, one for indoor images and another for outdoor images. Test phase: 1) An incoming photo is first classified as indoor or outdoor; 2) We then use the corresponding classifier to assign the final land use label. To our knowledge, our indoor/outdoor classifier is shown to outperform state-of-the-art methods on several evaluation datasets. We achieve 98.64% accuracy on the IITM-SCID2 dataset3 and 99.15% on the Fifteen Scene Categories dataset4 . We also test with the latest SUN dataset (908 categories) to demonstrate the scalability and generalizability of our indoor/outdoor classifier. The best reported performance on this dataset is 91.15% [1], while we obtain 97.09% on 66,406 test images.
3.5
Experiments and Results
This section contains the experiments and results of our land use classification. We present image-level and regionlevel (map-level) performance. We first present results without indoor/outdoor classification and then with. 3 4
http://www.cse.iitm.ac.in/∼vplab/SCID/ http://www-cvr.ai.uiuc.edu/ponce grp/data/
3.5.1
Land Use Classification without In/Out
Here we train a single eight-way linear SVM classifier. The training set has 24,349 images (approximately 3,000 per class) and the test set has 13,435. The SVM is implemented using the LIBLINEAR package [3], and the hyperparameter C is determined using five-fold cross-validation. We apply the trained classifier to each test image. We label the map regions using majority vote of the contained images. A few regions do not contain any images. We do not attempt to label these regions. We obtain 77.55% classification accuracy at the image-level. This is a solid result considering how noisy the Flickr images are with respect to location and content. This result is a testament to the highlevel image features extracted using the CNNs as well as our training set augmentation. Table 1 lists the precision, recall, and F1 values for each category. Performance for the hospital class is the worst, possibly due in-part to the relatively low number of test images. Recall for the residence class is also quite low, possibly because it is quite comprehensive, including dorms, dining areas, party spaces, offices, indoor sports, etc. We now label the map regions using the majority vote of the contained images. The result in figure 2(b) is shown to be very similar to the ground truth map in figure 2(a). 28 of the 178 regions contain no images and are ignored. We correctly classify 98 of the remaining 150 for an accuracy of 65.33%.
3.5.2
Land Use Classification with In/Out
We apply our hierarchical classification framework in which a test image is first classified as indoor or outdoor and then assigned a land use label. As described in section 3.4, this helps compensate for geolocation error as well allows the fi-
nal eight-way classification to be more discriminative since we now have two classifiers, one for indoor images and another for outdoor images. Indoor images will be less likely to be labeled as park, playground, or water. And, there should be fewer misclassifications of indoor images amongst the study, residence, hospital, gym, and theater classes. The indoor land use classifier achieves 76.84% image-level accuracy while the outdoor one achieves 80.85%. Taken together, this is an improvement over the non-hierarchical results. It also indicates that it is slightly easier to discriminate between the eight land use classes for the outdoor images than the indoor ones. The region-level results are displayed as a map in figure 2(c). Now only 36 regions are misclassified for an accuracy of 76.00%. This is a big improvement over the non-hierarchical approach.
4.
READY-TO-PUBLISH MAPS
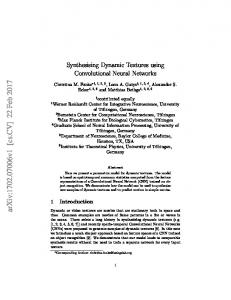
As mentioned earlier, the use of shape files in our approach results in spatially precise land use maps. With minor postprocessing, our maps are ready to publish. To demonstrate, we overlay a road map of the Stanford University region from Wikimapia on our generated map. After adding a title and legend, and making a few minor revisions (e.g., changing the color of the background), the generated land use map is shown in figure 4.
Figure 4: Our ready-to-publish land use map of the Stanford University region.
5.
[1] C. Chen et al. Large-Scale Indoor/Outdoor Image Classification via Expert Decision Fusion (EDF). In ACCV, 2014. [2] D. Crandall et al. Mapping the World’s Photos. In WWW, 2009. [3] R.-E. Fan et al. LIBLINEAR: A Library for Large Linear Classification. Journal of Machine Learning Research, 2008. [4] J. Hays and A. Efros. IM2GPS: Estimating Geographic Information from A Single Image. In CVPR, 2008. [5] A. Krizhevsky et al. ImageNet Classification with Deep Convolutional Neural Networks. In NIPS, 2012. [6] D. Leung and S. Newsam. Exploring Geotagged Images for Land-Use Classification. In ACM MM Workshop, 2012. [7] R. Martin-Brualla et al. Time-lapse Mining from Internet Photos. ACM SIGGRAPH, 2015. [8] H. Oba et al. Towards Better Land Cover Classification using Geo-tagged Photographs. International Symposium on Multimedia, 2014. [9] S. Paldino et al. Urban Magnetism Through the Lens of Geo-tagged Photography. arXiv 1503.05502, 2015. [10] N. Snavely et al. Modeling the World from Internet Photo Collections. IJCV, 2008. [11] J. D. Wickhama et al. Accuracy Assessment of NLCD 2006 Land Cover and Impervious Surface. Remote Sensing of Environment, 2013. [12] J. Xiao et al. SUN Database: Large-scale Scene Recognition from Abbey to Zoo. In CVPR, 2010. [13] K. Yanai et al. Detecting Cultural Differences using Consumer-Generated Geotagged Photos. In Workshop on Location and the Web, 2009. [14] B. Zhou et al. Learning Deep Features for Scene Recognition using Places Database. In NIPS, 2014.
DISCUSSION
Our results above demonstrate that land use classification is possible using high-level image features extracted using CNNs from geolocated ground-level images. We believe our framework is ready to be applied to more complex and larger areas for which land use maps are not available or need to be updated, as long as there are a sufficient number of geolocated images. A significant result of our work is showing that high-level, semantic image features extracted using pre-trained CNN models generalize well to related problems. This has very practical implications for researchers wanting to extract geographic information from georeferenced ground-level images. They do not need to buy expensive GPUs since these are only needed to train the models; feature extraction can be performed using standard computing hardware. They also do not need to go through the effort of configuring the models (which is often still through trial-and-error) nor spend the hours to days needed to train them. The fact that the high-level, semantic features allowed us to achieve such good performance using simple linear SVM classifiers further demonstrates the efficiency gain. The training time of our linear SVMs with over 20,000 samples of a 4,096-dimension feature vector is only 2.3 seconds on a Dell workstation with a 3.3 GHz quad-core CPU and 32GB RAM.
6.
CONCLUSION
We presented a framework for land use classification using geolocated ground-level images. Our approach maps a broader range of classes than previous work on this problem; uses high-level semantic image features extracted using CNNs, a form of deep learning; incorporates a novel, state-of-the-art indoor/outdoor classifier to help account for geolocation error; augments the training dataset in a semisupervised fashion; and uses region shape files to produce precise maps. We achieve upwards of 76% accuracy on a challenging eight-class land use classification problem.
7.
ACKNOWLEDGEMENTS
This work was funded in part by a National Science Foundation CAREER grant, #IIS-1150115.
8.
REFERENCES