18th World IMACS / MODSIM Congress, Cairns, Australia 13-17 July 2009 http://mssanz.org.au/modsim09
Land-Use Sequence Optimiser (LUSO): A simulation model for analysing strategic and tactical decisions regarding ‘break crops’ in agricultural rotations Renton M. 12 and R. Lawes 2 1
School of Plant Biology, M084, University of Western Australia, 35 Stirling Highway, Crawley, WA, 6009 2 CSIRO Sustainable Ecosystems, Floreat, WA, Australia Email:
[email protected]
Abstract: To grow beans, or not to grow beans, that is the question! Or in other words: how should I use this piece of land in front of me? This paper presents a preliminary design and implementation of a model called Land-Use Sequence Optimiser (LUSO). The model was designed to be a tool for finding optimal landuse sequences, with a particular focus on analysing the role of break crops within these optimal sequences. The model can also be used to analyse the sensitivity of optimal land-use sequences and the place of various break crops in these sequences to changes in model parameters. The focus of this paper is on describing the design concept and modelling approach used for LUSO and on showing how it can be used for analysing a problem, rather than giving details on parameterisations or results for particular cases. LUSO can be thought of as a state-and-transition model for valuing land-use sequences. It incorporates representations of weed biology and population dynamics, plant disease burden, soil nitrogen status, and a range of crop and management options. The model must be provided with a list of possible land-uses, each defined by a set of parameter values, and another set of ‘general’ parameter values that are not specific to a particular land-use. It is based on a one-year time step and assumes that every year is an ‘average’ year. The current version of the model represents a single land-use area, such as a paddock, and simulates how the state of this land-use area changes from year to year according to different land-uses. This model state includes representations of the number of seeds in the weed seed bank, and measures of disease burden and soil nitrogen status. The state is then used to predict the production and cost of the land use, which then provides an over-all long-term value for the land-use sequence. Several other routines and methods have been added to the basic land-use simulation – including optimisation and sensitivity analysis routines. The optimisation routines can be used to find answers to longer-term strategic questions, such as what is the optimal long-term sequence of crops to grow, or shortterm tactical decisions, such as whether to harvest the crop that is currently being grown. The sensitivity analysis routines can be used to analyse how sensitive these answers are to various model parameters, which in turn allows an analysis of what factors are most important in choosing between tactical and strategic options. To illustrate these ideas, an example problem involving a tactical decision is presented; a farmer is faced with the decision between either harvesting a crop for immediate profit or sacrificing the crop and the immediate profit for longer-term benefits. A description of how LUSO was applied to analysing this problem is provided, together with sample output. I conclude the paper by pointing out that the strength of the LUSO modelling approach is its relative simplicity, transparency and efficiency. This means that it is relatively easy and quick to both adapt the model to address a new question, and then use the model to carry out the analysis. I also point out some directions where this approach could be usefully extended in future. Keywords: crop rotations, optimisation, population dynamics, weeds, disease, nitrogen
581
Renton, Land-Use Sequence Optimiser (LUSO)
1.
INTRODUCTION
Using a field or paddock within a farm for different purposes at different times, known as crop rotation or land-use sequencing, is an agricultural practice that has been used for many centuries to increase crop production and profitability (Castellazzi et al. 2008). The choice of which sequence of crops to use may be based on financial, agricultural, or environmental aims (Castellazzi et al. 2008), such as a desire to maximise profit or yield, or to minimise weed population growth (Doole and Pannell 2008), nitrogen leaching (Malone et al. 2007) or ground water drainage and salinity (Verburg et al. 2007). The bottom line, however, is usually profit, although this may be constrained by other considerations. In southern Australian farming systems, wheat is generally the most profitable crop, and other crops are often considered to be ‘break crops’. These break crops are included in the system not because of their own profitability, but because of their ‘system benefits’, which means the extent to which they can improve the profitability of the overall land-use sequence (Kirkegaard et al. 2008). Some of the main factors driving the inclusion of break crops in Australian land-use sequences instead of continually growing wheat include weeds, disease, and soil nitrogen status. The population of certain species of weeds will tend to build up when wheat is grown, due to limited herbicide control options, and break crops provide options for controlling these weeds. Similarly, certain diseases that reduce wheat yields will tend to build up with a sequence of wheat crops, but be significantly reduced by growing a break crop instead. Soil nitrogen levels will also tend to run down with a succession of wheat crops, which means that fertiliser must then be bought and applied, but legume break crops can fix soil nitrogen and thus provide ‘free’ nitrogen for subsequent crops. Understanding, predicting and analysing the place of break crops in a system thus requires a good understanding of a number of different processes. In a wheat-dominated southern Australian farming system, we would need to understand the population dynamics of important weed species that affect wheat and important wheat diseases, and the effects of different land-use options on these population dynamics. We would also need to understand how disease burden and weed numbers will affect the yield and profitability of wheat crops and break crops. Similarly we would need to understand the effects of land-use options on soil nitrogen status and the effect of soil nitrogen status on the cost and yield of different crops, and thus their profitability. Some of these effects, such as weeds with high levels of seed dormancy, will play out over a relatively long term and these long-term effects must be accounted for. Moreover, the cumulative effects of these different drivers and the interaction between them need to be understood as well. Modelling and simulation would appear to offer a means to integrate our knowledge of these different drivers and thus provide a tool for understanding and analysing the role of break crops in land-use sequences. Various models have been used recently to represent and analyse crop rotations. For example, ROTOR is a tool for generating and evaluating site-specific and agronomically sustainable crop rotations for organic farming systems in central Europe (Bachinger and Zander 2007). Castellazzi et al. (2008) present a systematic and rigorous mathematical representation of crops rotations based on Markov chain models. Models of cropping systems have been used to investigate gene escape from transgenic oilseed rape varieties (Colbach et al. 2005) and network flows have been used for modelling optimal crop sequences for the purpose of inclusion in whole farm models (Detlefsen and Jensen 2007). MIDAS (Morrison et al. 1986) is a well-established whole-farm economics model that includes a representation of certain fixed crop sequences and a single ‘break crops effect’ representing all biological drivers. But these crop rotation models do not include representations of the biological dynamics and long-term effects of weed populations, disease burden and soil nitrogen. The economics of long-term weed population dynamics and management have been represented in models such as Ryegrass Integrated Management (RIM) (Pannell et al. 2004) and the dynamics of soil nitrogen levels can be analysed in crop growth models such as APSIM (Keating et al. 2003), but understanding the place of break crops in a system requires all of these important drivers to be included in one model. Trying to link existing models such as RIM and APSIM would be very complex, because these models are already relatively complex. This high complexity would mean a lack of model transparency, a large number of parameters – many with uncertain values – and a large amount of time and resources required for simulation analysis. The demand for simulation time and resources would be particularly high due to the combinatorial nature of the problem, with multiple land-use options possible each year over a number of different years, especially since we would like to optimise over all possible land-use sequences and then conduct sensitivity analysis on the results of this optimisation. Similar complexity and problems would result from trying to include more realistic and longer-term population dynamics in whole-farm models such as MIDAS. Therefore, there is a need for a new model that focuses on the most important drivers determining the place of break crops in land-use sequences while keeping model complexity to a minimum.
582
Renton, Land-Use Sequence Optimiser (LUSO)
This paper presents a preliminary design and implementation of such a model. The model is called Land-Use Sequence Optimiser (LUSO), since it was designed to be a tool for finding optimal land-use sequences. In particular, it was designed to analyse the role of break crops within these optimal sequences. It can also be used to analyse the sensitivity of optimal land-use sequences and the place of various break crops in these sequences to changes in model parameters. The model structure is presented first, including an overview and a brief description of the weed, disease and nitrogen submodels. The optimisation and sensitivity analysis capabilities of LUSO are discussed next. An example problem involving a tactical decision is then presented, with a description of how LUSO was applied to analysing this problem. Some concluding remarks close the paper. This paper focuses on describing the design concept and modelling approach used for LUSO and a description of how it can be used for analysing a problem, rather than giving details on parameterisations or results for particular cases. 2. 2.1.
MODEL STRUCTURE Overview
LUSO is a simulation model for analysing tactical and strategic decisions in agricultural rotations. The model was designed to focus on understanding the role of break crops in rotations. LUSO incorporates representations of weed biology and population dynamics, plant disease burden, soil nitrogen status, and a range of crop and management options. The current version of the model represents a single land-use area, such as a paddock, and assumes that every year is an ‘average’ year. The model must be provided with a list of possible land-uses, each defined by a set of parameter values, and another set of ‘general’ parameter values that are not specific to a particular land-use. LUSO can be thought of as a state-and-transition model for valuing land-use sequences. The model is based on a one-year time step. It represents the state of the agricultural system at the start of each year. This includes the number of seeds in the weed seed bank, and measures of disease burden and soil nitrogen status. The initial state is defined using the ‘general’ parameter values set by the user. LUSO also contains a set of rules for calculating the profit realised for a given year, given the state of the system at the start of the year and the land-use option chosen for that year. As well as the profit, these rules also specify how the state of the system changes during the year, resulting in a new system state for the start of the next year. Given a land-use sequence over a number of years, these rules are applied iteratively to represent how the system state changes from year to year and to thus give the profit each year. These annual profits can then be discounted and summed to give a total profit over the period, representing the value of this land-use sequence. The simplest way to use LUSO is to value a particular land-use sequence, but this capacity can then be used in more sophisticated ways. For a given set of parameters, we can optimise by searching for the sequence that gives the highest profit. We can look at how the profit for a given sequence changes as one or more model parameters vary. We can compare a number of different sequences to see how all their profits change as parameters vary, and thus how which sequence is optimal depends on different parameters. These LUSO analyses can be done from a ‘strategic’ perspective, simply analysing which are the optimal sequences overall with any choice possible in any year, or they can be done from a ‘tactical’ perspective, where there are a limited number of choices for the current year, but a full set of choices for subsequent years. 2.2.
Weed, Disease and Nitrogen Submodels
The weed submodel can be thought of as two functions: one function that gives a percentage reduction on yield based on the weed seedbank density at the beginning of year n, and a second function that determines weed seedbank density at the beginning of year n+1 given the weed seedbank density at the beginning of year n and the land-use option employed during year n. The function used for the current version of the weed submodel is based on the well-established hyperbolic model (Firbank and Watkinson 1985), modified by parameters representing the effective herbicide kill rate, weed germination rate and the proportion of set weed seed returned to the seedbank. The hyperbolic function gives the weed seed set, based on parameters including crop sowing density, established weed density, crop competitive index and weed competitive index. It also gives the penalty to the crop yield. Similarly, the disease submodel consists of two functions: one that gives a percentage reduction on yield based on the disease burden at the beginning of year n and a second that gives disease burden at the beginning of year n+1 given the disease burden at the beginning of year n and the land-use option employed during year n. In the current version, disease burden is represented directly as a percentage penalty on crop
583
Renton, Land-Use Sequence Optimiser (LUSO)
yield. The function that maps disease burden from year to year is basically an exponential growth model that is reset to zero whenever a non-wheat crop is grown. An additional component of the disease submodel prohibits certain non-wheat crops from being grown in succession. The current version of the nitrogen submodel can be thought of as a single function that gives the nitrogen status of the soil at the start of year n+1 based on the land-use option employed during year n ie. the nitrogen status of the soil at the start of year n+1 does not depend on the soil nitrogen status at the start of year n. Positive nitrogen status does not effect crop yield, but rather acts by reducing the amount of nitrogen fertiliser required for the subsequent crop, with consequent reduced cost. 3.
OPTIMISATION AND SENSITIVITY ANALYSIS
While the basis of LUSO described above can be thought of as a tool for valuing a given land-use sequence, several other routines and methods have been added to the basic model. These include optimisation and sensitivity analysis. 3.1.
Optimisation
The optimisation routines built into LUSO can be used to determine the optimal land-use sequence (or a near optimal land-use sequence) for a given set of model parameters. They can also be used to select the best n land-use sequences (or n near-optimal land-use sequences). The default optimising routine is based on a full factorial search that simply evaluates all possible land-use sequences, keeps a record of the best n found, and returns a list of these best n sequences. Other optimisation routines based on heuristic search algorithms, such as genetic algorithms and simulated annealing, have also been designed for LUSO. These heuristic search algorithms are faster than a full search but generally can only be relied on to return near-optimal solutions rather than an exact list of the best n optimal solutions. They are therefore useful when the number of landuses and years is large, and thus the number of possible solutions is large, and thus the time required for a full factorial search is impractically high, but they are less useful when a full factorial search is feasible and an exact answer is desired, as is the case with sensitivity analysis. As well as the use of optimisation to analyse long-term strategic decisions regarding optimal sequences planned several years in advance, the optimisation routines can also be used to analyse tactical decisions regarding a choice to be made in the present or near future. The possible choices must first be represented as possible land-use options. The first year of the optimal land-use sequence is then fixed as the first of these tactical options, and then the optimisation routine is used to find the optimal sequence over all subsequent years. The profit value of this sequence is then the optimal profit value of choosing the first tactical option. The first year of the optimal land-use sequence is then fixed as the second of these tactical options and then the optimisation routine is again used to find the optimal sequence over all subsequent years. The profit value of this sequence is then the optimal profit value of choosing the second tactical decision. This procedure continues until all tactical options have been evaluated, and the optimal tactical option is the one with the best overall long-term value. 3.2.
Sensitivity Analysis
LUSO also includes a number of sensitivity analysis routines. The simplest of these examines the effect of a change in a model parameter value on the profit value of a given land-use sequence. It simply takes a range of values for a parameter value of interest, evaluates the land-use sequence for each of these values, and returns a function mapping each of the parameter values to the resulting profit value of the sequence. This procedure can then be carried out for a number of land-use sequences of interest, giving a visual representation of how the profit value of each sequence varies with the changing model parameter. This shows clearly how the value of the model parameter affects both the optimal profit and exactly which of the sequences is optimal. Another sensitivity routine can be used to analyse tactical decisions regarding a choice to be made in the present or near future, as described above. This routine looks at how the optimal tactical decision in a given situation depends on the value of one or model parameter. In this case, the optimisation routines are used to evaluate the long-term value of each possible tactical decision, just as described above, but for a range of values of the model parameter(s) of interest. An example of such an analysis is given below.
584
Renton, Land-Use Sequence Optimiser (LUSO)
4.
AN EXAMPLE PROBLEM: A TACTICAL DECISION
I now present an example problem involving a tactical decision regarding break crops and land-use sequences together with a description of how LUSO could be used to analyse this decision. 4.1.
The Problem
A farmer has chosen to sow a lupin crop. As the end of the growing season approaches, she realises that there is a high weed density in the crop. She considers the option of ‘manuring’ the crop instead of harvesting it. Manuring means killing the crop before it is mature, either by spraying it with herbicide or ploughing it. It means that no harvest will be made and thus any potential income from the crop will be sacrificed, leading to short-term financial loss. But it also means that weed set is likely to be substantially reduced, with long-term benefits for the system, such as reduced weed control costs and/or increased yield in future. It is also likely to cause increased nitrogen status for the following crop, since no nitrogen will be removed in the grain. What should the farmer do – manure or harvest? 4.2.
Parameterisation
Before the problem can be analysed, the model must be parameterised. This is relatively easy for LUSO, since the number of parameters is relatively small. There are 12 ‘general’ parameters in the current version, including, for example, the number of year simulated, the initial seedbank, annual weed germination proportion, the maximum weed seed set, the cost of nitrogen fertiliser, and the future profit discounting rate. There are also 11 ‘land-use’ parameters required for each land-use to be entered into the analysis, including, for example, the yield, price and cost of the land-use, the units of nitrogen required, the disease multiplication factor, the weed survival percentage and the weed seed return rate. Analysing a new problem will often require a few parameter values to be changed from default values, or a couple of new land-uses to be entered and others removed, but the default values of most parameters will normally be acceptable. For example, for this particular problem, it would be necessary to add a ‘manured lupins’ option to the land-use sequence list if that was not already included.. 4.3.
LUSO Analysis
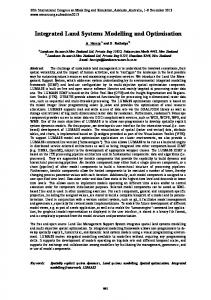
For a given set of parameter values, LUSO will determine the optimal decision – manure or harvest – and give a long-term profit valuation of each. Exactly how ‘long-term’ this valuation is will depend on the number of future years for which long-term effects of the current decision will be simulated, and the discount rate applied. Setting a shorter time frame or a higher discount rate will tend to select for short-term profit, while a longer time frame and a lower discount rate will tend to select for longer-term benefits. The sensitivity of this solution to model parameters can then be analysed. This may be useful when there is some uncertainty about the value of the model parameter value. However, perhaps more interestingly, in a management decision context, it enables an analysis of which factors the tactical decision should be based on. Some examples of sensitivity analysis can illustrate this. The four plots in Figure 1 show examples of how the overall long-term values of the two tactical decisions change as one model parameter varies. The first figure showing sensitivity to price is the simplest; the value of harvested lupins changes with the price paid for lupins, but the value of the manured lupins does not. Harvesting the lupins becomes optimal only when the price paid is high enough, otherwise the long-term benefits of manuring are more beneficial. It is thus clear that the tactical decision will depend on the expected lupin price. In the next plot, ‘season’ is a measure of how good the season is, or in other words how high the expected yield is. Higher yields increase the value of manured lupins, because more biomass means more nitrogen returned to the soil for the subsequent crop, but it increases the value of harvested lupins faster, since greater yield will mean more direct profit. Still, in this case, harvesting the lupins is only optimal if the predicted yield is very high. ‘Weed seed return in manured lupins’ will depend on how mature the weed seeds already are when the tactical decision is made – an early decision to manure will result in lower seed return while delaying the decision means that weeds may be maturing and setting viable seed. It will also depend on how effective the manuring option is expected to be in reducing viable weed seed set. Clearly less efficient weed seed control (higher weed seed return) does not affect the value of harvesting lupins, but does reduce the value of manuring lupins. The final plot shows the affect of seed bank size, which is a surrogate for weed density. A farmer wrestling with the decision of whether to manure or harvest her lupin crop could take a walk in the paddock and look at weed density. High weed density, indicating a high weed seed bank, would indicate that manuring would be the optimal long-term decision, while a low weed density, indicating a low weed seed bank, would indicate that harvesting would be the optimal long-term decision.
585
Renton, Land-Use Sequence Optimiser (LUSO)
Figure 1. Examples of sensitivity analysis of tactical decision output by LUSO, showing how the longterm profit value of two tactical options varies with changing values of four different model parameters. It is clear that the tactical decision depends on many factors, only some of which are represented in Figure 1. In fact, the decision is likely to depend on combinations of factors rather than factors in isolation. For example, what if the weed density in the field is high, indicating that manuring is the right thing to do, but the expected lupin yield is also high, making harvesting a more attractive option? Figure 2 shows results of an example two-way sensitivity analysis in LUSO, where the effects of weed seed bank (weed density) and expected lupin yield are considered in combination. Unsurprisingly, the analysis shows that at high weed seed bank levels and low expected yields, overall long-term profit will inevitably be low, while when expected yield is high, overall long-term profit will be high. It also shows that when expected yield is high, the optimal decision is always to harvest, while if expected yield is low, the optimal decision depends on the weed seedbank size.
Figure 2. Examples of two-way sensitivity analysis output by LUSO. The plot on the left shows the difference in long-term profit value between two tactical options: harvesting or manuring lupins, and how it varies as two model parameters vary. Positive values represent values where harvesting is more profitable, negative values where manuring is more profitable, and the black line shows where the options are equal in value. The plot on the right shows how the optimal long-term profit value (the best of the two options) changes with the same parameters. Dotted lines represent standard parameter values. 586
Renton, Land-Use Sequence Optimiser (LUSO)
5.
CONCLUDING REMARKS
LUSO is a new model that represents the long-term dynamics of the most important drivers determining the place of break crops in land-use sequences while keeping model complexity to a minimum. The model provides a theoretical framework for finding optimal land-use sequences, analysing the role of break crops within these optimal sequences, analysing the place of various break crops to changes in model parameters and analysing the sensitivity of optimal land-use sequences to changes in model parameters. Furthermore, it allows tactical decisions regarding land-use sequences and break crops to be optimised and analysed in terms of variation to model parameters that represent real-world factors that would be important in making these decisions. Because complexity and parameterisation requirements have been kept low, the model is relatively quick to optimise and analyse, and it is also relatively easy and quick to adjust the model to address new issues or questions. Future extensions to the model that are likely to increase the usefulness and range of application of the model include incorporating seasonal weather variability and its effect on yield, weeds and disease. This could be in the form of stochastic variation, to address issues of risk and risk management, or long term changes in climate. It would also be useful to consider price variability for this kind of analysis. Anther potentially useful extension would be adding a simple representation of multiple paddocks to address spatial constraints imposed by the need to manage disease with crop rotation and spatial separation. ACKNOWLEDGMENTS The author acknowledges valuable input from Roger Lawes, Michael Robertson, Bill Bowden, Art Diggle and Bill McLeod in designing the LUSO model and its weed, disease and nitrogen submodels. Thanks also to the helpful comments of the two anonymous reviewers. REFERENCES Bachinger, J., and Zander, P. (2007), ROTOR, a tool for generating and evaluating crop rotations for organic farming systems. European Journal of Agronomy, 26(2), 130-143. Castellazzi, M., Wood, G., Burgess, P., Morris, J., Conrad K. and Perry J. (2008), A systematic representation of crop rotations. Agricultural Systems, 97(1-2), 26-33. Colbach, N., Fargue, A., Sausse, C., and Angevin, F. (2005), Evaluation and use of a spatio-temporal model of cropping system effects on gene escape from transgenic oilseed rape varieties: Example of the GeneSys model applied to three co-existing herbicide tolerance transgenes. European Journal of Agronomy, 22(4), 417-440. Detlefsen, N.K. and Jensen, A.L. (2007), Modelling optimal crop sequences using network flows. Agricultural Systems, 94(2), 566-572. Doole, G. and Pannell, D. (2008), Role and value of including lucerne (Medicago sativa L.) phases in crop rotations for the management of herbicide-resistant Lolium rigidum in Western Australia. Crop Protection, 27(3-5), 497-504. Firbank, L.G. and Watkinson, A.R. (1985), On the analysis of competition within two-species mixtures of plants. The Journal of Applied Ecology, 22(2), 503-517. Keating, B.A., Carberry, P.S., Hammer, G.L., Probert, M.E., Robertson, M.J., Holzworth, D., Huth, N.I., Hargreaves, J.N.G., Meinke, H., Hochman, Z., McLean, G., Verburg, K., Snow, V., Dimes, J.P., Silburn, M., Wang, E., Brown, S., Bristow, K.L., Asseng, S., Chapman, S., McCown, R.L., Freebairn, D.M. and Smith, C.J. (2003), An overview of APSIM, a model designed for farming systems simulation. European Journal of Agronomy, 18(3-4), 267-288. Kirkegaard, J., Christen, O., Krupinsky, J. and Layzell, D. (2008), Break crop benefits in temperate wheat production. Field Crops Research, 107(3), 185-195. Malone, R., Huth, N., Carberry, P., Ma, L., Kaspar, T., Karlen, D., Meade, T., Kanwar, R. and Heilman, P. (2007), Evaluating and predicting agricultural management effects under tile drainage using modified APSIM. Geoderma, 140(3), 310-322. Morrison, D.A., Kingwell, R.S., Pannell, D.J. and Ewing, M.A. (1986), A mathematical programming model of a crop-livestock farm system. Agricultural Systems, 20(4), 243-268. Pannell, D., Stewart, V., Bennett, A., Monjardino, M., Schmidt, C. and Powles, S. (2004), RIM: a bioeconomic model for integrated weed management of Lolium rigidum in Western Australia. Agricultural Systems, 79(3), 305-325. Verburg, K., Bond, W., Brennan, L. and Robertson, M. (2007), An evaluation of the tactical use of lucerne phase farming to reduce deep drainage. Australian Journal of Agricultural Research, 58(12), 1142-1158.
587