Jul 12, 2016 - Radar (InSAR) and Object-Based Image Analysis (OBIA), and ..... were exploited, as shown in Table 1: PSI techniques were used in ... (a) Location of LIM case study area in South Tyrol (Austria/Italy) on Google Earth™ support layer; ... recognition of soil evidences, such as double crests and trenches,.
Remote Sensing Applications: Society and Environment 4 (2016) 92–108
Contents lists available at ScienceDirect
Remote Sensing Applications: Society and Environment journal homepage: www.elsevier.com/locate/rsase
Landslide mapping and monitoring by using radar and optical remote sensing: Examples from the EC-FP7 project SAFER N. Casagli a, F. Cigna b, S. Bianchini a,n, D. Hölbling c, P. Füreder c, G. Righini d, S. Del Conte e, B. Friedl c, S. Schneiderbauer f, C. Iasio g, J. Vlcko h, V. Greif h, H. Proske i, K. Granica i, S. Falco j, S. Lozzi j, O. Mora k, A. Arnaud k, F. Novali e, M. Bianchi e a
Department of Earth Sciences, University of Firenze (UNIFI), Via G. La Pira 4, 50121 Firenze, Italy British Geological Survey (BGS) – Natural Environment Research Council (NERC), Environmental Science Centre, Nicker Hill, Keyworth, Nottingham NG12 5GG, United Kingdom c Department of Geoinformatics – Z_GIS, University of Salzburg, 5020 Salzburg, Austria d ENEA – Italian National Agency for New Technologies, Energy and Sustainable Economic Development, Via Martiri di Monte Sole 4, 40139 Bologna, Italy e Tele-Rilevamento Europa - T.R.E. s.r.l., Ripa di Porta Ticinese 79, 20143 Milan, Italy f EURAC - European Academy of Bozen/Bolzano, Viale Druso 1, Bolzano, Italy g HENESIS s.r.l. - Camlin Group, Viale dei Mille 108, 43125 Parma, Italy h Department of Engineering Geology, Comenius University in Bratislava, 84215 Bratislava, Slovak Republic i JOANNEUM Research, Institute of Digital Image Processing, Wastiangasse 6, 8010 Graz, Austria j e-GEOS, Via Cannizzaro 71, 00156 Rome, Italy k Altamira Information, C/Còrsega 381-387, 08037 Barcelona, Spain b
art ic l e i nf o
a b s t r a c t
Article history: Received 16 February 2016 Received in revised form 1 July 2016 Accepted 11 July 2016 Available online 12 July 2016
This paper focuses on the Landslide Thematic services of the EU-funded FP7-SPACE project SAFER (Services and Applications For Emergency Response) for inventory mapping, monitoring and rapid mapping by using Earth Observation (EO). We exploited satellite Interferometric Synthetic Aperture Radar (InSAR) and Object-Based Image Analysis (OBIA), and discuss example applications in South Tyrol and Abruzzo (Italy), Lower Austria (Austria), Lubietova (Slovakia) and the Kaohsiung County (Taiwan). These case studies showcase the significance of radar and optical EO data, InSAR and OBIA methods for landslide mapping and monitoring in different geological environments and during all phases of emergency management: mitigation, preparedness, crisis and recovery. & 2016 The Authors. Published by Elsevier B.V. This is an open access article under the CC BY-NC-ND license (http://creativecommons.org/licenses/by-nc-nd/4.0/).
Keywords: Landslides Remote sensing SAR Interferometry Object-Based Image Analysis SAFER project
1. Introduction Landslides are natural hazards with significant worldwide impact (IGOS, 2004). They typically result from extreme natural events, such as heavy rains, volcanic eruptions, earthquakes, combined with conditioning factors that are often related to human activities, such as deforestation and intensive land exploitation for agricultural purposes (Dai and Lee, 2002; Selby, 1993). The management of natural and man-made disasters can benefit from the exploitation of timely and high quality information derived from space-borne observations, especially in response to emergency situations. Recent European research projects aimed to support the development of products and tools for the improvement of the response time when the crisis occurs, notably n
Corresponding author. E-mail address: silvia.bianchini@unifi.it.(S. Bianchini)
through the provision of mapping capacities, and for the delivery of services before and after crisis operations. Among these projects, SAFER (Services and Applications For Emergency Response) was funded by the European Commission under the 7th Framework Programme (FP7) – SPACE Theme and lasted about 3 years, from January 2009 to March 2012. The main objective of the project was to support disaster management, addressing all types of events such as geophysical risks (landslides, earthquakes and volcanic eruptions), floods, fires, as well as humanitarian crises, for the implementation of the pre-operational Emergency Response Service of the European Global Monitoring for Environment and Security (GMES), now called Copernicus, under the European Earth Observation Programme. SAFER dealt with landslide inventory mapping during preparedness, mitigation and recovery/rehabilitation phases, and with rapid mapping and back-monitoring during the emergency phase by using geo-information derived from up-to-date satellite images of the affected and prone areas combined with recent
http://dx.doi.org/10.1016/j.rsase.2016.07.001 2352-9385/& 2016 The Authors. Published by Elsevier B.V. This is an open access article under the CC BY-NC-ND license (http://creativecommons.org/licenses/by-nc-nd/4.0/).
N. Casagli et al. / Remote Sensing Applications: Society and Environment 4 (2016) 92–108
reference maps. Thus, the whole emergency cycle of natural risk disasters (i.e. mitigation, preparedness, crisis and recovery) was addressed by SAFER services, delivering landslide hazard information and data to a range of end-users in charge of landslide risk assessment and mitigation planning, such as local, regional and national Civil Protection departments, municipalities and county administrations, and environmental agencies. Radar and optical remote sensing data are increasingly used to support landslide risk management due to their multispectral and textural characteristics, high revisiting cycles, wide area coverage and high spatial resolution (e.g. Metternicht et al. (2005) and Singhroy (2002)). Satellite remote sensed data can be effective in support of detailed landslide inventories mapping, especially during prevention and disaster risk reduction phase, as well as during an emergency response phase, when the focus is on the rapid assessment of the extent of events, on the damages caused by the event, and on the current ground motion situation and its evolution. In particular, differential and multi-temporal Synthetic Aperture Radar (SAR) Interferometry can provide ground displacement estimates with millimetre precision obtained from processing of large stacks of radar satellite images. Object-Based Image Analysis (OBIA) of optical satellite images can also support the landslide detection and mapping of past and present mass movements. In this work, we show some example applications in Italy, Austria, Slovakia and Taiwan, for which remote sensing data were exploited for landslide inventory mapping, back-monitoring and rapid mapping.
2. Techniques and methodologies Landslide mapping and monitoring applications in SAFER were carried out through the use of EO radar and optical remote sensing approaches, i.e. Differential and Persistent Scatterer SAR Interferometry (DInSAR and PSI) and Object-Based Image Analysis (OBIA). 2.1. Differential (DInSAR) and Persistent Scatterer (PSI) InSAR Satellite SAR interferometry has recently demonstrated to be highly valuable for estimation of ground deformation. This technique has been particularly useful during prevention phase in mountainous areas and large regions, where conventional in situ surveys such as geomorphological and geophysical methods for a systematic investigation of deformation phenomena are often not cost-effective and practically suitable, due to difficult accessibility and to the huge extension of the areas (Cigna et al., 2010), or during emergency situations (Corsini et al., 2006). DInSAR exploits the phase difference of two SAR images gathered at different times on the same target area. It has widely been used since the late 1980s (Gabriel et al., 1989; Zebker and Goldstein, 1986) to detect, map and quantify surface deformation with sub-centimetric precision over large areas (Costantini et al., 2000; Massonnet and Feigl, 1998, Singhroy et al., 1998). Conventional DInSAR is limited by temporal and geometrical decorrelation, as well as by the impossibility of removing phase distortions introduced by atmospheric effects that can degrade and limit the accuracy of the results. Multi-temporal interferometric techniques overcome these main limitations encountered in single-pair interferograms of the DInSAR approach, since they use long temporal series of SAR data that allow for the removal of atmospheric artefacts or, at least, the reduction of their impact on the estimated displacements (Ferretti et al., 2001). Persistent Scatterer Interferometry (PSI) is a multi-temporal DInSAR technique, which analyzes long temporal stacks of satellite SAR data, and provides annual velocities and time series of ground
93
deformation on dense grids of point-wise targets, the so-called PS, Permanent or Persistent Scatterers (e.g. Ferretti et al. (2001)). Many different techniques have been developed to process multitemporal SAR data stacks. These can be classified into: PSI and Small Baseline Subset (SBAS) processing methods. PSI methods, such as the PSInSAR™ (Ferretti et al., 2001), work by identifying image pixels in a stack of interferograms generated with the same master that persistently backscatter the radar signal over long time intervals (e.g. Kampes (2006), Hooper et al. (2004), Arnaud et al. (2003), Costantini et al. (2000) and Ferretti et al. (2001)). On the other hand, SBAS methods use multi-master SAR image combinations with a short temporal separation and small perpendicular baseline to reduce the effects of spatial and temporal decorrelation. They are particularly useful for processing long series of SAR imagery (e.g. Lanari et al. (2004), Mora et al. (2003), Berardino et al. (2003) and Bateson et al. (2015)). Recently, an evolution of the initial PSInSAR™ technique called SqueeSAR™ technique was developed, by extracting information not only from point-wise deterministic objects (i.e. PS), but also from distributed scatterers (DS) (Ferretti et al., 2011). DS are widespread in rural areas (i.e. pasture, shrubs, bare soils, etc.) and do not produce the same high signal-to-noise ratios of PS, but are, however, characterised by moderate coherence and discernible from the background noise. Thus, SqueeSAR™ technique jointly process PS and DS, making the density of terrain benchmarks higher, especially in semi- and non-urban areas (Ferretti et al., 2011). Post-processing implementations can be performed to increase the affordability of interferometric data for landslide analysis, since they hold some limitations, mainly due to the acquisition geometry of the satellite systems. Thus, PS data derived from different satellite sensors and orbits can be homogenised by computing the measured displacement along the local slope movement and/or to the horizontal planar and the vertical directions according to procedures already tested and applied in literature. In particular, LOS velocities can be re-projected along the local steepest slope, where it is assumed as the most probable direction of movement due to the presence of main translational landslides (e.g. Greif and Vlcko (2012), Cascini et al. (2010), Colesanti and Wasowski (2006)). The downslope projection is based on a scaling factor that depends on the local topography (slope and aspect of the area) and on the satellite acquisition parameters (i.e. track angle and incidence angle) (Cascini et al., 2010). When the two acquisition geometries (i.e. ascending and descending) are available for the same satellite sensor, the LOS velocities obtained from the two orbits can be combined in order to decompose the displacement rate into its horizontal and vertical motion components (e.g. Iannacone et al. (2012); Ciminelli et al., 2009). As a result of these data implementations, the outcoming PS targets are more easily detectable and comparable, going beyond the satellite parameter differences and enabling a more feasible and well-founded interpretation. DInSAR, PSI and SBAS techniques can be combined with field investigations, aerial/satellite imagery interpretation and other auxiliary reference maps (e.g. DTM, LiDAR, thematic maps), and can successfully support conventional ground movement studies (Fig. 1). These methods have been mainly used for mapping and back-monitoring of slow-moving landslide phenomena (sensu Cruden and Varnes (1996)), thanks to their capability to measure surface displacements with millimetre precision. PSI and SBAS time series have also been applied to reconstruct the history of ground deformation of a number of sites and even entire regions, with in field validation, confirming their capabilities to support landslides investigation at a range of spatial scales (e.g. Mantovani et al. (2016), Ciampalini et al. (2015), Del Ventisette et al. (2014), Bianchini et al. (2013, 2016), Greif and Vlcko (2012), Righini et al.
94
N. Casagli et al. / Remote Sensing Applications: Society and Environment 4 (2016) 92–108
Fig. 1. Differential DInSAR and Multi-temporal Interferometry: processing and interpretation.
(2012), Cigna et al. (2011), Meisina et al. (2008), Colesanti and Wasowski (2006)). 2.2. Object-Based Image Analysis (OBIA) The large amount of EO data nowadays available and the recent advances in computing power and machine intelligence allow for complex image analysis. Object-based image analysis is a technique used to analyze digital imagery, which has been developed relatively recently compared to traditional pixel-based image analysis (Burnett and Blaschke, 2003). OBIA is based on information derived from a set of similar pixels called objects or image objects. Unlike single pixels, image objects are designated by a range of properties that can be applied during classification. Thus, OBIA provides a powerful methodological framework for the interpretation of complex classes defined by spectral, textural, spatial, contextual and hierarchical characteristics (Lang, 2008). OBIA is making remarkable progress towards a spatially explicit information extraction workflow as it tries to bridge spatial concepts applied in multi-scale landscape analysis, Geographic Information Science (GIScience) and remote sensing (Blaschke, 2010). Lately, OBIA has been recognised as new and evolving paradigm in the fields of remote sensing and GIScience (Blaschke et al., 2014; Hay and Castilla, 2008). The OBIA approach relies on two interrelated methodological components, i.e. (1) segmentation for scaled representations and (2) rule-based classification for making explicit the required spectral and geometrical properties, as well as spatial relationships for advanced class modelling (Johansen et al., 2010; Lang, 2008; Hay et al., 2005). Image segmentation, which divides an image into homogeneous objects based on colour and shape criteria, is an initial and essential step in OBIA, but not an exclusive or isolated one. The multiresolution segmentation algorithm
(Baatz and Schäpe, 2000), a region-growing technique that merges pixels to objects based on their spectral and spatial homogeneity, can be applied for the creation of initial objects, which can be further refined during class modelling (Tiede et al., 2008). To objectively and (semi-)automatically select suitable scale parameters for the appropriate segmentation of landslide candidates, statistical tools, such as ESP (Estimation of Scale Parameter), can be used for iteratively generating image objects at multiple scales and calculating the local variance of object heterogeneity for each scale (Drǎguţ and Eisank, 2010). Class modelling describes an iterative process of segmentation and classification (Fig. 2), whereby objects can be addressed individually in a region-specific manner (Tiede et al., 2008). In this course, human knowledge is transformed into computer-based rules. By its iterative nature, the process of OBIA is adaptive and open for distinct categories of target classes, from specific application domains and with diverse semantics (Lang, 2008). Furthermore, OBIA supports the usage of geospatial data other than optical images, e.g. the integration of vector data or digital elevation models (DEM) and its derivatives (e.g. slope, curvature, flow accumulation). Especially latter data in combination with optical images proved to be useful for the (semi-)automated object-based approach for landslide detection and classification developed within the SAFER project. The OBIA approach also facilitates the differentiation of landslide types, which is done by using spectral, spatial and morphological characteristics of image objects, whereby particularly the morphological characteristics, e.g. slope and curvature values, are useful for the distinction of landslides from debris flows. For example, low curvature values can be considered an indicator for channelised debris flows. The flow accumulation layer is also used as indication for mass transportation areas (i.e. debris flows), if it coincides with bare ground on the optical satellite image.
N. Casagli et al. / Remote Sensing Applications: Society and Environment 4 (2016) 92–108
95
Fig. 2. Class modelling chain of object-based image analysis (OBIA).
Despite the advantages of OBIA, the visual interpretation of orthophotos or pixel-based classification approaches are still the predominant methods used for mapping landslides. Due to the particular properties of landslides (e.g. shape) and the improved resolution of available imagery, pixel-based classification techniques tend to result in significant commission and omission errors. Furthermore, classification results are revealing 'salt and pepper' effects, which indicate the restricted ability of pixel-based approaches. In the context of landslide research, object-based techniques are to prefer over pixel-based ones as they produce more accurate and realistic results (Moosavi et al., 2014; van Westen et al., 2008; Martin and Franklin, 2005). Individual landslide features are considered as aggregates of pixels and are meaningfully grouped into homogeneous objects, providing information on topological relationships of neighbourhood, embeddedness or shape (Drăguţ and Blaschke, 2006). Several studies have revealed the successful application of OBIA for (semi-)automated landslide detection and classification considering spectral, morphological and contextual properties of landslides (e.g. Heleno et al. (2016), Eisank et al. (2014), Hölbling et al. (2012, 2015), Kurtz et al. (2014), Lahousse et al. (2011), Stumpf and Kerle (2011), Martha et al. (2010) and Barlow et al. (2003, 2006)). OBIA cannot only be applied for the fast detection of landslide affected areas in the aftermath of a triggering event for supporting disaster response efforts, but also for back-monitoring of landslideprone areas and updating of landslide inventory maps. 3. Landslide service types The Landslide Thematic platform of SAFER delivered services aiming at reinforcing the European capacity to respond to
landslide-induced emergencies. The landslide services combined ancillary and thematic maps with radar and optical EO data, for the detection, mapping and back-monitoring of landslide processes at regional or local scale. Three types of landslide services based on the analysis of both radar and optical EO data were identified: the Landslide Inventory Mapping (LIM), the Landslide Monitoring (LM) and the Rapid Landslide Mapping (RLM):
� The LIM is a thematic service carried out over large areas (about
�
�
few thousand square kilometres) affected by several landslide phenomena, reporting the spatial distribution and characteristics of landslides. This service was realized by the integration of remote sensing radar data and conventional geomorphologic photo-interpretation, supported by optical and ancillary data, in order to implement the quantitative and qualitative analyses of slow-moving landslides, by creating a landslide inventory or updating a pre-existing one, if available. The LM is a thematic service carried out to retrieve the past ground movements of a single large landslide affecting built-up areas with a high risk level. It was based on the InSAR backmonitoring by means of the integration of interferometric datasets and auxiliary data (e.g. detailed geological information, information from ground deformation monitoring networks), and on the analysis of optical imagery in order to obtain detailed information about the spatial and temporal distribution of landslide movements. The RLM is a thematic assessment service carried out following an emergency caused by the occurrence of landslides or other hazards that potentially trigger landslide reactivations. The aim was to rapidly map the pre-existing landslides with potential reactivations and new landslides through the analysis of InSAR
96
N. Casagli et al. / Remote Sensing Applications: Society and Environment 4 (2016) 92–108
Fig. 3. Landslide services and case studies overview within SAFER project displayed on Google Earth.
and Very High Resolution (VHR) optical data, in order to define the spatial extension and temporal evolution of landslides for the emergency management strategy. A total of four LIMs, four LMs and one RLM were delivered during the entire life of the project between 2009 and 2012 in Italy, Austria, Slovakia and Taiwan (Fig. 3). Examples of services that have been published in the recent scientific literature include the LIMs in Central and Northern Calabria (Bianchini et al. (2013, 2012); Cigna et al. (2013)) in Italy, and the LMs in Mont-de-la-Saxe in Italy (Hölbling et al., 2012) and Lubietova in Slovakia (Greif and Vlcko, 2012). In this work, five demonstration case studies are presented to explain and discuss
the characteristics of each SAFER Thematic Landslide service: two LIM services in South Tyrol (Italy) and in Lower Austria (Austria), two LM services in Lubietova (Slovakia) and in Kaohsiung County (Taiwan), and one RLM in Abruzzo (Italy) (Table 1). For each case study, different SAR and optical satellite data were exploited, as shown in Table 1: PSI techniques were used in LIM case studies for updating landslide inventory maps, in the LM service in Lubietova to quantify the ground motion rates of the investigated landslides, and in RLM for quick landslide mapping during the emergency in Abruzzo. DInSAR techniques were employed to measure deformation patterns related to specific events, such as the Abruzzo earthquake in RLM service and the typhoon in Taiwan in LM service. The OBIA approach was used for LM in
Table 1 Data summary of case studies. Case study
Landslide service typology
Approach
SAR data
Optical data
Sensor
Date
Sensor IKONOS ALOS SPOT EROS
South Tyrol (Italy)
LIM
PSI and photo- interpretation
ERS ENVISAT RADARSAT
1992–2000 2003–2009 2003–2006
Lower Austria (Austria)
LIM
PSI and photo- interpretation
ERS ENVISAT
1992–2000 2003–2009
Lubietova (Slovakia)
LM
PSI and photo- interpretation
Kaohsiung County (Taiwan)
LM
OBIA and DInSAR
Abruzzo (Italy), after the 6th April 2009 earthquake
RLM
PSI, DInSAR and photointerpretation
ERS 1993–2000 ENVISAT 2002–2009 TerraSAR-X 08/2011–10/ 2011 1992–2000 ERS 2002–2009 ENVISAT RADARSAT 2003–2009
Data
2003-08-07 2007-05-16 2007-06-14 2005-08-05 2010-08-09 IKONOS 2003-08-07 GeoEye-1 2007-05-16 2007-06-14 2005-08-05 – –
SPOT-5
20-03-2011
ALOS 2007-06-16 GeoEye-1 2009-04-07 2009-04-10 2009-04-07
N. Casagli et al. / Remote Sensing Applications: Society and Environment 4 (2016) 92–108
Taiwan, because this case study was suitable for semi-automated object-based landslide detection due to the typology of the involved mass movements, i.e. for differentiating landslides and debris flows. The OBIA method has been applied also for LM in Mont-de-la-Saxe in Italy, but since this study has already been published (Hölbling et al., 2012) it is not described in this paper.
4. Services and results 4.1. LIM in South Tyrol (Italy) The area of interest of this case study is the western part of South Tyrol region (Bolzano province) covering an area of approximately 7500 km2, and located in south-eastern Alps, in North Italy (Fig. 4a). The study area is characterised by a mountainous steep landscape and shows a complex geo-structural setting where magmatic, sedimentary and metamorphic units, belonging to both basement and marine stratigraphic succession, crop out, dating from the Permian to the Cenozoic (Piacentini et al., 2012). The South Tyrol region is affected by different types of gravitational processes. Slow mass
97
movements are mostly characterised by deep-seated gravitational slope deformation (DSGSD). The DSGSDs induce a variety of natural complex phenomena on the surface (Ambrosi and Crosta, 2006; Chigira, 1992) such as ridge depressions, troughs and counter-sloping scarplets, typically associated to lateral spreading and rock flows, or bulging and earth-flows involving soft lithotypes along the slope (Chigira, 1992). Under particular circumstances (e.g. heavy precipitation or earthquakes), the slow slope deformation may also turn into a collapse of a large-scale rock avalanche, catastrophic debris flow or earth-flow (Dramis and Sorriso-Valvo, 1994). The general difficult accessibility of most of the slopes in South Tyrol and the slope instability of the area could benefit from the use of radar interferometry technique, which is highly suitable for the detection of slow-moving landslides and mapping at regional scale. A landslide inventory mapping (LIM) was performed in the study area by means of PSI data, updating the pre-existing landslide database, which included 882 phenomena, and delineating possibly unknown deep-seated landslides (Iannacone et al., 2012; Schneiderbauer et al., 2011). In order to retrieve the LIM over the South Tyrol area, C-band satellite archive data were processed by Tele-Rilevamento Europa,
Fig. 4. (a) Location of LIM case study area in South Tyrol (Austria/Italy) on Google Earth™ support layer; (b) Localizations of the 12 AOIs and LOS velocity distribution of SqueeSAR™ PSI data acquired by ENVISAT in ascending orbit, overlapped on a digital orthophoto with 0.5 m spatial resolution provided by the Autonomous Province of Bolzano (Italy).
98
N. Casagli et al. / Remote Sensing Applications: Society and Environment 4 (2016) 92–108
resulting in about 1,700,000 radar targets from 253 SAR scenes acquired by ERS, ENVISAT and RADARSAT satellites in both ascending and descending geometries, spanning the period from 1992 to 2009 (Table 1). In particular, ERS data were processed through PSInSAR™ algorithm (Ferretti et al., 2001), providing PS, while ENVISAT and RADARSAT data were processed using the SqueeSAR™ algorithm (Ferretti et al., 2011), also producing DS (Distributed Scatterers) with a higher benchmarks density in vegetated areas (Fig. 4b). Due to the wide extension of the area pervasively affected by different slope movements and due to the huge amount of PSI data, 12 AOI (Area Of Interest) sites were preliminary identified, enclosing known deep-seated landslides and highlighted by high ground motion PSI rates (Fig. 4b). The selected AOIs resulted in 927 km2 of which approximately 171 km2 are covered by known active mass movements. The analysis of PSI data velocity field in combination with optical images acquired by different sensors (IKONOS, ALOS, SPOT, EROS) (Table 1), a DEM (Digital Elevation Model at 20 m spatial resolution), land cover and geological maps, and recent orthophotos, allowed the selection of a great number of potential unstable slopes that were not registered in the official landslide inventory. In particular, PSI data allowed identifying a number of not previously mapped landslides in the AOIs, and better investigating activity and spatial extension of the already known DSGSDs. The PSI analysis was supported by field work in the AOIs, leading to the recognition of soil evidences, such as double crests and trenches, ascribed to DSGSDs. The interpolation of ascending and descending velocities was also performed to derive the horizontal and vertical components of the measured movement (e.g. Iannacone et al. (2012) and Ciminelli et al. (2009)), revealing a more accurate zonation of translational and downward vertical movements within the known landslide bodies (Fig. 5). 4.2. LIM in Lower Austria The selected area of this case study is located in Lower Austria, Austria (Fig. 6a). The most northern part of the area is built by the Bohemian Massif composed of crystalline-metamorphic rocks. Southwards, the area encloses the floodplain of the Danube River as well as the Northern Calcareous Alps and its foothills, where carbonate sedimentary rocks (Klippenzone - Helvetic Units), cretaceous flyschoid sediments (Flysch Zone - Penninic Units) and clastic sediments (Molasse Zone) crop out (Tollmann, 1980). Many types of mass movements are present in the study area. In the Northern Calcareous Alps, rapid shallow translational slides and debris flows are frequent phenomena, whereas in the Flysch
Zone rotational and complex slides are the most representative landslide typologies. In the Molasse Zone, slopes are usually affected by downslope creep processes. The official preexisting landslide inventory map of the study area suffered from some major inaccuracies as it appeared incomplete and consisted only in point-like data identifying ground motion phenomena (Fig. 7). In order to perform the ground motion analysis for the LIM service over Lower Austria, C-band SAR data acquired by ERS and ENVISAT satellites in the span time 1992–2009 were processed by ALTAMIRA through the SPN (Stable Point Network) technique (Duro et al., 2005; Arnaud et al., 2003), providing PS in both ascending and descending orbits (Fig. 6b). A LiDAR (Light Detection And Ranging) DTM (Digital Terrain Model) with a spatial resolution of 1 m was also exploited for identifying landslides due to sufficient geomorphological evidences. Moreover, optical VHR images from IKONOS and GeoEye satellites and further auxiliary data such as geological maps and orthophotos were collected. Optical data were only partly useful, as the majority of the VHR images were winter scenes with partial snow cover and long shadows due to the low sun angle (Fig. 6c). PSI data have been strongly supported by visual interpretation of orthophotos and LiDAR DTM maps for the updating of the landslide inventory map of the study area, since more than 60% of landslides were situated in forested regions, so that almost no target points with strong radar reflectance were identified in these densely vegetated zones. In addition, the area is characterised by N-S facing slopes, following the direction of the main tectonic structures. For this reason, it is not suitable for observation through SAR data, due to the intrinsic satellite acquisition configuration. Thus, the PSI analysis was reduced to very few urban areas, whereas high relevance for the identification and characterisation of landslides was offered by the LiDAR DTM, by means of visual interpretation combined with analysis of field-based maps and in situ checks. As a result, a high amount of landslides was deduced from the analysis of the LiDAR DTM and pre-existing point-like data inventory, and afterwards this manual interpretation was verified with additional field surveys. In particular, two specific AOIs were selected for analysis in Lower Austria (Fig. 6a). The first AOI named “Waidhofen/Ybbs”, characterised by steep slopes and forested land coverage, is predominantly situated in the Flysch Zone that is susceptible to complex/rotational landslides (Fig. 7a). The second AOI named “Strengberg”, characterised by very gentle slopes where agriculture is the predominant land use, is situated in Tertiary and Quaternary sediments which show a high susceptibility to slow creeping movements (Fig. 7b). In both AOIs, the number of PS representing unstable conditions was very low because most PS were related to infrastructure and buildings, which are usually situated in more or
Fig. 5. LIM analysis in South Tyrol in the AOI no. 1:(a) LOS velocity distribution of SqueeSAR™ PSI RADARSAT data in descending orbit on AOI 1 on DEM with 20 m resolution provided by the Autonomous Province of Bolzano (Italy); (b) LOS velocity distribution of PS RADARSAT in ascending orbit on AOI 1 on DEM with 20 m resolution provided by the Autonomous Province of Bolzano (Italy); (c) Vertical velocity component after combination of velocities acquired in ascending and descending geometries (Modified from: Iannacone et al. (2012)).
N. Casagli et al. / Remote Sensing Applications: Society and Environment 4 (2016) 92–108
99
Fig. 6. (a) Location of LIM test area in Lower Austria and the two AOIs “Strengberg” (1) and “Waidhofen/Ybbs” on Google Earth™ support layer (2); (b) PS LOS velocity distribution acquired by ENVISAT satellite in descending geometry; (c) VHR optical image acquired by IKONOS sensor (date: 2006-12-26).
Fig. 7. (a) Updated landslide inventory map based on visual interpretation of LiDAR data in the “Waidhofen/Ybbs” AOI, overlaid on LiDAR-derived slope with a spatial resolution of 1 m provided by the Regional Government of Lower Austria: blue dots represent PS considered as being relevant with regard to average velocities for landslide inventory mapping; (b) Landslide Inventory based on visual interpretation of LiDAR data in the “Strengberg” AOI, overlaid on LiDAR-derived slope with a spatial resolution of 1 m provided by the Regional Government of Lower Austria. (For interpretation of the references to color in this figure legend, the reader is referred to the web version of this article).
less stable areas. In the first AOI (“Waidhofen/Ybbs”) very few landslides involve PS with relevant average velocities (Fig. 7a). In the second AOI (“Strengberg”), because of the smoother
morphology and the presence of some scattered farm houses, PS data added more valuable information on ground motion rates and boundaries of landslides in some areas, permitting a more
100
N. Casagli et al. / Remote Sensing Applications: Society and Environment 4 (2016) 92–108
Fig. 8. (a) Location of the LM study area in Lubietova (Slovakia) on Google Earth™ support layer; (b) Geodetic points and their measured displacement rate vectors projected onto the horizontal XY plane, derived from the geodetic monitoring system and overlapped on pre-existing landslide inventory (after Vlcko et al. (2001)) and displayed on Google Earth™ support layer.
comprehensive spatial mapping and definition of the state of activity, where no geomorphological evidence was given, for example for cultivated areas (Fig. 7b). 4.3. LM in Lubietova (Slovakia) This LM case study is a significant landslide area near the Lubietova village in Central Slovakia. This site is located in the narrow valley of the Hutna River on both banks of the river (Fig. 8a and b), between two mountainous ranges, where different geological units crop out. The eastern slopes in the northern part of the territory are mostly composed of clastic Permo-Triassic rocks with steep morphology and V shaped valleys, without presence of slope phenomena. The opposite slopes in the southern part of the territory consist of hard volcano-clastic rocks (andesites, andesite tuffs) overlaying soft and highly weathered Paleogene Flysch shales. This geologic structure is prone to slow creep-like slope deformations such as lateral spreading, triggering downslope movements of huge blocks of volcanic rocks along pre-existing
shear planes in Paleogene shales. Generally, in foreground of slow creep phenomena, landslides with planar or complex shear plane developed, many of them reaching the river in the centre of the village and endangering the inhabitants and their properties (Fig. 9). In spring 1977 after heavy and prolonged precipitation period combined with snow melting, one of the largest landslides in Slovakia occurred in Lubietova village (Vlcko et al., 2001). The affected area, covering about 30 ha, was characterised by three detachment zones merged into an earth flow with the toe partly damming the Hutna River. The landslide, located in the northwestern part of the town (L1 in Fig. 9), is involved since 1993 in National monitoring net of landslides and in two years interval was regularly monitored geodetically since 1988. The monitoring network within the landslide body comprises 30 geodetic points (GP) to detect the post-failure movement of the sliding body (Greif and Vlcko, 2012) (Fig. 8b). The displacement rates for 30 GPs were computed by calculating the slopes of the linear regression lines for different spatial directions separately. In Fig. 8b the projection
N. Casagli et al. / Remote Sensing Applications: Society and Environment 4 (2016) 92–108
101
Fig. 9. (a) Available PSI data from ERS and ENVISAT satellites in descending geometry and landslide inventory map overlapped on a digital orthophoto provided by the Comenius University (Slovakia): the active landslides are highlighted in the three close-up windows (assigned L1, L2, L3): (b) The Lubietova landslide of 1977 named L1; (c) Landslide L2 where the accumulation zone was modified according to the downslope velocity moduli of PS (Modified from: Greif and Vlcko (2012)); (d) Landslide L3, where the accumulation zone was modified according to the downslope velocity moduli of PS (Modified from: Greif and Vlcko (2012)).
of the displacement rates on the XY horizontal plane is shown. The catastrophic landslide of 1977 (L1 in Fig. 9a and b) and surrounding landslides in the Lubietova area (L2 and L3 in Fig. 9) were analysed by means of PSI technique and geodetic monitoring measurements in order to study the post-failure deformations and evaluate recent and past movements of the unstable slopes (Fig. 8b). SAR images were processed by Tele-Rilevamento Europa for providing PS data by means of PSInSAR™ algorithm (Ferretti et al., 2001). In particular, 50 SAR scenes were acquired by ERS satellite and 58 SAR scenes were acquired by ENVISAT satellite, respectively in the spanning years 1993–2000 and 2002–2009. Long-term precise geodetic monitoring of the 1977 landslide revealed differential deformations inside the sliding mass, reaching values of 10 mm/yr in the northern portion and 1–3 mm/yr in the southern parts, but it could not be directly compared with radar data, because temporal decorrelation caused the lack of PS reflectors within the landslide mass. The adjacent landslides (L2 and L3 in Fig. 9) contained the sufficient number of PS, especially in the accumulation zones with gentle slopes, and therefore the radar displacement rates were analysed, mostly corresponding to slow-moving deep seated deformation involving rocky outcrops. PS LOS distributions and velocities from both ERS and ENVISAT sensors are shown in Fig. 9, ranging from � 5 to þ5 mm/yr. PS targets on L2 and L3 accumulation zones turn out to be almost motionless (LOS motion rates o2 mm/yr) (Righini et al., 2012; Colesanti and Wasowski, 2006). Nevertheless, it was possible to trace the boundary between the slowly creeping areas and stable parts of the landslide mass. The downslope projection of LOS velocities on the local steepest slope was also performed, allowing a better identification of the boundaries of the actively moving landslide parts in Lubietova area. In particular, the displacement rates projected into the slope direction in the accumulation zones of landslides L2 and L3 were evaluated (Fig. 9). The PS downslope-projected velocities within the active areas of the L2 landslide ranged from 3 to 5 mm/year, while for the L3 landslide they reached 20 mm/year. However, the
latter higher displacement rates should be approached with caution, since they resulted most likely from the higher scaling factor used in the downslope projection and were based only on ERS and ENVISAT descending orbits data. The data from the ascending ENVISAT acquisitions were discarded, due to the high value of the scaling factor, which causes the angle between the steepest slope and the LOS direction to approach 90°, corresponding to layover condition (Greif and Vlcko, 2012). Even though the PSI technique did not produce any usable targets within the L1 catastrophic landslide of 1977, the measured displacement rates for the L2 and L3 landslides in the immediate vicinity of the L1 landslide were comparable in magnitude to the results obtained by long-term geodetic monitoring recorded within the L1 landslide. Furthermore, it was possible to redraw the boundaries of the L2 and L3 landslides based on the slope direction velocity moduli, indicating different deformation rates within one sliding body (Fig. 9b and c). All results obtained either with precise geodetic monitoring and with satellite interferometry indicate that the landslides located on the western bank of the Hutna River are in continuous slow creep movement, and they require permanent observation, even though the current threat to people and property is not considered to be serious. 4.4. LM in Kaohsiung County (Taiwan) The island of Taiwan was selected as study site for LM as it is regularly affected by severe landslides and debris flows, especially during the typhoon season in summer. A typhoon event and the associated extreme rainfall can trigger hundreds to thousands of mass movements, mainly shallow landslides and partly also deep seated landslides (Lin and Jeng, 2000; Rau et al., 2012). The access to landslide affected areas is often hampered due to the steep and many times inaccessible terrain and impassable roads, which have been destroyed by landslides or debris flows. Three AOI sites in southern-central Taiwan, mainly located in Kaohsiung County, partly in Tainan County and in Chiayi County, with a size between
102
N. Casagli et al. / Remote Sensing Applications: Society and Environment 4 (2016) 92–108
Fig. 10. (a) Location of the LM study area in Kaohsiung County (Taiwan) displayed on Google Earth™ support layer; (b) Location of the three AOIs in central-southern Taiwan overlapped on SPOT 5 VHR optical image (date: 2011-03-20) with 2.5 m spatial resolution. The three close-up windows show details of the three AOIs with semi-automatically mapped landslides and debris flows, as well as main river beds filled with debris and temporary lakes.
30 km2 and 37 km2, were selected for developing the OBIA landslide mapping approach (Fig. 10b). All the three AOIs were heavily affected by landslides after typhoon Morakot hit Taiwan in August 2009. Especially the first area of interest (AOI 1 in Fig. 10b) gained unfortunate notoriety, as the former village Xiaolin was completely buried by a huge landslide during typhoon Morakot. The Xiaolin landslide, which caused 465 casualties (Wu et al., 2014) and severe damages to infrastructure and property, was triggered by extreme rainfall and also fostered by an unstable geological setting (Tsou et al., 2011). A semi-automated object-based landslides and debris flows detection and classification approach was developed using eCognition Developer software (Trimble Geospatial), which offers a modular programming environment for (image-)object handling in a vertical and horizontal hierarchy. The approach was based on the integration of optical satellite data (pan-sharpened SPOT-5 imagery with 2.5 m spatial resolution; acquisition date: 20/03/ 2011) and a DEM with 5 m spatial resolution as well as its
derivatives (slope, aspect, curvature, flow accumulation). The selection of appropriate parameters for the creation of image objects through multiresolution segmentation algorithm was supported by the ESP tool (Drǎguţ and Eisank, 2010). Next, landslide-affected areas were identified using mainly spectral characteristics of image objects. As the presence of bare ground was one major indicator for the appearance of mass movements, especially the NDVI (Normalised Difference Vegetation Index) proved to be useful for the differentiation of target areas (landslides, debris flows, main river beds filled with debris, temporary lakes) from areas of no interest (e.g. vegetated areas) (Hölbling et al., 2015; Behling et al., 2014). During classification, the use of absolute spectral threshold values was kept to a minimum, whereas relational features (e.g. NDVI or relative differences in terrain) and spatial and contextual characteristics were preferably used. Classification thresholds were mainly determined through visual inspection of feature values, and considering the feedback on intermediate results from local experts.
N. Casagli et al. / Remote Sensing Applications: Society and Environment 4 (2016) 92–108
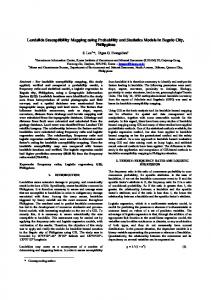
Mainly slope values were used for the distinction of landslides from debris flows. Image objects with a mean slope above 25° were allocated to the class ‘landslide’; those with a lower value were classified as ‘debris flow’. This slope threshold is in line with values reported by Taiwanese landslide experts (Eisank et al., 2014). Besides, visual inspection and comparison of slope values revealed that the debris flow channels generally did not exceed 25 degrees. Next to slope, also curvature and flow accumulation were used for the differentiation of these two mass movement types. However, the available DEM was not fully sufficient for determining unique thresholds as it was created before major landslides and debris flows occurred in the study areas. Therefore, the derivatives of the DEM were mainly used in combination with shape characteristics (e.g. ratio between length and width) or the brightness of objects (debris flows tended to appear brighter on the SPOT-5 image) to facilitate the stepwise refinement of the classification. Finally, the delineation of classes was further enhanced by applying split and merge functions as well as smoothing of image-object boundaries using pixel-based resizing algorithms. The approach was developed for AOI 1 and then transferred to two other nearby AOIs of about the same size. Thereby only minor adaptations in the ruleset were needed. Besides landslides and debris flows, the landslide mapping result also shows large river beds filled with debris (i.e. areas where the material is deposited) and temporary lakes, which emerged as a result of debris accumulation that dammed the river. Latter two classes were mapped because they are closely related to the appearance of landslides and debris flows. The results of the semi-automated object-based landslide detection and classification on the three AOI are shown in Fig. 10. Table 2 shows the areas affected by mass movements (in km2 and %) per study site. About one fifth to more than one fourth of each study area is directly or indirectly affected by mass movements, whereby landslides make up the largest part. In addition to the object-based landslide mapping in centralsouthern Taiwan, classical DInSAR back-monitoring of landslides has been conducted using Spotlight TerraSAR-X images elaborated by ALTAMIRA. An example of a differential interferogram (09/08/2011–20/08/ 2011) for study area 1 is presented in Fig. 11. It has to be noted that noisy areas are present due to temporal decorrelation, while for the coherent areas phase measurements could be performed. Fig. 11 highlights two subareas, where deformation patterns have Table 2 Areas of different detected classes, directly or indirectly affected by mass movements (in km2 and %) within each AOI. Study area – km2
in km2
% of total area
Landslide Debris flow River bed filled with debris Temporary water body Total
502 183 150 na 835
165 60 49 na 274
Landslide Debris flow River bed filled with debris Temporary water body Total
358 106 097 031 592
104 31 28 09 172
Landslide Debris flow River bed filled with debris Temporary water body Total
591 244 165 022 1022
161 67 45 06 279
Class
AOI 1: 305 km2
AOI 2: 345 km2
AOI 3: 366 km2
103
been detected using DInSAR. The temporal evolution of landslide phenomena was observed by counting the different interferometric phase fringes. For the first subarea, showing the upper part of the Xiaolin landslide, each colour cycle corresponds to a deformation gradient of 15 mm, being half wavelength of the employed satellite (images are acquired in X-band which is 3 cm wavelength), and at least two fringes can be detected. For the second sub-area, which depicts a part of the main river bed where significant debris accumulation and transportation occur, deformation intensity resulted to be lower than in subarea one, since less than one phase fringe is detected in the interferogram. 4.5. RLM in Abruzzo (Italy) after the 6th April 2009 earthquake The RLM service focused on the Abruzzo region (Central Italy) (Fig. 12a), where the area around L'Aquila city was affected by a main earthquake shock on 6th April 2009 rated 5.8 on the Richter scale and 6.3 on the moment magnitude scale, forerun by several thousand foreshocks from December 2008 on and followed by several aftershocks till July 2009. Earthquakes shaking can trigger landslides at many scales, since it can cause ground instability by imposing inertial loading or by causing a loss of strength in the slope material (Gerolymos, 2010). Therefore, the RLM aimed at mapping the landslide-prone areas in the Abruzzo region, for defining landslide hazard and potential reactivations caused by the seismic event. The area of interest was chosen just after the earthquake and extended up about 460 km2 around L'Aquila according to the highest probability of reactivations of landslides that depends on the local geological conditions, on the epicentre location and on other seismic parameters (Keefer, 1984). In the area, the landslide inventory updating was carried out by means of optical data and PSI interpretation, while the co-seismic analysis was done through DInSAR technique. In particular, the pre-existing landslide inventory map referred to 2003 was provided by the Hydrogeological Setting Plan (PAI: Piano di Assetto Idrogeologico) and it was updated through the integration of optical image interpretation and the radar-interpretation procedure as defined by Farina et al. (2008), supported by additional reference data (DEM, topography, geological map). Regarding the optical data interpretation, satellite images taken by ALOS before and after the earthquake (on 16th June 2007 and on 7th and 10th April 2009, respectively) and by GeoEye-1 immediately after the event (on 7th April 2009) were analysed to map the distribution of landslides in the affected areas. The ALOS images were acquired in visible and near infra-red spectral bands with 10 m resolution, however, the spatial resolution was insufficient to map small rock falls occurring within densely vegetated areas. Actually, only large landslides about some kilometres wide and long could be detected with ALOS optical data (Chigira, 2009). On the other hand, the GeoEye-1 satellite image at 0.5 m spatial resolution permitted to map the most severe aftershocks triggered landslides, mainly rock falls and minor rock slides. Regarding the PSI data interpretation, the radar datasets were collected in order to provide estimates of the mean yearly velocity referred to distinct time intervals: historic ERS (April 1992–December 2000) and recent ENVISAT (November 2002–March 2009) and RADARSAT (March 2003–March 2009). The ERS and RADARSAT images were processed by Tele-Rilevamento Europa using PSInSAR™ technique, while the ENVISAT images were processed by e-GEOS using PSP-DIFSAR technique (Fig. 12b). PSI data permitted to provide the deformation scenario up to just before the earthquake event (March 2009). The pre-existing landslide inventory was complemented by the identification of new landslides, modification of landslide boundaries through radar-interpretation and the assessment of the state of activity, intended as
104
N. Casagli et al. / Remote Sensing Applications: Society and Environment 4 (2016) 92–108
Fig. 11. (a) Differential interferogram of Spotlight TerraSAR-X images (09/08/2011–20/08/2011) processed by ALTAMIRA on the study area (1) (see Fig. 10) using classical DInSAR. Deformation patterns detected on two subareas are shown in (b) and (c) close-up windows.
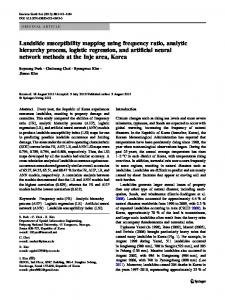
defined by Cruden and Varnes (1996) (Fig. 12c). The analysis of PSI data finally allowed mapping 57 new landslides and gave information on 203 (39%) landslides of the pre-existing PAI inventory, while EO data did not give any additional information on 319 landslides of the PAI (Table 3). Thus, the updated landslide inventory map includes 579 landslides totally. Considering the 203 updated landslides, the modifications concerned 155 phenomena while 48 were confirmed: the modifications were related to the boundary, the typology, and/or the state of activity referred to the satellite observation period (Table 3). All the newly-added landslides were considered active. It is worth noting that almost all the landslides where the state of activity was changed from dormant (or stabilized) to active involve urban areas and the road network where the reliability of radar benchmarks is higher. Radar satellite data were particularly useful to map slow superficial movements referred to as “creeps” that are widespread in the slopes around L'Aquila: the typical velocity is a few centimetres per year which is perfectly suited to the capability of multi-interferometric techniques for ground deformation detection. Finally, ENVISAT images, dated 1st February 2009 and 12th April 2009 in descending orbit and images of 11th March 2009 and 15th April 2009 in ascending orbit, were processed by ALTAMIRA for producing a co-seismic interferogram with millimetre measurements of ground deformation caused by the earthquake in L'Aquila, in order to identify zones that were prone to landslide reactivation. Within the interferogram stacking, each fringe of the interferogram corresponds to a complete cycle of colours and is associated to about 28 mm of earth surface displacement (half wavelength in C-band) in the satellite LOS: a minimum of 9 fringes could be counted, equivalent to a minimum displacement of about 25 cm. The area associated corresponds approximately to 47.5 � 35 km (Fig. 13). The availability of both ascending and descending geometries allows determining the different components of the deformation vector: the areas affected by similar deformation fringes, such as the main movement area in Fig. 13 near L'Aquila city, have a predominant vertical movement, whereas those zones with different patterns, such as the secondary lobe in the descending orbit, which does not appear in the ascending case, present a higher planimetric component, depending on which signal is stronger (descending or ascending).
5. Discussion and conclusions This paper shows some relevant results of the EU FP7 project SAFER within its landslide thematic platform, whose end-users were Civil Protection authorities and local municipalities in charge of landslide risk prevision and mitigation planning. The landslide services were successfully developed during all phases of emergency management (i.e. mitigation, prevention, crisis and response) and concerned landslide inventory mapping, back-monitoring and rapid mapping in different case studies in Italy, Austria, Slovakia and Taiwan throughout the exploitation of EO satellite radar and optical data. These outcomes aimed at reinforcing the European capacity to respond to emergency situations resulting from landslides triggered by different mechanisms and in different geomorphological environments. EO satellite radar and optical data were processed and analysed within the SAFER project to establish (pre-)operational services for supporting the study, interpretation and back-monitoring of landslide phenomena. In particular, DInSAR and PSI and OBIA for ground motion detection and landslide mapping were exploited and main results were shown in this work. The key added value of the developed activities is represented by their service utility. The LM, LIM and RLM services produced valuable outcomes for mapping and back-monitoring landslides in order to deploy civil protection resources and implement medium to long term precautionary measures in prevention, emergency and post-crisis mitigation phases. Landslide services coupled the advances of EO data analyses with the consolidated knowledge of ground networks and in situ measurements that can provide suitable ground truth information. Moreover, they were designed to address requirements and specific needs of local and regional users, and their development was conducted in close interaction with end-users, who also provided detailed feedback and recommendations. The performed services were compatible with existing services already implemented within the user institutions. Thus, the methods and results were delivered in various layouts (i.e. online services, maps, vector and raster data) to the end-users, who exploited them within their Official Services and in combination with thematic archive data. In particular, the delivered products were successfully used by the end-users in order to
N. Casagli et al. / Remote Sensing Applications: Society and Environment 4 (2016) 92–108
105
Fig. 12. (a) Location of the RLM case study on L'Aquila, Abruzzo Region (Italy) on Google Earth™ support layer; (b) PS LOS velocity distribution of ENVISAT satellite over the study area overlapped on digital orthophotos from Volo Italia 2000 with 1 m resolution; (c) Updated landslide inventory map.
better characterize and update the environmental setting and the landslide hazard on their areas of interest, in the framework of risk mitigation strategies and local Civil protection purposes. Space-borne SAR differential and multi-temporal interferometry were used for detection and back-monitoring of slowmoving surface displacements, thanks to their precision (up to 1 mm), capability to provide rapid and easily updatable ground velocity estimates over large areas, high spatial resolution (up to 1 m) and non-invasiveness. The potential of such remote sensing techniques is particularly relevant for wide regions, where conventional in situ surveys for slope instability analysis are not always cost-effectively practicable due to the huge extensions and eventual inaccessibility of such
areas. This is the case of LIM in South Tyrol with a number of known landslides distributed over a large area and limited accessibility of most of the slopes. Here, the mapping activities benefited particularly from the use of PSI data that allowed for updating the pre-existing landslide database and for delineating other previously unknown deep-seated landslides. Given the availability of both ascending and descending satellite geometries and the type of landslides (i.e. deep-seated landslides), a vertical and horizontal PSI velocity decomposition was performed to better detect the zonation and morphodynamics of the investigated phenomena. PSI may generally be adequate for landslide detection, but slope geometry and land use/land cover can considerably limit its
106
N. Casagli et al. / Remote Sensing Applications: Society and Environment 4 (2016) 92–108
Table 3 Summary of main modifications in updated and new landslides detected from EO data analysis. Landslide Inventory
Updating
Pre-existing Inventory Updated landslides Not classified landslides Updated Inventory New landslides Updated landslides Confirmed Modified (activity, boundary, typology) Active Reactivated Dormant Stabilized Not classified
No. landslides
%
203
39% of PAI
319
61% of PAI
Total 522
100% of PAI
57 203
10% of Updated Inventory 35% of Updated Inventory
48 155
8% of Updated Inventory 27% of Updated Inventory
125
48% of updatedþ new landslides 15 6% of updatedþ new landslides 50 19% of updatedþnew landslides 70 27% of updatedþnew landslides 319 55% of Updated Inventory Total 579 100%
application. In the Lower Austria study area, the geomorphological situation is characterised by steep slopes, many of them facing to the north or to the south, and especially the dense vegetation coverage creates a situation that is most unfavourable for the application of the PSI approach. Thus, due to this specific environment resulting in a low number of suitable PS data, a classical approach was applied in Lower Austria for the LIM, based on interpretation of LiDAR data. InSAR interferometry was also effective for back-monitoring single landslide phenomena, as for LM in Lubietova, where PS data were compared with geodetic monitoring measurements and used to evaluate post-failure deformations, as well as recent and past movements of the unstable slopes. The downslope projection of PSI rates was also performed on this site, given the main translational and flow types of the landslide phenomena of the area. In the Kaohsiung County study area, the LM service was carried out using OBIA and classical DInSAR methods. OBIA demonstrated to be useful in landslide mapping since it takes into account
spectral, spatial, morphological and contextual characteristics of image objects. This is especially valuable when integrating VHR images and DEM data for semi-automated analysis. Such advanced image analysis methods can complement traditional cost- and time-intensive visual interpretation or field surveys. The developed OBIA approach is not only applicable for LM, but can also be applied for rapid mapping of landslide events when focusing simply on the detection and delineation of new landslides, rather than mapping different types of mass movements. Nonetheless, there is more research needed for further increasing the transferability and automation of OBIA methods to different environmental settings and data. PSI and optical data can be exploited for mapping slow-moving landslides at regional scale through the analysis of pre- and postevent ground displacements. This is the case of RLM in Abruzzo region (Italy), where satellite SAR and optical images were collected after the main seismic shock that affected the area on 6th of April 2009, in order to carry out a slope instability mapping according to the requirements of the national Italian Department of Civil Protection. Overall, it is worth highlighting that the outcomes of interferometric analysis and processing of VHR images highly depend on the availability of data. In particular, for PSI data the availability of both ascending and descending geometries is necessary for deriving the horizontal East-West and vertical components of the movements, as done in the South Tyrol study area. For the optical images, the acquisition time is crucial, since, for instance, the presence of widespread snowfall and snow cover makes the images not useful for landslide detection. In the Lower Austria study area, the analysis of IKONOS images was hampered due to the winter acquisition time, that entail areas of shadows due to the low sun angle and the occurrence of snow covered areas, especially in the mountainous areas. Furthermore, in case of RLM the fast provision of data is crucial. Especially the availability of optical data can be limited due to cloud cover over longer periods, for example after typhoon events in Taiwan. In such cases, radar data might be complementary used as data source. These previous considerations point out that the development of one automatic and unique procedure for landslide mapping and monitoring is not feasible. Because of issues concerning geomorphological, geological and geographical settings, data availability, acquisition times and satellite acquisition constrains, each case study has to be individually examined, in order to define the significance and usability of EO satellite radar and optical data for landslide inventory mapping and assessment case by case.
Fig. 13. Differential interferogram and deformation patterns detected using classical DInSAR: (a) Co-seismic Interferogram with ENVISAT images (01/02/2009–12/04/2009) in descending orbit elaborated by ALTAMIRA; (b) Co-seismic Interferogram with ENVISAT images (11/03/2009–15/04/2009) in ascending orbit elaborated by ALTAMIRA. (For interpretation of the references to color in this figure, the reader is referred to the web version of this article).
N. Casagli et al. / Remote Sensing Applications: Society and Environment 4 (2016) 92–108
In the future, the increasing availability of EO data offered by the new generation of SAR and optical sensors (e.g. Sentinel-1 in C-band and Sentinel-2) surely will enhance the possibility to cover wider areas, permitting to preliminarily manage geometrical issues, and to obtain more updated data with improved spatial and temporal resolutions. Further, integrated analysis of radar and optical data should be intensively followed to fully exploit the potential of EO data from different sensors for landslide mapping and back-monitoring purposes, and thus, aiming to provide reliable information for supporting disaster management.
Acknowledgements This work was carried out within the project SAFER (Services and Applications For Emergency Response), funded by the European Commission within the 7th Framework Programme – SPACE Theme under the Global Monitoring for Environment and Security (EC GMES FP7) initiative, with Grant agreement no. 218802. F. Cigna publishes with the permission of the Executive Director of BGS-NERC. On South Tyrol (Italy) area, ERS, ENVISAT and RADARSAT radar data were received under the GSCDA (GMES Space Component Data Access) DAP (Data Access Portfolio) MG (Mission Group)1_18 and_19: High & Very High resolution SAR imaging missions from and processed by Tele-Rilevamento Europa-T.R.E.; optical VHR data from IKONOS, ALOS, SPOT, EROS sensors were delivered under the DAP_MG2b_14 (High & Very High Resolution multi-spectral imaging missions); orthophotos and DEM were provided by the Autonomous Province of Bolzano (Italy). On Lower Austria (Austria) area, ERS and ENVISAT radar data were supplied from GSCDA DAP_MG1_19 and processed by ALTAMIRA Information; optical VHR images from IKONOS and GeoEye-1 sensors were delivered under the DAP_MG2b_14; orthophotos and LiDAR-DTM were provided by the Regional Government of Lower Austria (Austria). On Lubietova (Slovakia) area, ERS and ENVISAT radar data were supplied according to the GSCDA DAP_MG1_19 and processed by Tele-Rilevamento Europa-T.R.E.; orthophotos, DEM and topographic maps were provided by the Comenius University (Slovakia). On Kaohsiung County (Taiwan) area, TerraSAR-X radar data were delivered under the GMES DWH (Data WareHouse) MG1_SAFE (Standard Archive Format for Europe)_ADD_016b and processed by ALTAMIRA; optical data from SPOT-5 sensor were delivered under the DAP DWH_MG2b_SAFE_ADD_011b; DEM was provided by the Disaster Prevention Research Center of the National Cheng Kung University (Taiwan). On Abruzzo (Italy) area, ERS, ENVISAT radar data were supplied under the GSCDA DAP_MG1_19, while RADARSAT data were collected in the framework of Italian national project carried out by UNIFI (Italy) and financed by the Italian National Department of Civil Protection; ERS and RADARSAT images were processed by Tele-Rilevamento Europa; ENVISAT images were processed by e-GEOS and by ALTAMIRA; ALOS optical images were downloaded from the ESA website, while the GeoEye-1 satellite image was available in Google Earth free visualisation system; orthophotos and topographic maps were available through the cartographic web site of the Italian Ministry of the Environment (http://www.pcn.min ambiente.it/PCN/).
References Ambrosi, C., Crosta, G.B., 2006. Large sackung along major tectonic features in the Central Italian Alps. Eng. Geol. 83, 183–200. Arnaud A., Adam N., Hanssen R., Inglada J., Duro J., Closa J., Eineder M., 2003. ASAR ERS interferometric phase continuity. In: Proceedings of the 23rd IEEE
107
International Geoscience and Remote Sensing Symposium (IGARSS), Toulouse, France, July 21–25, 2003. Baatz, M., Schäpe, A., 2000. Multiresolution segmentation-an optimization approach for high quality multi-scale image segmentation. In: Strobl, J., Blaschke, T., Griesebner, G. (Eds.), Angewandte Geographische Informationsverarbeitung XII. Wichmann, Heidelberg, pp. 12–23. Barlow, J., Martin, Y., Franklin, S.E., 2003. Detecting translational landslide scars using segmentation of Landsat ETM þ and DEM data in the northern Cascade Mountains, British Columbia. Can. J. Remote Sens. 29, 510–517. Barlow, J., Franklin, S., Martin, Y., 2006. High spatial resolution satellite imagery, DEM derivatives, and image segmentation for the detection of mass wasting processes. Photogramm. Eng. Remote Sens. 72, 687–692. Bateson, L., Cigna, F., Boon, D., Sowter, A., 2015. The application of the Intermittent SBAS (ISBAS) InSAR method to the South Wales Coalfield, UK. Int. J. Appl. Earth Obs. Geoinf. 34, 249–257. Behling, R., Roessner, S., Kaufmann, H., Kleinschmit, B., 2014. Automated spatiotemporal landslide mapping over large areas using rapideye time series data. Remote Sens. 6, 8026–8055. http://dx.doi.org/10.3390/rs6098026. Berardino, P., Costantini, M., Franceschetti, G., Iodice, A., Pietranera, L., Rizzo, V., 2003. Use of differential SAR interferometry in monitoring and modelling large slope instability at Maratea (Basilicata, Italy). Eng. Geol. 68, 31–51. Bianchini, S., Cigna, F., Righini, G., Proietti, C., Casagli, N., 2012. Landslide hotspot mapping by means of persistent scatterer interferometry. Environ. Earth Sci. 67 (4), 1155–1172, 10.1007/s12665-012-1559-5. Bianchini, S., Cigna, F., Del Ventisette, C., Moretti, S., Casagli, N., 2013. Monitoring landslide-induced displacements with TerraSAR-X Persistent Scatterer Interferometry (PSI): Gimigliano Case Study in Calabria Region (Italy). Int. J. Geosci. 4 (10). http://dx.doi.org/10.4236/ijg.2013.410144. Bianchini, S., Raspini, F., Ciampalini, A., Lagomarsino, D., Bianchi, M., Bellotti, F., Casagli, N., 2016. Mapping landslide phenomena in landlocked developing countries by means of satellite remote sensing data: the case of Dilijan (Armenia) area. Geomatics, Nat. Hazards Risk . http://dx.doi.org/10.1080/ 19475705.2016.1189459. Blaschke, T., 2010. Object based image analysis for remote sensing. ISPRS J. Photogramm. 65, 2–16. Blaschke, T., Hay, G.J., Kelly, M., Lang, S., Hofmann, P., Addink, E., Feitosa, R.Q., Van der Mer, F., Van der Werff, H., Van Coillie, F., Tiede, D., 2014. Geographic objectbased image analysis – towards a new paradigm. ISPRS J. Photogramm. Remote Sens. 87, 180–191. Burnett, C., Blaschke, T., 2003. A multi-scale segmentation/object relationship modeling methodology for landscape analysis. Ecol. Model. 168, 233–249. Cascini, L., Fornaro, G., Peduto, D., 2010. Advanced low- and full- resolution DInSAR map generation for slow-moving landslide analysis at different scales. Eng. Geol. 112 (1–4), 29–42. Chigira, M., 1992. Long-term gravitational deformation of rocks by mass rock creep. Eng. Geol. 32, 157–184. Chigira, M., 2009. September 2005 rain induced catastrophic rockslides on slopes affected by deep-seated gravitational deformations, Kyushu, southern Japan. Eng. Geol. 108, 1–15. Ciampalini, A., Raspini, F., Frodella, W., Bardi, F., Bianchini, S., Moretti, S., 2015. The effectiveness of high-resolution LiDAR data combined with PSInSAR data in landslide study. Landslides, 1–12. http://dx.doi.org/10.1007/ s10346-015-0663-5. Cigna F., Bianchini S., Righini G., Proietti C., Casagli N., 2010. Updating landslide inventory maps in mountain areas by means of Persistent Scatterer Interferometry (PSI) and photo-interpretation: Central Calabria (Italy) case study. In: Bringing Science to Society, Malet J.P., Glade T., Casagli N. (Eds), Proceedings of the International Conference Mountain Risks, Florence, Italy, November 24–26, pp 3–9. Cigna, F., Del Ventisette, C., Liguori, V., Casagli, N., 2011. Advanced radar-interpretation of InSAR time series for mapping and characterization of geological processes. Nat. Hazards Earth Syst. Sci. 11, 865–881. http://dx.doi.org/10.5194/ nhess-11-865. Cigna, F., Bianchini, S., Casagli, N., 2013. How to assess landslide activity and intensity with Persistent Scatterer Interferometry (PSI): the PSI-based matrix approach. Landslides 10 (3), 267–283, 10.1007/s10346-012-0335-7. Ciminelli M.G., Casagli N., Proietti C., Righini G., Cigna F, Pancioli V., Colombo A., Poggi F., Cantone P., Galluccio F., Colombo D, Ferretti A., Minati F., Ciccodemarco S., Rutigliano S., Costabile S., 2009. Linee guida per l'analisi di dati interferometrici satellitari in aree soggette a dissesti idrogeologici, Ministero dell'Ambiente. 〈www.pcn.minambiente.it/GN/〉. Colesanti, C., Wasowski, J., 2006. Investigating landslides with spaceborne Synthetic Aperture Radar (SAR) interferometry. Eng. Geol. 88, 173–199. Corsini, A., Farina, P., Antonello, G., Barbieri, M., Casagli, N., Coren, F., Guerri, L., Ronchetti, F., Sterzai, P., Tarchi, D., 2006. Space‐borne and ground‐based SAR interferometry as tools for landslide hazard management in civil protection. Int. J. Remote Sens. 27 (12), 2351–2369. Costantini M., Iodice A., Magnapane L., Pietranera L., 2000. Monitoring terrain movements by means of sparse SAR differential interferometric measurements. In: Proceedings of the 20th IEEE International Geoscience and Remote Sensing Symposium (IGARSS), Honolulu, Hawaii, USA, 24–28 July 2000, pp. 3225–3227. Cruden D.M., Varnes D.J., 1996. Landslide types and processes. In: Turner A.K., Schuster R.L. (Eds.), Landslides: Investigation and Mitigation, Sp. Rep. 247, Transportation Research Board, National Research Council, National Academy Press, Washington DC, pp 36–75.
108
N. Casagli et al. / Remote Sensing Applications: Society and Environment 4 (2016) 92–108
Dai, F.C., Lee, C.F., 2002. Landslide characteristics and slope instability modeling using GIS, Lantau Island, Hong Kong. Geomorphology 42, 213–228. Del Ventisette, C., Righini, G., Moretti, S., Casagli, N., 2014. Multitemporal landslides inventory map updating using spaceborne SAR analysis. Int. J. Appl. Earth Obs. Geoinf. 30 (1), 238–246. Drǎgut, L., Blaschke, T., 2006. Automated classification of landform elements using object-based image analysis. Geomorphology 81, 330–344. Drǎgut, L., Eisank, C., 2010. ESP: a tool to estimate scale parameters for multiresolution image segmentation of remotely sensed data. Int. J. Geogr. Inf. Sci. 24 (6), 859–871. http://dx.doi.org/10.1080/13658810903174803. Dramis, F., Sorriso-Valvo, M., 1994. Deep seated slope deformations, related landslides and tectonics. Eng. Geol. 38, 231–243. Duro J., Closa J., Biescas E., Crosetto M., Arnaud A., 2005. High resolution differential interferometry using time series of ERS and ENVISAT SAR data. In: Proceedings of the 6th Geomatic Week Conference, Barcelona, Spain, February 8–11, 2005, unpaginated CD-ROM. Eisank C., Hölbling D., Friedl B., Chen Y.-C., Chang K.-T., 2014. Expert knowledge for object-based landslide mapping in Taiwan. South-Eastern European Journal of Earth Observation and Geomatics, Special Thematic Issue: GEOBIA 2014, Αdvancements, trends and challenges, 5th Geographic Object-Based Image Analysis Conference, Thessaloniki, Greece, May 21–24, 2014. pp 347–350. Farina P., Casagli N., Ferretti A., 2008. Radar-interpretation of InSAR measurements for landslide investigations in civil protection practices. In: Proceedings of 1st North American Landslide Confeence, Vail, Colorado, pp 272–283. Ferretti, A., Prati, C., Rocca, F., 2001. Permanent scatterers in SAR interferometry. IEEE Trans. Geosci. Remote Sens. 39 (1), 8–20. Ferretti, A., Fumagalli, A., Novali, F., Prati, C., Rocca, F., Rucci, A., 2011. A new algorithm for processing interferometric data-stacks: SqueeSAR™. IEEE Trans. Geosci. Remote Sens. 99, 1–11. Gabriel, A.K., Goldstein, R.M., Zebker, H.A., 1989. Mapping small elevation changes over large areas: differential radar interferometry. J. Geophys. Res. 94, 9183–9191. Gerolymos, N., 2010. Numerical modeling of seismic triggering, evolution and deposition of rapid landslides: application to Higashi-Takezawa (2004). Int. J. Numer. Anal. Methods Geomech. 34 (4), 383–407. Greif, V., Vlcko, J., 2012. Monitoring of post-failure landslide deformation by the PSInSAR technique at Lubietova in Central Slovakia. Environ. Earth Sci. 66, 1585–1595. http://dx.doi.org/10.1007/s12665-011-0951-x. Hay, G.J., Castilla, G., 2008. Object-based image analysis—spatial concepts for knowledge-driven remote sensing applications. In: Blaschke, T., Lang, S., Hay, G. J. (Eds.), Geographic Object-Based Image Analysis (GEOBIA). Springer-Verlag, Berlin, pp. 77–92. Hay, G.J., Castilla, G., Wulder, M.A., Ruiz, J.R., 2005. An automated object-based approach for the multiscale image segmentation of forest scenes. Int. J. Appl. Earth Obs. Geoinf. 7, 339–359. Heleno, S., Matias, M., Pina, P., Sousa, A.J., 2016. Semiautomated object-based classification of rain-induced landslides with VHR multispectral images on Madeira Island. Nat. Hazards Earth Syst. Sci. 16, 1035–1048. http://dx.doi.org/ 10.5194/nhess-16-1035–2016. Hölbling, D., Füreder, P., Antolini, A., Cigna, F., Casagli, N., Lang, S., 2012. A semiautomated object-based approach for landslide detection validated by persistent scatterer interferometry measures and landslide inventories. Remote Sens. 4, 1310–1336. http://dx.doi.org/10.3390/rs4051310. Hölbling, D., Friedl, B., Eisank, C., 2015. An object-based approach for semi-automated landslide change detection and attribution of changes to landslide classes in northern Taiwan. Earth Sci. Inform. 8, 327–335. Hooper, A., Zebker, H.A., Segall, P., Kampes, B., 2004. A new method for measuring deformation on volcanoes and other natural terrains using InSAR persistent scatterers. Geophys. Res. Lett. 31. http://dx.doi.org/10.1029/2004GL021737. Iannacone J.P., Iasio C., Ronchetti F., Schneiderbauer S., Corsini A., 2012. Analysis of morpho-dynamics of South Tyrol, using filtered Permanent Scatterer. EGU General Assembly, April 22–27, 2012, Vienna, Austria. IGOS, 2004. Geohazards Theme Report: For the Monitoring of our Environment from Space and from Earth. European Space Agency Publication, Rome (Italy), p. 55. Johansen, K., Arroyo, L.A., Phinn, S., Witte, C., 2010. Comparison of geo-object based and pixel-based change detection of riparian environments using high spatial resolution multi-spectral imagery. Photogramm. Eng. Remote Sens. 76, 123–136. Kampes, B.M., 2006. Radar Interferometry: Persistent Scatterer Technique. Springer, The Netherlands. Keefer, D.K., 1984. Landslides caused by earthquake. Geol. Soc. Am. Bull. 95 (4), 406–421. Kurtz, C., Stumpf, A., Malet, J.P., Gançarski, P., Puissant, A., Passat, N., 2014. Hierarchical extraction of landslides from multiresolution remotely sensed optical images. ISPRS J. Photogramm. Remote Sens. 87, 122–136. Lahousse, T., Chang, K.T., Lin, Y.H., 2011. Landslide mapping with multi-scale objectbased image analysis a case study in the Baichi watershed, Taiwan. Nat. Hazards Earth Syst. Sci. 11, 2715–2726.
Lanari, R., Mora, O., Manunta, M., Mallorquì, J.J., Berardino, P., Sansosti, E., 2004. A small baseline approach for investigating deformation on full resolution differential SAR interferograms. IEEE Trans. Geosci. Remote Sens. 42, 1377–1386. Lang, S., 2008. Object-based image analysis for remote sensing applications: modeling reality—dealing with complexity. In: Blaschke, T., Lang, S., Hay, G.J. (Eds.), Object-Based Image Analysis: Spatial Concepts for Knowledge-Driven Remote Sensing Applications. Springer, Berlin, Germany, pp. 3–28. Lin, M.L., Jeng, F.S., 2000. Characteristics of hazards induced by extremely heavy rainfall in Central Taiwan – Typhoon herb. Eng. Geol. 58, 191–207. Mantovani, M., Devoto, S., Piacentini, D., Prampolini, M., Soldati, M., Pasuto, A., 2016. Advanced SAR interferometric analysis to support geomorphological interpretation of slow-moving coastal landslides (Malta, Mediterranean Sea). Remote Sens. 8 (6), 443. Martha, T.R., Kerle, N., Jetten, V., van Westen, C.J., Kumar, K.V., 2010. Characterising spectral, spatial and morphometric properties of landslides for semi-automatic detection using object-oriented methods. Geomorphology 116, 24–36. Martin, Y.E., Franklin, S.E., 2005. - Classification of soil and bedrock-dominated landslides in British Columbia using segmentation of satellite imagery and DEM data. Int. J. Remote Sens. 26, 1505–1509. Massonnet, D., Feigl, K.L., 1998. Radar interferometry and its application to changes in the Earth's surface. Rev. Geophys. 36, 441–500. Meisina, C., Zucca, F., Notti, D., Colombo, A., Cucchi, G., Giannico, C., Bianchi, M., 2008. Geological interpretation of PSInSAR data at regional scale. Sensors 8 (11), 7469–7492. Metternicht, G., Hurni, L., Gogu, R., 2005. - Remote sensing of landslides: an analysis of the potential contribution to geospatial systems for hazard assessment in mountain environments. Remote Sens. Environ. 98, 284–303. Moosavi, V., Talebi, A., Shirmohammadi, B., 2014. Producing a landslide inventory map using pixel-based and object‐oriented approaches optimized by Taguchi method. Geomorphology 204, 646–656. Mora, O., Mallorquì, J.J., Broquetas, A., 2003. Linear and nonlinear terrain deformation maps from a reduced set of interferometric SAR images. IEEE Trans. Geosci. Remote Sens. 41, 2243–2253. Piacentini, P., Troiani, F., Soldati, M., Notarnicola, C., Savelli, D., Schneiderbauer, S., Strada, C., 2012. Statistical analysis for assessing shallow-landslide susceptibility in South Tyrol (south-eastern Alps, Italy). Geomorphology 151, 196–206. Rau, J.Y., Chang, K.T., Shao, Y.C., Lau, C.C., 2012. Semi-automatic shallow landslide detection by the integration of airborne imagery and laser scanning data. Nat. Hazards 61, 469–480. Righini, G., Pancioli, V., Casagli, N., 2012. Updating landslide inventory maps using Persistent Scatterer Interferometry (PSI). Int. J. Remote Sens. 33 (7), 2068–2096. Schneiderbauer S., Iasio C., Mair V., Strada C., Sonnerer A., 2011. Potential and limitations of COSMO Sky-Med and other SAR data for monitoring and detection of slow moving landslides. In: Proceedings of the 34th International Symposium on Remote Sensing Environment, Sydney, Australia, April 10–15, 2011. Selby, M.J., 1993. Hillslope: Material and Processes. Oxford University Press, Oxford (UK). Singhroy, V., Mattar, K., Gray, A., 1998. Landslide characterization in Canada using interferometric SAR and combined SAR and TM images. Adv. Space Res. 21 (3), 465–476. Singhroy V., 2002. Landslide hazards: CEOS, The use of earth observing satellites for hazard support: assessments and scenarios. Final report of the CEOS Disaster Management Support Group, NOAA, pp. 98. Stumpf, A., Kerle, N., 2011. Object-oriented mapping of landslides using random forests. Remote Sens. Environ. 115, 2564–2577. Tiede, D., Lang, S., Hoffmann, C., 2008. Type-specific class modelling for one-level representation of single trees, Object-Based Image Analysis: Spatial Concepts for Knowledge-Driven Remote Sensing Applications. Springer, Berlin, German, pp. 133–151. Tollmann A., 1980. Geology and tectonics of the Eastern Alps (Middle Sector). Abhandlungen der Geologischen Bundesanstalt, 34, pp. 197–255. Tsou, C.-Y., Feng, Z.-Y., Chigira, M., 2011. Catastrophic landslide induced by Typhoon Morakot, Shiaolin, Taiwan. Geomorphology 127, 166–178. van Westen, C.J., Castellanos, E., Kuriakose, S.L., 2008. Spatial data for landslide susceptibility, hazard, and vulnerability assessment: an overview. Eng. Geol. 102, 112–131. Vlcko J., Maas P., Ayele T., 2001. Assessment of the engineering geological conditions of Lubietova village for the urbanization purposes Final report, pp. 20. (in Slovak). Wu, C.-H., Chen, S.-C., Feng, Z.-Y., 2014. Formation, failure, and consequences of the Xiaolin landslide dam, triggered by extreme rainfall from Typhoon Morakot, Taiwan. Landslides 11, 357–367. http://dx.doi.org/10.1007/s10346-013-0394-4. Zebker, H.A., Goldstein, R.M., 1986. Topographic mapping from interferometric synthetic aperture radar observations. J. Geophys. Res. 91, 4993–4999.