Photonirvachak
J. Indian Soc. Remote Sens. (June 2010) 38 : 301– 320
RESEARCH ARTICLE
Landslide Susceptibility mapping of a catchment area using frequency ratio, fuzzy logic and multivariate logistic regression approaches B. Pradhan
Received: 24 May 2009 / Accepted: 25 January 2010
Keywords Landslides . Susceptibility . Fuzzy logic . Frequency ratio . Multivariate logistic regression . GIS . Remote sensing . Malaysia Abstract Geospatial database creation for landslide susceptibility mapping is often an almost inhibitive activity. This has been the reason that for quite some time landslide susceptibility analysis was modelled on the basis of spatially related factors. This paper presents the use of frequency ratio, fuzzy logic and multivariate regression models for landslide susceptibility mapping on Cameron catchment area,
B. Pradhan ( ) Institute of Cartography, Dresden University of Technology 01082, Dresden, Germany
email:
[email protected],
[email protected]
Malaysia, using a Geographic Information System (GIS) and remote sensing data. Landslide locations were identified in the study area from the interpretation of aerial photographs, high resolution satellite images, inventory reports and field surveys. Topographical, geological data and satellite images were collected, processed, and constructed into a spatial database using GIS and image processing tools. There were nine factors considered for landslide susceptibility mapping and the frequency ratio coefficient for each factor was computed. The factors chosen that influence landslide occurrence were: topographic slope, topographic aspect, topographic curvature and distance from drainage, all from the topographic database; lithology and distance from lineament, taken from the geologic database; land cover from TM satellite image; the vegetation index value from Landsat satellite images; and precipitation distribution from meteorological data. Using these factors the fuzzy membership values were calculated. Then fuzzy operators were applied to the fuzzy membership values for landslide susceptibility
302
mapping. Further, multivariate logistic regression model was applied for the landslide susceptibility. Finally, the results of the analyses were verified using the landslide location data and compared with the frequency ratio, fuzzy logic and multivariate logistic regression models. The validation results showed that the frequency ratio model (accuracy is 89%) is better in prediction than fuzzy logic (accuracy is 84%) and logistic regression (accuracy is 85%) models. Results show that, among the fuzzy operators, in the case with “gamma” operator (λ = 0.9) showed the best accuracy (84%) while the case with “or” operator showed the worst accuracy (69%).
Introduction Globally, landslides cause approximately 1,000 deaths per year with property damage of about US4 billion. Landslides are major natural geological hazards in Malaysia causing damage to both property and lives. Malaysia experiences frequent landslides, with the most recent occurring in 2000, 2001, 2004, 2007, 2008 and 2009. They often result in significant damage to people and property (Pradhan, 2010). In the Cameron catchment area, much damage was caused by the triggering of landslides and mudslides due to the torrential rainfall. Few landslides have been reported near high-rise apartments and in residential areas. Most of these landslides occurred on cut slopes or on embankments alongside roads and highways in mountainous areas. The recent landslides which occurred near the north Klang valley express highways is a good example of the tropical landslide in Malaysia. In the literature many attempts have been made to predict these landslides using various statistical, data mining and soft computing techniques. Through scientific analyses of landslides, we can assess and predict landslide-susceptibility areas, and thus decrease landslide damage which can be useful for landslide planning purposes. By using this kind of prediction models, landslide damage could be greatly decreased to a certain extent. This paper
J. Indian Soc. Remote Sens. (June 2010) 38 : 301– 320
presents landslide-susceptibility mapping at Cameron catchment area using frequency ratio, fuzzy logic and multi-variate logistic regression models. In addition, landslide-related factors were also assessed and weightage for each of the thematic layers were calculated using the fuzzy membership functions. Recently, there have been studies on landslide susceptibility evaluation using GIS, and many of these studies have applied probabilistic methods (Rowbotham and Dudycha, 1998; Jibson et al., 2000; Luzi et al., 2000; Parise and Jibson, 2000; Rautelal and Lakhera, 2000; Baeza and Corominas, 2001; Lee and Min, 2001; Temesgen et al., 2001; Clerici et al., 2002; Donati and Turrini, 2002; Lee et al., 2002b; Rece and Capolongo, 2002; Zhou et al., 2002; Lee and Choi, 2003c; Lee et al., 2004b; Chung and Fabrri, 2003; Lee and Pradhan, 2006, 2007; Youssef et al., 2009; Pradhan and Lee, 2010a, 2010b 2010c; Pradhan et al., 2010a). The logistic regression model, has also been applied to landslide susceptibility mapping (Atkinson and Massari, 1998; Dai et al., 2001; Dai and Lee, 2002; Ohlmacher and Davis, 2003; Vijith and Madhu, 2007, 2008). Pradhan et al., (2008) Pradhan and Lee, 2010a, 2010b and Other traditional methods such as geotechnical and the safety factor method have also been applied in the literature (Gokceoglu et al., 2000; Romeo, 2000; Carro et al., 2003; Shou and Wang, 2003; Zhou et al., 2003, Guzzetti et al., 1999; Remondo et al., 2003). Recently, there are new approaches to landslide susceptibility evaluation using data mining, fuzzy logic, and artificial neural network methods have been applied in various case studies (Ercanoglu and Gokceoglu, 2002; Pistocchi et al., 2002; Lee et al., 2003a; Lee et al., 2003b; Lee et al., 2004a; Pradhan et al., 2009; Pradhan and Lee, 2009c, 2009d; Pradhan et al., 2010). The main difference between the present study and the approaches described in the aforementioned publications is that frequency ratio, fuzzy logic and multivariate logistic regression models were applied and compared for landslide susceptibility mapping. In this paper, remote sensing data along with other tabular and meta data were used to delineate the landslide susceptibility mapping for the Cameron catchment basin. Terrain information such as slope,
303
J. Indian Soc. Remote Sens. (June 2010) 38 : 301– 320
aspect, curvature, distance from drainage, geology, distance from lineament, soil, land cover, normalized difference vegetation index (NDVI) and precipitation information have been extracted to enable the quantification of landslide causative parameters. Then, the calculated and extracted factors were converted to a 10m × 10m grid (ARC/INFO GRID type). Frequency ratio, fuzzy logic operators and logistic regression models were applied using the extracted database and the spatial relationships between the landslide location and each landslide-related factor were analyzed. Using the frequency ratio models, the relationship was used as each factor’s rating in the overlay analysis. Using the fuzzy logic model, each factor’s weight was determined and landslide susceptibility map was produced. Using logistic regression, a formula of landslide occurrence possibility was extracted using the relationships. This formula was used to calculate the landslide susceptibility index (LSI) and the index was mapped to represent landslide susceptibility. Finally, the maps
were verified and compared using known landslide locations and success rates and ratio areas were calculated for quantitative validation. In the study, GIS software, ArcView 3.2, and ARC/INFO 9.0 version software packages and SPSS 12.0 statistical program were used as the basic analysis tools for spatial management and data manipulation.
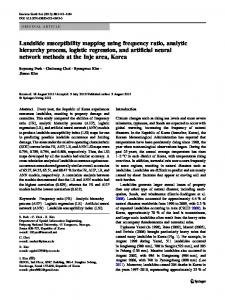
Materials and methods Study area Cameron catchment area, which has suffered much landslide damage following heavy rains, was selected to evaluate landslide susceptibility mapping. The study area (Fig. 1) falls in the districts of Pahang state which is one of the 13 states of Malaysia. The study area lies between 4°24’0" N and 4°38’0" N, and 101°20’0" E and 101°28’0" E, and covers an area 265 km2 and is located near the central part of peninsular Malaysia.
Fig. 1 (a) Landsat ETM mosaic image of Peninsular Malaysia; (b) Hill shaded map showing landslide locations for the study area.
304
The district of Cameron highlands is located on the eastern flank of the main range, which is composed of granitic rock. The granite in the study area is classified as megacrystic biotite granite. Cobbing et al., (1992) mentioned that some of the granite and the associated micro-granite may contain muscovite and may be mineralized. The meta-sediments consist of schist, phyllite, slate and limestone (Chow et al., 2003). Minor intercalations of sandstone and volcanics are present as well. The regional geology map of the study area and its surrounding areas is shown in Fig. 2. Post-Triassic- Mesozoic granite comprises of most
J. Indian Soc. Remote Sens. (June 2010) 38 : 301– 320
of the granite rocks where as there are few patches of metamorphic rocks mostly comprising of SilurianOrdovician Schist, phyllite, limestone and sandstone. The annual rainfall of Cameron catchment, like in all tropical hilly regions, is very high, averaging between 2,500 mm and 3,000 mm per annum. There are two pronounced wet seasons between September to December and from February to May each year. The rainfall in the study area peaks between March to May and also from November to December. The single-day highest rainfall could range from 87 mm to 100 mm. It is during such times that many streams and
Fig. 2 Regional generalized geology and structural pattern of the Cameron area (Source: Department of Mineral and Geosciences, Malaysia)
305
J. Indian Soc. Remote Sens. (June 2010) 38 : 301– 320
rivers in the Cameron catchment may overflow, flooding the surrounding areas and landslides such as debris flow may occur along the river valleys. The intensity of the rain is another factor that affects the fill slopes causing severe sheet, rill and gully erosion. The landslides occurred when the maximum daily rainfall exceeded 100 mm, with a maximum hourly rainfall of 40 mm.
Data and material used To apply the frequency ratio, fuzzy logic and multivariate logistic regression models, a spatial database that considers landslide-related factors was designed and constructed. The spatial database was constructed and is listed in Table 1. Accurate detection of the location of landslides is very important for probabilistic landslide susceptibility analysis. The application of remote sensing methods, such as aerial photographs and high resolution satellite images, are used to obtain significant and cost-effective information on landslides. In this study, 1:25,000– 1:50,000-scale aerial photographs were used to detect
the landslide locations. These photographs were taken during the period 1981-2004, and the landslide locations were detected by photo interpretation and the locations were verified by fieldwork. In the study area, a total of 324 landslides were mapped in a mapped area of 265 km2. In this paper, nine landslide causative factors were considered for the susceptibility analysis, and the factors were extracted from the constructed spatial database (Table 1). The factors were transformed into a vector-type spatial database using the GIS. Based on the topographic maps, 1:25,000 digital databases acquired from Malaysian topographic maps (series L7030, scale 1:25,000) a digital elevation model (DEM) with a resolution of 10 m was generated using ArcGIS 9.0. All the contour data were extracted from topographic maps. A total of nine sheets of maps were used in this study. TIN (Triangulated Irregular Network) was made using the elevation values. A DEM (digital elevation model) was made using the IDW (inverse distance weighting) interpolation method with 10 m resolution. Using the above DEM, slope angle, slope aspect, and slope curvatures were calculated. Substantial
Table 1 Thematic data layer of the study area Classification Landslide
GIS Data Type Landslide
Scale or Resolution
ARC/INFO Polygon coverage
1:25,000
Topographic map Slope Aspect Curvature
ARC/INFO Line and point coverage
1:25,000
Drainage map
Distance from drainage
ARC/INFO Line Coverage
1:25,000
Soil map
Types
ARC/INFO Polygon coverage
Geology map
Litho types Distance from lineaments
ARC/INFO Polygon, line coverage
1:63,300
Land cover
Land cover
ARC/INFO GRID
30×30 m
NDVI
NDVI
ARC/INFO
10×10 m
Precipitation
Precipitation
GRID
10×10 m
ARC/INFO GRID
1:100,000
10×10 m
306
attention was paid to the slope conditions, since slope configuration and steepness plays an important role. The slope map shows that the slope varies from 0 to 45° in plain areas to nearly vertical cliffs > 45° in steep areas. The aspect map displays eight slope directions. The curvature map shows a concave surface types showing negative values and convex types showing positive values. The aspect and curvature maps were prepared using the Digital Elevation Model Analysis Tool (DEMAT) of ArcView 3.2. The drainage map at the scale of 1:25,000 was obtained from the Department of Drainage and Irrigation, Malaysia. The distances from the drainage lines were calculated using the drainage database. The drainage buffers were calculated based on the Euclidean distance method in ArcView 3.2. The lithology map was obtained and compiled from the 1:63,300-scale geological map from Mineral and Geosciences Department of Malaysia. Additionally, fault lines and major lineaments were derived from the structural maps. In this study, we have extracted landcover information from Landsat ETM image using objectbased classification method in eCognition software. The segmentation function and classification method performed using eCognition software was found to be a better way to produce the land cover information. The object oriented segmentation not only segregates the objects or pixel groups using their spectral characteristics but can also distinguish various classes in the images based on their shape and texture (AlFugara et al., 2009). The Landsat ETM scene of 9 April 2004 was classified to map the different landcover classes. The soil map was obtained from the hard copy 1:100,000 soil map from the Department of Soils of Malaysia which is the only existing soil map for the study area. The NDVI map was obtained from Landsat TM satellite images. The NDVI value was calculated using the common formula NDVI = (IR – R)/(IR + R). The NDVI value denotes areas of vegetation in an image. The precipitation map was prepared using the past 23 years (1981-2004) of historical annual average rainfall data. In the study area, there are only two rain gauge stations located. So data used in this study is collected from these stations and a statistical
J. Indian Soc. Remote Sens. (June 2010) 38 : 301– 320
distribution of the accumulated average precipitation was prepared in GIS. Using the aforementioned factors and the landslide inventory database, the relationships were calculated using the frequency ratio, fuzzy logic and multivariate logistic regression models. Then, the fuzzy membership values were also calculated using the frequency ratio values. The fuzzy membership values were combined using the fuzzy “and”, fuzzy “or”, fuzzy algebraic “product”, fuzzy algebraic “sum” and fuzzy gamma operators (17 cases) for landslide susceptibility mapping. Finally, the maps were validated by comparing with the existing landslide locations for quantitative verification.
Methodology Frequency ratio model and its application Frequency ratio approach is based on the observed relationships between distribution of landslides and each landslide-related factor, revealing the correlation between landslide locations and the causative factors in the study area. Using the frequency ratio model, the spatial relationships between landslide-occurrence location and each factors contributing landslide occurrence were derived. The frequency is calculated from analysis of the relation between landslides and the attributing factors. Therefore, the frequency ratios of each factor’s type or range were calculated from their relationship with landslide events as shown in Table 2. In the relation analysis, the ratio is that of the area where landslides occurred to the total area, so that a value of 1 is an average value. If the value is greater than 1, it means a higher correlation, and value lower than 1 means lower correlation. In the case of slope, the relationship between landslide occurrence and the slope (Table 2) shows that steeper slopes have greater landslide probabilities. Below a slope of 20°, the frequency ratio was 0.57, which indicates a very low probability of landslide occurrence. For slopes above 21°, the ratio was >1, which indicates a high probability of landslide occurrence. As the slope angle increases, then the
307
J. Indian Soc. Remote Sens. (June 2010) 38 : 301– 320
shear stress in the soil or other unconsolidated material generally increases. Gentle slopes are expected to have a low frequency of landslides because of the generally lower shear stresses associated with low gradients. Steep natural slopes resulting from outcropping bedrock, however, may not be susceptible to shallow landslides. In the case of the aspect (Table 2), landslides were most abundant on north-facing and north-east-facing slopes. The frequency of landslides was lowest on south-facing, south-west-facing, and sout-heast-facing slopes. Similar explanations can be interpreted for other landslide causative factors from Table 2.
To calculate the LSI, each factor’s frequency ratio values were summed in equation (1). The landslide susceptibility value represents the relative susceptibility to the landslide occurrence. So the greater the value, the higher the susceptibility to landslide occurrence and the lower the value, the lower the susceptibility to landslide occurrence. LSI = Fr1 +Fr2 + …… + Frn
(1)
(LSI: Landslide Susceptibility Index; Fr: Rating of each factors’ type or range) The landslide susceptibility map was made using the LSI values and is shown in Fig. 3.
Fig. 3 Landslide susceptibility map based on frequency ratio model
Curvature Distance from drainage
Aspect
0°1° ~2°
Slope
3°~ 9° 10° ~15° 16° ~ 19° 20° ~ 22° 23° ~25° 26° ~ 28° 29° ~ 33° 34° ~ 85° North North-east East South-east South South-west West North-west Concave Flat Convex 0-91m 92 ~183m 184 ~ 275m 276 ~ 367m 368 ~ 458m 459 ~ 550m 551 ~ 642m 643 ~ 734m 735 ~ 826m 332 ~2064m
Class
Factor
356510 276662 291037 303259 327938 314064 264713 200789 170253 149351 487967 317441 304579 307210 305365 318819 305257 307938 1234845 242494 1177237 348759 276136 268248 324329 240123 283647 263610 221676 216649 211519
Pixels in domain
13.43 10.42 10.96 11.42 12.35 11.83 9.97 7.56 6.41 5.63 11.96 11.47 11.57 11.50 12.01 11.50 11.60 100.00 46.52 9.13 44.35 13.14 10.40 10.10 12.22 9.05 10.68 9.93 8.35 8.16 7.97
Pixel %
0 10 17 12 23 42 27 43 63 87 70 50 62 28 22 15 34 324 50 0 274 27 32 33 56 29 26 40 22 31 28
Landslide occurrence points 0.00 3.09 5.25 3.70 7.10 12.96 8.33 13.27 19.44 26.85 21.60 15.43 19.14 8.64 6.79 4.63 10.49 100.00 15.43 0.00 84.57 8.33 9.88 10.19 17.28 8.95 8.02 12.35 6.79 9.57 8.64
Landslide occurrence points %
Table 2 Frequency ratio, fuzzy logic and logistic regression coefficients to landslide occurrences
0.00 0.30 0.48 0.32 0.57 1.10 0.84 1.75 3.03 4.77 1.81 1.34 1.65 0.75 0.57 0.40 0.90 1.00 0.33 0.00 1.91 0.63 0.95 1.01 1.41 0.99 0.75 1.24 0.81 1.17 1.08
Frequency ratio
0.00 0.00 0.11 0.18 0.19 0.27 0.17 0.44 0.61 1.00 0.23 1.00 0.67 0.89 0.25 0.12 0.00 0.36 0.17 0.00 1.00 0.63 0.95 1.01 1.41 0.99 0.75 1.24 0.81 1.17 1.08
Fuzzy membership function
0.0007
0494
-0.0625
0.2463
0.8549
1.3537
1.2608
1.0790
0.8693
-10.2026
0.0655
Coefficients of logistic regression
308 J. Indian Soc. Remote Sens. (June 2010) 38 : 301– 320
NDVI
Barren land
cover
0.654~
0.814
0.494~ 0.6540
0.335 ~ 0.4940
0.175 ~ 0.335
0.016 ~ 0.175
-0.144 ~ 0.016
-0.304 ~ -0.144
-0.463 ~ -0.304
-0.623 ~ -0.463
-0.783 ~ -0.623
Residential area (Non-concrete)
Sparse Forest area
Residential area (Concrete)
Rubber
Agriculture
Dense Forest area
1552 ~ 4042m
1046 ~ 1551m
777 ~ 1045m
591 ~ 776m
452 ~ 590m
343 ~ 451m
247 ~ 342m
0 ~ 78m 80 ~ 160m 161~ 246m
LUD
Land
Soil Distance from fauel
246358
262579
263025
272567
271474
263376
275493
265642
267535
266128
2174
137986
29310
358942
110259
30434
1972384
264136
264317
264522
265297
264657
267100
9.28
9.89
9.91
10.27
10.23
9.92
10.38
10.01
10.08
10.03
0.08
5.22
1.11
13.59
4.17
1.15
74.67
9.95
9.96
9.96
9.99
9.97
10.06
28
21
25
20
21
24
32
42
66
45
00
3
9
121
26
13
125
22
27
20
22
21
32
32
49
10.04
266659 265863
56
10.00 10.01
43
10.04
27
297
265572
1.91
98.09
266573
50671
2604027
108
28
754263
STP
216
72
1900435
Acid intrusives Schist and phyllite
Geology
Landslide occurrence points
Pixel %
Pixels in domain
Class
Factor
8.64
6.48
7.72
6.17
6.48
7.41
9.88
12.96
20.37
13.89
0.00
9.26
2.78
37.35
8.02
4.01
38.58
6.79
8.33
6.17
6.79
6.48
9.88
0.93
0.66
0.78
0.60
0.63
0.75
0.95
1.30
2.02
1.39
0.00
1.77
2.50
2.75
1.92
3.48
0.52
0.68
0.84
0.62
0.68
0.65
0.98
0.93
0.66
0.78
0.60
0.63
0.75
0.95
1.30
2.02
1.39
0.00
1.77
2.50
2.75
1.92
3.48
0.52
0.68
0.84
0.62
0.68
0.65
0.98
0.99
1.51
1.51
15.12 0.99
1.73
1.73
9.88
1.32
1.32
4.37
17.28
4.37
13.27
8.33
0.93
1.305
1.17
33.33 0.93
0.98
0.93
66.67 91.67
Fuzzy membership function
Frequency ratio
Landslide occurrence points %
-0.7563
0.00000
13.2181
12.5318
13.0111
12.0051
13.2191
11.6513
-0.0004
-0.98950
0.0000
-0.17670
Coefficients of logistic regression
J. Indian Soc. Remote Sens. (June 2010) 38 : 301– 320 309
271275 267057 280898 272929 270309 281466 270930 252766 247914 239152
2613- 2651mm
2652 ~1676mm
2677 ~ 2695mm
2696 ~ 2707mm
2708 ~ 2718mm
2719 ~ 2730mm
2731 ~ 2742mm
2743 ~ 2753mm
2754 ~ 2763mm
2764 ~2772mm
Percipitation
Pixels in domain
Class
Factor
9.01
9.34
9.52
10.21
10.60
10.18
10.28
10.58
10.06
10.22
Pixel %
89
31
55
60
29
10
19
23
60
20
Landslide occurrence points
Fuzzy membership function 0.86 0.96 0.63 0.86 1.65 0.86 1.89 1.39 0.65 0.16
Frequency ratio
0.06 0.18 0.67 0.57 0.30 0.84 1.81 1.78 1.02 3.05
0.61 1.85 7.09 5.86 3.08 8.95 18.51 16.97 9.56 27.46
Landslide occurrence points %
0.0155
Coefficients of logistic regression
310 J. Indian Soc. Remote Sens. (June 2010) 38 : 301– 320
311
J. Indian Soc. Remote Sens. (June 2010) 38 : 301– 320
Results and discussion Fuzzy logic model and its application The fuzzy set theory introduced by Zadeh (1965) is one of the tools used to handle the complex problems. Therefore, the fuzzy set theory has been commonly used for many scientific studies in different disciplines. The idea of fuzzy logic is to consider the spatial objects on a map as members of a set. In the classical set theory, an object is a member of a set if it has a membership value of 1, or is not a member if it has a membership value of 0. In the fuzzy set theory, membership can take on any value between 0 and 1 reflecting the degree of certainty of membership. The fuzzy set theory employs the idea of a membership function that expresses the degree of membership with respect to some attribute of interest. With maps, generally, the attribute of interest is measured over discrete intervals, and the membership function can be expressed as a table relating map classes to membership values. Fuzzy logic is attractive because it is straightforward to understand and implement. It can be used with data from any measurement scale and the weighting of evidence is controlled entirely by the expert. The fuzzy logic method allows for more flexible combinations of weighted maps, and could be readily implemented with a GIS modeling language. This is different from datadriven approaches such as weights of evidence or logistic regression, which use the locations of known objects such as landslides to estimate weights or coefficients. The idea of using fuzzy logic in landslide susceptibility mapping is to consider the spatial objects on a map as members of a set. For example, the spatial objects could be areas on an evidence map and the set defined as ‘areas susceptibility to landslide’. Fuzzy membership values must lie in the range (0, 1), but there are no practical constraints on the choice of the fuzzy membership values. Values are chosen to reflect the degree of membership of a set, based on subjective judgment. Given two or more maps with fuzzy membership functions for the same set, a variety of operators can be employed to combine the membership values.
Zimmerman (1996) discussed a variety of combination rules. Bonham-Carter (1994) discussed five operators, namely the fuzzy, fuzzy or fuzzy algebraic product, fuzzy algebraic sum and fuzzy gamma operator. This study uses the five fuzzy operators for combining the fuzzy membership functions. The fuzzy AND is equivalent to a Boolean AND (logical intersection) operation on classical set values of equation (2). It is defined as: mcombination = MIN (mA, mB, mC, …)’
(2)
where, m combination is the calculated fuzzy membership function, mA is the membership value for map A at a particular location and mB is the value for map B, and so on. The fuzzy ‘or’ is like the Boolean OR (logical union in that the output membership values are controlled by the maximum values of any of the input maps. The fuzzy ‘or’ is defined as: mcombination = MAX (mA, mB, mC, …)
(3)
The fuzzy algebraic product is defined as: n
mcombination = mI,
(4)
i 1
where, mi is the fuzzy membership function for the i-th map, and i = 1, 2, …, n maps are to be combined. The fuzzy algebraic sum is complementary to the fuzzy algebraic product, being defined as: n
mcombination = 1 – (1 –mI)
(5)
i 1
The gamma operation is defined in terms of the fuzzy algebraic product and the fuzzy algebraic sum by: combination = (Fuzzy algebraic sum) l * (Fuzzy algebraic product) 1– l, (6) where, l is a parameter chosen in the range (0,1), and the fuzzy algebraic sum and fuzzy algebraic product are calculated using equations (4) and (5), respectively. In the fuzzy gamma operation, when l is 1 the combination is the same as the fuzzy algebraic
312
sum, and when l is 0 the combination equals the fuzzy algebraic product. Judicious choice of l produces output values that ensure a flexible compromise between the ‘increase’ tendencies of the fuzzy algebraic sum and the ‘decrease’ effects of the fuzzy algebraic product. Like the membership function, the frequency ratio was calculated. The frequency ratio is shown in Table 2 for all factors. The spatial relationships between the landslide location and each landslide-related factor were analyzed by using the probability frequency ratio model. Then, the frequency ratio was normalized between 0.00 and 1.00 to create the fuzzy membership value (Table 2). Using the fuzzy operators, the landslide susceptibility map was produced as shown in Fig. 4. Logistic regression model and its application Logistic regression allows one to form a multivariate regression relation between a dependent variable and several independent variables. Logistic regression, which is one of the multivariate analysis models, is useful for predicting the presence or absence of a characteristic or outcome based on values of a set of predictor variables. The advantage of logistic regression is that, through the addition of an appropriate link function to the usual linear regression model, the variables may be either continuous or discrete, or any combination of both types and they do not necessarily have normal distributions. In the case of multi-regression analysis, the factors must be numerical, and in the case of a similar statistical model, discriminant analysis, the variables must have a normal distribution. In the present situation, the dependent variable is a binary variable representing presence or absence of landslide. Where the dependent variable is binary, the logistic link function is applicable (Atkinson and Massari, 1998). For this study, the dependent variable must be input as either 0 or 1, so the model applies well to landslide possibility analysis. Logistic regression coefficients can be used to estimate ratios for each of the independent variables in the model.
J. Indian Soc. Remote Sens. (June 2010) 38 : 301– 320
Quantitatively, the relationship between the occurrence and its dependency on several variables can be expressed as: p = 1 / (1 + e-z)
(7)
where, p is the probability of an event occurring. In the present situation, the value p is the estimated probability of landslide occurrence. The probability varies from 0 to 1 on an S-shaped curve and z is the linear combination. It follows that logistic regression involves fitting an equation of the following form to the data: z = b0 + b1x1 + b2x2 + … + bnxn
(8)
where, b0 is the intercept of the model, the bi (i = 0, 1, 2, …, n) are the slope coefficients of the logistic regression model, and the xi (i = 0, 1, 2, …, n) are the independent variables. The linear model formed is then a logistic regression of presence or absence of landslides (present conditions) on the independent variables (pre-failure conditions). Using the logistic regression model, the spatial relationship between landslide-occurrence and factors influencing landslides was assessed. The spatial databases of each factor were converted to ASCII format files for use in the statistical package, and the correlations between landslide and each factor were calculated. There are two cases. In the first case, only one factor was used. In this case, logistic regression mathematical equations were formulated for each factor. The logistic regression coefficient of the causative factors is shown in Table 2. Finally, the probability that predicts the possibility of landslideoccurrence was calculated using the spatial database, coefficients from Table 2, equations (7) and (8). In the second case, all factors were used. In this case, logistic regression mathematical equations were formulated as shown in equations (7) and (9) for each case. The coefficient is shown in Table 2. Z10 = (0.0655´ Slope) + Aspect c + (0.0494´ Curvature) + (0.0007´ Drainage) + Lithologyc + (0.0004´ Lineament) + Soilc + Landcoverc + (-0.7563´ ndvi) + (0.0155 Precipitation) – 64.1220 (9) where, “Slope” is slope value; “Curvature” is curvature value; “Drainage” is distance from drainage
J. Indian Soc. Remote Sens. (June 2010) 38 : 301– 320
313
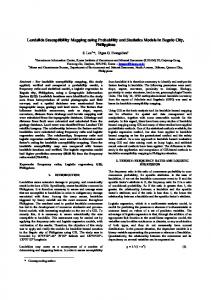
Fig. 4 Landslide susceptibility maps using various fuzzy operators; (a) Application of fuzzy algebraic “sum” operator.
Fig. 4 Landslide susceptibility maps using various fuzzy operators; (b) Application of fuzzy algebraic “and” operator.
Fig. 4 Landslide susceptibility maps using various fuzzy operators; (c) Application of fuzzy “or” operator;
Fig. 4 Landslide susceptibility maps using various fuzzy operators; (d) Application of fuzzy gamma (ë = 0.9) operator “and”
314
J. Indian Soc. Remote Sens. (June 2010) 38 : 301– 320
Fig. 4 Landslide susceptibility maps using various fuzzy operators; (e) Application of fuzzy gamma (ë = 0.95) operator
Fig. 5 Landslide susceptibility map based on multivariate logistic regression model
value, “Lineament” is distance from Lineament value, “ndvi” is NDVI value, and “Aspectc”, “Lithologyc”, Soil c ” , “Landcover c ” and “Precipitation” is “ Precipitation value are logistic regression coefficient value listed in Table 2 and z10 is a parameter). Using formula (7) and (8), the landslide susceptibility map was made (Fig. 5).
between 3.7 and 17.97 for each pixel. In the case of fuzzy operators, the index values were between 0.1 and 0.9 for each pixel. Similarly, in the case of multivariate logistic regression model, the index values were between 0 and 0.0013 for each pixel. Subsequently, the output indices were converted to GIS grid data. Using such values, the landslide susceptibility indices (LSI) were determined and used to create the landslide susceptibility maps. Seven landslide susceptibility maps were prepared (for illustration, Figs. 3, 4 and 5), by using frequency ratio (Fig.3), fuzzy logic operators (Fig. 4), and multivariate logistic regression models (Fig. 5). The value of susceptibility was classified by equal area and grouped into five classes for easy and visual interpretation. With an increase in the index, the landslide susceptibility also increases for all the cases. The patterns of the three cases were very similar, but there is some difference in the distribution of index values.
Generation of LSI classification Once the frequency ratio, fuzzy logic and multivariate logistic regression models were applied and the weights for the causative parameters were computed, each and every pixel of the whole dataset was used to categorize to one of the landslide susceptibility zonation classes to produce the LSI classification. In other words, the LSI value was calculated from the weights determined from the three models and the spatial datasets. In the case of susceptibility map produced by frequency ratio, the index values were
315
J. Indian Soc. Remote Sens. (June 2010) 38 : 301– 320
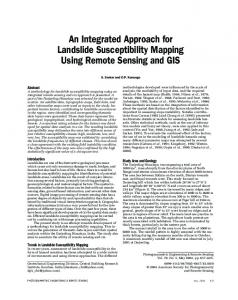
Validation and comparison of the models For validation of landslide susceptibility calculation models, two basic assumptions are needed. One is that landslides are related to spatial information such as topography, soil, and land cover, and the other is that future landslides will be triggered by a specific factor such as rainfall. In this study, the two assumptions were satisfied because the landslides were related to the spatial information and the landslides were triggered by heavy rainfall in the study area. The landslide susceptibility analysis results were validated using the known landslide locations. Validation was performed by comparing the known landslide location data with the landslide susceptibility maps. The rate curves were created and its areas of the under curve were calculated for all cases. The rate explains how well the models and factors predict the landslides. In other words we can say that, the area under curve can assess the prediction accuracy qualitatively. To obtain the relative ranks for each prediction pattern, the calculated index values of all cells in the study area were sorted in descending order. Then the ordered cell values were divided into 100 classes, with accumulated 1% intervals. In this way, the ordered pixel values were set on the y-axis, with accumulated intervals on the xaxis. The verification results are divided into classes of accumulated area ratio percentage according to the landslide susceptibility value (Fig. 6). The rate verification results appear as a line in Fig. 6. For example, in the case of frequency model used, 90 to 100% (10%) class of the study area where the landslide susceptibility index had a higher rank could explain 58% of all the landslides. In addition, the 80 to 100% (20%) class of the study area where the landslide susceptibility index had a higher rank could explain 82% of the landslides. In the case of logistic regression model used, 90 to 100% (10%) class of the study area where the LSI had a higher rank could explain 51% of all the landslides. In addition, the 80 to 100% (20%) class of the study area where the LSI had a higher rank could explain 76% of the landslides. To compare
the result quantitative, the areas under the curve were re-calculated as the total area is 1 which means perfect prediction accuracy. So, the area under a curve can be used to assess the prediction accuracy qualitatively. In the case of frequency ratio model used, the area ratio was 0.8925 and we could say the prediction accuracy is 89.25% (Table 3). Similarly, in the case of multivariate logistic regression model used, the area ratio was 0.8573 and we could say the prediction accuracy is 85.73% (Table 3). In the case of application of fuzzy algebraic “sum” operator, the 90%–100% (10%) class with the highest probability of a landslide contains 30% and the 80%– 100% class (20%) contains 52% of the landslides of study area. In the case of applying the fuzzy “And” operator, the 90%–100% (10%) class with the highest probability of a landslide contains 35% and the 80%– 100% class (20%) contains 58% of the landslides of study area. In the case of the “gamma” operator (l = 0.9), the 90%–100% (10%) class with the highest possibility of a landslide contains 50% and the 80%– 100% class (20%) contains 74% of the landslides of study area. In the case of applying the “gamma” operator (l = 0.95), the 90%–100% (10%) class with the highest possibility of a landslide contains 50% and 80%–100% class (20%) contains 68% of the landslides of study area. In the case of applying fuzzy algebraic “And”, the area ratio was 0.8061 and we could say that the prediction accuracy is 80.61% (Table 3). In the case of applying fuzzy algebraic “sum”, the area ratio was 0.7531 and we could say that the prediction accuracy is 75.31% (Table 3). In the case of applying the gamma operator (l = 0.975), the area ratio was 0.8172 and the prediction accuracy is 81.72% (Table 3). Overall the case of frequency ratio model used showed a slightly higher accuracy than the fuzzy logic operators and multivariate logistic regression models.
Conclusions In the present study, frequency ratio analysis, fuzzy logic operators and multivariate logistic regression
316
J. Indian Soc. Remote Sens. (June 2010) 38 : 301– 320
Fig. 6 Cumulative frequency diagram showing success rate curve for susceptibility maps produced by frequency ratio, fuzzy operators and multivariate logistic regression models Table 3 Verification results using area under curve (AUC) Models used
Prediction accuracy (%)
Frequency ratio
89.25
Fuzzy “And”
80.61
Fuzzy “Or”
69.15
Fuzzy Algebraic “Sum”
75.31
Fuzzy Algebraic “Product”
80.25
Fuzzy Gamma (ë) = 0.025
81.34
Fuzzy Gamma (ë) = 0.05
81.73
Fuzzy Gamma (ë) = 0.1
81.73
Fuzzy Gamma (ë) = 0.2
81.73
Fuzzy Gamma (ë) = 0.3
81.73
Fuzzy Gamma (ë) = 0.4
81.73
Fuzzy Gamma (ë) = 0.5
81.73
Fuzzy Gamma (ë) = 0.6
81.73
Fuzzy Gamma (ë) = 0.7
81.73
Fuzzy Gamma (ë) = 0.8
84.52
Fuzzy Gamma (ë) = 0.9
84.52
Fuzzy Gamma (ë) = 0.95
81.72
Fuzzy Gamma (ë) = 0.975
81.72
Multivariate logistic regression
85.73
317
J. Indian Soc. Remote Sens. (June 2010) 38 : 301– 320
methods were applied for the landslide susceptibility mapping for Cameron catchment area. Using the fuzzy logic model, different fuzzy operators and different “l” values for the gamma operation were tested on the input fuzzy membership functions to generate the most reliable landslide susceptibility map. The validations results show that the frequency ratio model has slightly better predication accuracy than the fuzzy logic and multivariate logistic regression models. Using the fuzzy logic model, among the 17 cases (Table 3), the case of applying the gamma operator (l = 0.9), showed the best accuracy (84.52%), whereas the fuzzy algebraic “or” operators showed (69.15%) the worst accuracy. In the case of applying the gamma operator with different l value, the prediction accuracy had a similar value, between 81.34% and 84.52%. Generally, the verification results showed satisfactory agreement between the susceptibility map and the existing data from landslide locations. Results show that, the effect of choosing different values of gamma (between 0 and 1) is not large. This is clearly seen in the landslide susceptibility maps showing the same trend for different gamma operators (Fig. 6). Here one can conclude that the results of frequency ratio model had shown the best prediction accuracy in landslide susceptibility mapping. In this study, both the data derived model (frequency ratio and multivariate logistic regression) and the knowledge-derived model (fuzzy logic) were used. As a result, the data and knowledge derived model is shown to be useful for landslide susceptibility mapping. The frequency ratio model is simple, the process of input, calculation and output can be readily understood. The large amount of data can be processed in the GIS environment quickly and easily. The multivariate logistic regression model requires conversion of the data to ASCII or other formats for use in the statistical package, and later reconversion to incorporate it into the GIS database. In the case of a fuzzy logic model, the factors must have a normal distribution, whereas in the case of multivariate regression analysis, the factors must be
numerical. In other words, the dependent variable must be input as 0 or 1, for landslide susceptibility analysis. Recently, landslide susceptibility mapping has shown a great deal of importance for suitable urban developments. The results shown in this paper can help the developers, planners and civil engineers for preliminary slope management and land-use planning. However, one must be careful while using the models for specific site development. The models used in the study are valid for generalized planning and preliminary assessment purposes.
Acknowledgements Thanks are due to the Alexander von Humboldt Foundation, Germany for awarding a visiting scientist position at Dresden University of Technology, Germany. Author would like to thank Malaysian Center for Remote Sensing, Department of Surveying and Malaysian Meteorological Department for providing various datasets for this research. This manuscript has been greatly benefited from the review of the anonymous reviewers which helped to bring to the current form.
References AlFugara AM, Pradhan B and Mohamed TA (2009) Enhancement of satellite image classification using object oriented and fuzzy logic approach. Applied Geomatics, artificial neural networks and their comparison with frequency ratio and bivariate logistic regression. Environ Modell Softw 25(6): 747-759 Atkinson PM and Massari R (1998) Generalized linear modeling of susceptibility to land sliding in the central Apennines, Italy. Comput Geosci 24:373385 Baeza C and Corominas J (2001) Assessment of shallow landslide susceptibility by means of multivariate statistical techniques. Earth Surf Proc Land 26:1127-1263
318
Bonham-Carter GF (1994) Geographic Information Systems for Geoscientists: Modelling with GIS. Carro M, De Amicis M, Luzi L and Marzorati S (2003) The application of predictive modeling techniques to landslides induced by earthquakes, the case study of the 26 September 1997 UmbriaMarche earthquake (Italy). Eng Geol, 69:139-159 Chow WS, Zakaria M, Ferdaus A Nurzaidi A (2003) Geological Terrain Mapping. JMG Unpublished Report, JMG.SWP.GS 16/2003 Chung CF and Fabbri AG (2003) Validation of spatial prediction models for landslide hazard mapping. Nat Hazards 30:451- 472 Clerici A, Perego S, Tellini C and Vescovi P (2002) A procedure for landslide susceptibility zonation by the conditional analysis method. Geomorphology, 48:349-364 Cobbing EJ, Pitfield PEJ, Darbyshire DPE and Mallick, DIJ (1992) The Granites of Southeast Asian tin belt. British Geolological Survey Oversea Memoir 10 Dai FC and Lee, CF (2002) Landslide characteristics and slope instability modeling using GIS, Lantau Island, Hong Kong. Geomorphology 42:213-228 Dai FC, Lee CF, Li J and Xu ZW (2001) Assessment of landslide susceptibility on the natural terrain of Lantau Island, Hong Kong. Environ Geol 40:381391 Donati L and Turrini MC (2002) An objective method to rank the importance of the factors predisposing to landslides with the GIS methodology, application to an area of the Apennines (Valnerina; Perugia, Italy). Eng Geol 63:277-289 Ercanoglu M and Gokceoglu, C (2002) Assessment of landslide susceptibility for a landslide-prone area (north of Yenice, NW Turkye) by fuzzy approach. Environ Geol 41:720-730 Gokceoglu C Sonmez, H and Ercanoglu M (2000) Discontinuity controlled probabilistic slope failure risk maps of the Altindag (settlement) region in Turkey. Eng Geol 55:277–296 Guzzetti F Carrarra, A Cardinali M and Reichenbach, P (1999) Landslide hazard evaluation: a review of
J. Indian Soc. Remote Sens. (June 2010) 38 : 301– 320
current techniques and their application in a multi-scale study. Central Italy. Geomorphology 31:181-216 Jibson WR Edwin, LH and John, AM (2000) A method for producing digital probabilistic seismic landslide hazard maps. Eng Geol 58:271–289 Lee S and Min K (2001) Statistical analysis of landslide susceptibility at Yongin, Korea. Environ Geol 40:1095-1113 Lee S, Chwae U and Min K (2002a) Landslide susceptibility mapping by correlation between topography and geological structure: the Janghung area, Korea. Geomorphology 46:49-162 Lee S, Choi J and Min K (2002b) Landslide susceptibility analysis and verification using the Bayesian probability model. Environ Geol 43:120-131 Lee S, Ryu JH, Min K and Won JS (2003a) Landslide susceptibility analysis using GIS and artificial neural network. Earth Surf Proc Land 27:13611376 Lee S, Ryu JH, Lee MJ and Won JS (2003b) Landslide susceptibility analysis using artificial neural network at Boun, Korea. Environ Geol 44:820833 Lee S and Choi U (2003c) Development of GIS-based geological hazard information system and its application for landslide analysis in Korea. Geoscience Journal 7:243-252 Lee S, Ryu JH, Won JS and Park HJ (2004a) Determination and application of the weights for landslide susceptibility mapping using an artificial neural network. Eng Geol 71:289-302 Lee S, Choi J and Min K (2004b) Probabilistic landslide hazard mapping using GIS and remote sensing data at Boun, Korea. Int J Remote Sens 25:2037-2052 Lee S and Pradhan B (2007) Landslide hazard mapping at Selangor, Malaysia using frequency ratio and logistic regression models. Landslides 4:33-41 Lee S and Pradhan B (2006) Probabilistic landslide risk mapping at Penang Island, Malaysia. J Earth Syst Sci 115(6):661-672 Luzi L, Pergalani F and Terlien MTJ (2000) Slope vulnerability to earthquakes at sub-regional scale,
J. Indian Soc. Remote Sens. (June 2010) 38 : 301– 320
using probabilistic techniques and geographic information systems. Eng Geol 58:313–336 Ohlmacher GC and Davis, JC (2003) Using multiple logistic regression and GIS technology to predict landslide hazard in northeast Kansa, USA. Eng Geol 69:331-343 Parise M and Jibson WR (2000) A seismic landslide susceptibility rating of geologic units based on analysis of characteristics of landslides triggered by the 17 January, 1994 Northridge, California earthquake. Eng Geol 58:251–270 Pistocchi A Luzi, L and Napolitano P (2002) The use of predictive modeling techniques for optimal exploitation of spatial databases: a case study in landslide hazard mapping with expert system-like methods. Environ Geol 41:765–775 Pradhan B and Lee S (2007) Utilization of optical remote sensing data and GIS tools for regional landslide hazard analysis by using an artificial neural network model. Earth Science Frontier 14(6):143-152 Pradhan B and Lee S (2009) Landslide risk analysis using artificial neural network model focusing on different training sites. Int J Phys Sci 3(11):1-15. Pradhan B (2010) Remote sensing and GIS-based landslide hazard analysis and cross-validation using multivariate logistic regression model on three test areas in Malaysia. Adv Space Res 45(10): 1244-1256 Pradhan B and Lee S (2010a) Delineation of landslide hazard areas on Penang Island, Malaysia, by using frequency ratio, logistic regression, and artificial neural network models. Environ Earth Sciences 60:1037-1054 Pradhan B and Lee S (2010b) Landslide susceptibility assessment and factor effect analysis: backpropagation artificial neural networks and their comparison with frequency ratio and bivariate logistic regression modelling. Environ Modell Softw 25(6): 747-759 Pradhan B and Lee S (2010c) Regional landslide susceptibility analysis using back-propagation neural network model at Cameron Highland, Malaysia. Landslides 7(1): 13-30
319
Pradhan B, Lee S and Buchroithner MF (2009) Use of geospatial data for the development of fuzzy algebraic operators to landslide hazard mapping: a case study in Malaysia. Applied Geomatics 1:3-15 Pradhan B, Lee S and Buchroithner MF (2010a) Remote sensing and GIS-based landslide susceptibility analysis and its cross-validation in three test areas using a frequency ratio model. Photogramm Fernerkun 1:17-32. Pradhan B, Lee S and Buchroithner MF (2010b) A GIS-based back-propagation neural network model and its cross application and validation for landslide susceptibility analyses. Comput Environ Urban 34:216-235. Pradhan B, Lee S, Mansor S, Buchroithner MF, Jallaluddin N and Khujaimah Z (2008) Utilization of optical remote sensing data and geographic information system tools for regional landslide hazard analysis by using binomial logistic regression model. J Appl Remote Sens 2:1-11 Pradhan B, Singh RP and Buchroithner MF (2006) Estimation of stress and its use in evaluation of landslide prone regions using remote sensing data. Adv Space Res 37:698 – 709 Rautelal P and Lakhera RC (2000) Landslide risk analysis between Giri and Tons Rivers in Himachal Himalaya (India). International Journal of Applied Earth Observation and Geoinformation 2:153-160 Rece A and Capolongo D (2002) Probabilistic modeling of uncertainties in earthquake-induced landslide hazard assessment. Comput Geosci 28:735 –749 Remondo J, Gonzalez A, Diaz de Teran JR, Cendrero A, Fabbri AG and Chung CJF (2003) Validation of landslide susceptibility maps: examples and applications from a case study in Northern Spain. Nat Hazards 30:437-449 Romeo R (2000) Seismically induced landslide displacements: a predictive model. Eng Geol 58:337-351 Rowbotham D and Dudycha DN (1998) GIS modeling of slope stability in Phewa Tal watershed, Nepal. Geomorphology 26:151-170
320
Shou KJ and Wang CF (2003) Analysis of the Chiufengershan landslide triggered by the 1999 ChiChi earthquake in Taiwan. Eng Geol 68:237-250 Temesgen B Mohammed, MU and Korme T (2001) Natural hazard assessment using GIS and remote sensing methods, with particular reference to the landslides in the Wondogenet area, Ethiopia. Phys Chem Earth (C) 26:665-675 Vijith H and Madhu G (2008) Estimating potential landslide sites of an upland sub-watershed in Western Ghat’s of Kerala (India) through frequency ratio and GIS. Environ Geol 55(7):1397-1405 Vijith H and Madhu G (2007) Application of GIS and frequency ratio model in mapping the potential surface failure sites in the Poonjar sub-watershed of Meenachil river in Western ghats of Kerala. Indian Soc Remote Sens, 35(3):275-285
J. Indian Soc. Remote Sens. (June 2010) 38 : 301– 320
Youssef AM, Pradhan B, Gaber AFD and Buchroithner, MF (2009). Geomorphological hazard analysis along the Egyptain red sea coast between Safaga and Quseir. Nat Hazard Earth Sys 9(9):751-766 Zadeh LA (1965) Fuzzy sets. Information and Control 8:338- 253 Zhou G. Esaki T. Mitani Y. Xie M and Mori J (2003) Spatial probabilistic modeling of slope failure using an integrated GIS Monte Carlo simulation approach. Eng Geol 68:373-386 Zhou CH, Lee CF, Li J and Xu ZW (2002) On the spatial relationship between landslides and causative factors on Lantau Island, Hong Kong. Geomorphology 43:197-207 Zimmerman HZ (1996) Fuzzy sets theory and its applications, Kluwer Academic Publishers, Dordrecht