Language Differences and Metadata Features on Twitter Emre Kıcıman Microsoft Research Redmond, WA USA
[email protected]
ABSTRACT In the past several years, microblogging services like Twitter and Facebook have become a popular method of communication, allowing users to disseminate and gather information to and from hundreds or thousands (or even millions) of people, often in real-time. As much of the content on microblogging services is publicly accessible, we have recently seen many secondary services being built atop them, including services that perform significant content analysis, such as real-time search engines and trend analysis services. With the eventual goal of building more accurate and less expensive models of microblog streams, this paper investigates the degree to which language variance is related to the metadata of microblog content. We hypothesize that if a strong relationship exists between metadata features and language then we will be able to use this metadata as a trivial classifier to match individual messages with specialized, more accurate language models. To investigate the validity of this hypothesis, we analyze a corpus of over 72M Twitter messages, building language models conditioned on a variety of available message metadata.
1.
INTRODUCTION
In the past several years, microblogging services like Twitter and Facebook have become a popular method of communication, allowing users to disseminate and gather information to and from hundreds or thousands (or even millions) of people, often in real-time. People use these microblogging services for a variety of purposes, from discussing news and opinions to chatting with friends and coordinating events. Users of these services span from individuals with a few friends to celebrities with millions of fans, and even corporations who are using these services to better communicate with their customers and reach out to their users. As much of the content on microblogging services is publicly accessible, we have recently seen many secondary services being built atop them, including services that perform significant content analysis, such as real-time search engines
Copyright is held by the author/owner(s). SIGIR 2010 WEB N-GRAM Workshop. July 23, 2010, Geneva, Switzerland.
and trend analysis services. Researchers have also begun to study microblog content to gain insight into user, group and community behaviors and communication patterns, as well personalization and information finding opportunities. While much of the academic research analyzing microblogging systems has focused on the social graph structures (e.g., studying information dissemination patterns or influence relationships), more recent work has begun to examine microblog textual content. As part of this trend, we are also beginning to see more use of statistical natural language processing techniques, such as n-gram models and latent variable topic models, applied to microblog content. With the eventual goal of building more accurate and less expensive models of microblog streams, this paper investigates the degree to which language variance is related to the metadata of microblog content. While microblog content itself is quite short (Twitter, for example, limits message lengths to 140 characters) there is rich metadata associated with every message, including author metadata such as the name, location, and social details of a user; and easily inferred content metadata such as whether the message is a forward, a reply, contains a web link, or whether other users or topics are explicitly referenced. We hypothesize that if a strong relationship exists between metadata features and language then we can use this metadata as a trivial classifier to match individual messages with specialized, more accurate language models. To investigate the relationship between metadata features and language, we collected a corpus of over 72M Twitter messages and their metadata, using 64.5M messages for training and reserving the rest for testing. For each metadata feature we studied, we divided the English portion of the corpus into subsets based on its feature value, and used each subset to learn an n-gram model. To quantify language differences, we measured the perplexities among these models, as well as to an n-gram model learned from the entire English portion of the corpus. In our results we see that some metadata is correlated with language style. For example, as might be expected, the coarse location of users (e.g., their timezone) seems to have a strong relation to their aggregate observed language. As another example, we see language differences in messages based on the number of people who follow (i.e., subscribe to) the author: authors with more than 1000 followers write most differently, whereas the authors with less than a 1000, less than 100 or less than 10 are more similar. In the rest of this paper, we describe our corpus and analysis techniques in more detail and then present the results
of our initial investigation. We conclude by discussing the implications of the work and possible future directions.
2.
RELATED WORK
Previous studies have presented detailed characterizations of the Twitter service, and identified distinct classes of users based on their messaging, social and other behaviors [3, 2, 4]. A few studies have studied content on Twitter through systematic analysis of messages [1, 5]. For example, Naaman et al. [5] use human coding of 3379 messages from 350 users to infer two primary classes of users: ”‘informers”’ who post messages that are primarily informational in nature (20% of users); and ”‘meformers”’ who post messages that relate to themselves and their thoughts (80% of users). The recognition of such distinct classes of users and messaging activities leads us to suspect distinct language styles are in use on Twitter. Following [9] that improves information retrieval of web documents through the use of multiple distinct language models for the different fields of a document (e.g., title, abstract, body), we have begun to study whether different classes of messages in Twitter may also be better modeled separately. Recently, studies have begun to apply statistical natural language processing techniques to microblog content. For example, Ramage et al. [6] use a form of Latent Dirichlet Allocation (LDA) to discover over 200 models of topic and style within a corpus of 8M twitter messages; and show how this can be used to provide personalized information consumption applications. Similarly, Ritter et al. [7] propose an approach to unsupervised modeling of conversations on Twitter, using LDA combined with a Hidden-Markov Modeling of dialog acts. We believe that such statistical modeling of message content will become an important tool in future research, as well as a foundation for information retrieval and other applications built atop microblogging services.
3.
Num Messages Num Tokens Unique 1-grams Unique 2-grams Unique 3-grams
OUR DATASET
We collect our corpus of microblogging content from the Twitter service. Twitter is a social media service that allows users to broadcast short text messages to their ”‘followers”’. These messages are limited to 140 characters each. Most of these messages are also made publicly visible for searching and discovery. Begun in October 2006, Twitter has grown rapidly, and current reports state that Twitter users are posting 50M messages per day [8]. For our study, we gathered a sample of over 72M messages from Twitter’s public stream, collected over the course of 3 days in May, 2010. We set aside a random 10% sample of these messages to use for testing. From the remaining 64M messages, we filtered for English content. We apply the rest of our analysis to these English messages. Table 1 shows basic statistics about the number of tokens, unique unigrams, bigrams and trigrams in our training dataset. Pre-processing of Twitter messages consists of lower-casing the message and performing word-breaking on white-space and all non-alphanumeric characters. Since most URLs are auto-generated, pseudo-random short URLs, we also replace all URLs with a special “” token. We do not canonicalize user names or topic tags, annotated by Twitter convention with the ‘@’ and ‘#’ tags, respectively.
All 64,565,242 772,369,630 34,150,462 – –
English 27,677,009 394,406,783 5,423,111 55,172,026 187,217,338
Table 1: Basic characteristics of our Twitter training data set
4.
ANALYSIS TECHNIQUE
For each metadata feature we studied, we divided the English portion of the corpus into subsets based on its feature value. For example, to study the relationship between geography and language, we divided our Twitter corpus into subsets based on the value of the message’s time zone feature (more details in the next session). For discrete valued features, such as time zone, we only analyzed subsets with a substantial number of messages, e.g., we analyzed the London time zone, but not the Midway Island time zone. For other features, such as the number of followers of a user, we chose to subset boundaries such that all subsets had substantial numbers of messages. Once we divided our corpus into subsets, we learned a separate n-gram language model for each subset. For each subset, we built a uni-gram, bi-gram and tri-gram language model, using a closed vocabulary based on the vocabulary of our entire training set of English messages. The language models are smoothed using Modified Kneser-Ney smoothing. For each feature we studied, we quantified language differences by measuring the perplexity of each of our learned n-gram models against each subset of data. As a further comparison point, we also measured the perplexity of a language model trained on the entire training set of English messages. It is important to note that our analysis only serves to identify correlations between individual features and language differences. In particular, our algorithm does not account for potential correlations among features themselves. However, as a first investigation, our analysis does provide a simple but scalable technique that can identify features that can be used as a trivial classifier. In our future work, we plan to investigate and compare additional analysis techniques, such as message clustering and applying mechanisms of latent variable topic models to at least a subsample of our corpus.
5.
RESULTS
In this section, we describe our results of investigating metadata features that relate to geography and number of followers of a user.
5.1
Geography and Language Style
As our first analysis, we present the correlation between geography and language style. Of course, it is natural to expect that geography have an impact on language style due to language dialects as well as geographic-specific topics, events, place names, etc. For our analysis, we use the user provided “timezone” as our geographic location indicator. The timezone is a convenient geographic feature for our use because, while the
Hawaii Alaska Pacific Mtn. Central Eastern Quito
Brasilia Greenld. London Jakarta Osaka Tokyo
Hawaii
1573
3078
3623 2795
3018
3294
3094
5591
4228
2027
6623
5051
3529
Alaska
3506
1500
3238 2641
2866
3182
2892 11005
6496
2907
6004 12610
6477
Pacific
2775
1894
1303 1825
2040
2222
2226 11676
6501
2493
2769 11591
5611
Mtn.
4619
4379
5263 1360
2362
2742
2824 13384
7465
2874 17897 13453
7023
Central
4941
4655
5969 1774
1185
2009
1838 13244
7368
2695 24610 14107
6740
Eastern
5586
5208
7244 2053
1943
1216
1767 15560
8475
2648 31850 14535
6953
Quito
5042
4689
6539 2324
2200
2241
1153
8234
6061
2810 26049 13806
7197
Brasilia
8063
8279 10229 5674
6230
6528
6666
724
5810
4909 28775 11331
7465
Greenld.
4437
4776
5966 3642
4006
4170
4030
1932
1536
2868 14817 11179
5962
London
5013
5573
7160 3478
4065
4115
4266 10621
6561
917 21472 15561
7342
Jakarta
5631
4896
5494 5298
5761
6200
6138 17000
9690
Osaka
8276
8086
9359 6599
6944
7340
7252 16236
10461
5444 19994
1598
4495
Tokyo
5682
5546
6589 4521
5006
5043
5222
6811
3635 13864
2386
1265
8904
4461
1338 12107
7407
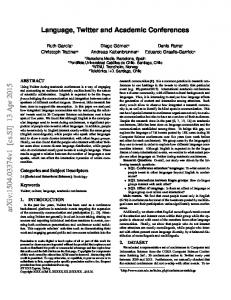
Figure 2: Perplexity of bi-gram models learned for each time zone (rows) with respect to test data from each time zone (columns)
Unstated Tokyo Pacific Central Eastern Brasilia Hawaii Jakarta Quito Santiago London Greenland Mountain Alaska Osaka Other
6,000,000 5,000,000 4,000,000 3,000,000 2,000,000 1,000,000 0
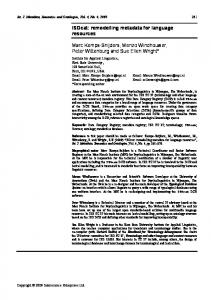
Figure 1: The number of messages collected from the top 13 timezones.
user chooses their own timezone, Twitter explicitly limits the users’ choices to 30 different time zones. We build models for the languages of the top 13 time zones, ranked by the number of English language messages collected in each time zone (Figure 1). In future work, we expect to utilize other geographic information also available in the Twitter metadata such as userspecified city, state, country information, or available GPS coordinates provides richer and more granular information, But, the use of user-specified location metadata requires the recognition and canonicalization of various names for locations (e.g., users refer to New York City as any one of ‘nyc’, “new york city”, “new york, ny”, “manhattan”, etc). The use of automated or semi-automated location annotation (such as with GPS) can help, but is not yet widespread. Figure 2 shows the perplexity of each language model with respect to each of the time zones. We see that the primarily English-speaking time zones (North America and London) use similar, though distinctive languages. The Quito time zone is also very similar to North America. In Table 2, we show a selection of the most frequently used words in each time zone, and their relative likelihood α in comparison to the global English language model, calculated simply as α = Ptimezone (token)/Pglobal (token). A qualitative inspection uncovers that the language differences among timezones seem to be due to several causes. First, the likelihood of location names is strongly associated with timezone. We see place names such as Denver, California, Miami, London, and Shibuya being much likely words in their respective time zones than globally. Secondly, we see variance in the probability of words associated with topics of a geographic nature. The topic “tweetmyjobs” is popular on the Eastern time zone, but not elsewhere, and is related to a company of the same name based in North Carolina. In the London time zone, we see that the topics ‘#bgt’ (Britain’s
Pacific Token #sfo #craig #forsale hella vegas california favorite
Mountain Token α denver 8.8 colorado 7.0 chicago 1.8 ugh 1.5 gon 1.5 bp 1.4 energy 1.4 favorite 1.3
α 5.9 2.6 5.5 3.2 2.6 2.0 1.2
Central Token α tx 2.8 chicago 2.6 texas 2.2 gon 2.0 naw 1.9 yall 1.9 favorite 1.3 #tcot 1.8
Eastern Token #tweetmyjob nyc dc miami ny boston smh favorite
α 5.3 2.4 2.2 2.2 2.0 1.7 1.7 1.2
London Token #bgt #eurovision cumbria manchester uk liverpool london favourite
α 8.7 7.5 7.2 6.4 6.0 5.6 5.4 3.6
Tokyo Token #fm802noa #twinglish shibuya #followmejp #youtube soichi #japan youtube
α 259.2 195.3 161.2 148.0 76.7 70.8 63.5 2.1
Table 2: This table shows a selection of time zones and the words that appear more frequently in them as compared to other time zones, together with each word’s likelihood ratio relative to the global English language model learned across all time zones.
kobe obama lol lool haha hahaha ha hahah
Alaska -3.9 (1.1) -4.1 (0.7) -2.3 (1.1) -4.7 (0.6) -2.7 (1.9) -3.1 (2.1) -3.5 (1.0) -3.8 (1.9)
Hawaii -4.2 (0.5) -4.1 (0.6) -2.5 (0.8) -4.0 (3.2) -2.8 (1.3) -3.4 (1.2) -3.5 (1.1) -3.9 (1.4)
Pacific -3.9 (1.3) -4.0 (0.9) -2.3 (1.1) -4.9 (0.3) -2.8 (1.3) -3.3 (1.4) -3.5 (1.1) -3.9 (1.5)
Mountain -3.8 (1.1) -3.8 (1.4) -2.3 (1.2) -5.1 (0.3) -3.0 (1.0) -3.6 (0.8) -3.5 (1.3) -4.1 (1.0)
Central -3.7 (1.5) -3.8 (1.2) -2.3 (1.4) -4.9 (0.3) -3.0 (0.8) -3.6 (0.7) -3.5 (1.1) -4.2 (0.7)
Eastern -3.7 (1.6) -3.8 (1.4) -2.3 (1.3) -5.0 (0.3) -3.2 (0.6) -3.7 (0.6) -3.6 (0.8) -4.4 (0.5)
London -5.1 (0.1) -4.4 (0.3) -2.6 (0.7) -3.8 (5.3) -2.9 (1.0) -3.7 (1.0) -3.4 (1.4) -4.2 (0.7)
Global -3.9 -3.9 -2.4 -4.5 -2.9 -3.4 -3.6 -4.1
Table 3: This table shows the log-probabilities and relative likelihoods of selected words in the language models built upon different time zones.
Got Talent) and ‘#eurovision’ are mentioned much more frequently than in the global language model. Other examples include the ‘#craig’ (Craigslist) topic in the Pacific time zone, and the ‘#fm802noa’ topic in Japan. Finally, we see dialect variance, such as the spelling variations (“favourite” vs. “favorite”), and colloquialisms such as the use of ‘gon’ instead of ‘going to’. In Table ??, we drill into the topic variance across time zones by inspecting the relative popularity of two topic words, ‘obama’ referring to Barack Obama, and ‘kobe’ referring to Kobe Bryant, a basketball player. As might be expected, we see that both are more popular within the United States’ time zones than in the London or Tokyo time zones. In this table, we also highlight dialect variance by showing the logprobabilities and relative likelihoods ‘lol’ (“laugh out load”) and ‘haha’ (laughter) and their popular variants. Despite ease of global communication in Twitter, we see a strong correlation between such colloquial usage and geography as represented by time zone. While it is clear from these results that geographic location and language are correlated, it remains for future work to investigate the most appropriate granularity and representation of location for the purposes of language modeling. While we used time zone in our analysis because of its clarity and convenience (i.e., we do not need inferrance or canonicalization machinery atop time zone metadata as we do for user-specified location information), other location information is also included in Twitter metadata and provides an opportunity to further investigate this question.
5.2
User features
Our next analysis is of a user-specific feature, the number