This paper is the product of a joint research project, carried out by PRAESA and Babylon, Centre for Studies of the Multicultural Society at Tilburg University (the Netherlands). It reports on a language survey conducted amongst primary school children in the Greater Cape Town as well as in the rural/town areas of the Western Cape province between 1999 and 2002. The focus is on language policy in schools in relation to language vitality indicators such as language repertoire, choice, proficiency, dominance and preference. The findings show the dominance of English in the metropolis and its growing influence in the traditionally Afrikaans-dominant rural areas. There is also considerable interest in isiXhosa, both from speakers of isiXhosa themselves and from Afrikaans- and English-speakers. The outcomes of the survey stand to inform existing databases on language statistics in education with a view to informing language policy and practice. In this way, language surveys in multilingual societies provide information crucial to informed language planning.
UNIVERSITY OF CAPE TOWN
Language policy implementation and language vitality in Western Cape primary schools Peter Plüddemann, Daryl Braam, Peter Broeder, Guus Extra, Michellé October
PRAESA Occasional Papers No. 15
u
u
Acknowledgements This publication would not have been possible without the support of many people. We would like to acknowledge especially Zola Wababa (PRAESA) and Xola Mati (formerly of PRAESA) both of whom contributed to the conceptualisation, fieldwork and some of the initial reports on which this paper is partially based. Tim van der Avoird, for help with the questionnaire design and data capture in Tilburg. Portia Sanqela for help with data capture in Cape Town Pam Maseko and Xolisa Guzula, for the Xhosa translation of the Summary. The Western Cape Education Department (Educational Research division) for EMIS data, and for permission to access the schools for purposes of data collection. The Western Cape Language Committee, for an initial grant. Babylon, Center for Studies of the Multicultural Society, University of Tilburg (Netherlands), and the Royal Netherlands Embassy to South Africa (Pretoria), a longstanding donor to PRAESA, for co-funding this paper.
PRAESA’s series of occasional papers is meant to provide an opportunity for the research done by staff members and associated researchers working in the domain of language policy in education to obtain initial exposure to an interested peer audience. It is hoped that feedback will improve the final version in which this research is eventually published or distributed.
u
DTP conversion: Andy Thesen Printing: Salty Print
Daryl Braam is a former primary school teacher who currently conducts research into aspects of school language policy and its role in whole school development. Other research interests include surveys and language mapping. E-mail:
[email protected] Peter Broeder teaches at University of Tilburg (Netherlands) and is interested in unraveling processes of intercultural communication. His current focus is on the role of self-regulation in life-long learning and its implementation in educational practice. E-mail:
[email protected] Guus Extra is professor of Language and Minorities, and director of Babylon, Center for Studies of the Multicultural Society, at Tilburg University (the Netherlands). He has taught and published widely on issues of multilingualism and migration, and has been involved in collaborative language surveys across Europe and in South Africa. E-mail:
[email protected] Michellé October completed her Masters dissertation on ‘Medium of instruction and its effect on matriculation examination results for 2000, in Western Cape secondary schools’. She currently has an active research interest in surveys and language mapping. E-mail:
[email protected] Peter Plüddemann teaches and does research on bilingual education, with a focus on teacher trainer development in the Southern Africa region. Other interests include surveys and language mapping, and intercultural communication. E-mail:
[email protected]
u
u
u Published by PRAESA (Project for the Study of Alternative Education in South Africa) University of Cape Town Private Bag Rondebosch 7701 Cape Town, South Africa Tel: (021) 650-4013 Fax: (021) 650-3027 Email:
[email protected] Website: http://www.uct.ac.za/depts/praesa/ ISBN: 1-919948-21-X Copyright © 2004, individual authors and PRAESA
u
Language policy implementation and language vitality in Western Cape primary schools
Peter Plüddemann, Daryl Braam, Peter Broeder, Guus Extra, Michellé October
Contents Abbreviations ........................................................................... 5 Opsomming .............................................................................. 6 Isishwankathelo ........................................................................ 8 Summary ............................................................................. 10 Chapter 1: Status and distribution of languages in South Africa, with particular reference to the Western Cape ............................ 13 1.1 The constitutional and policy context .............................. 13 1.2 Multilingualism in rhetoric and practice ........................... 20 1.3 Census data and language mapping: the Western Cape ..... 26 Our sincere thanks go to the following institutions and individuals: The learners, teachers, and principals of the following primary schools (in alphabetical order): Academia, Battswood, Bay, Bellville Moravian, Bissetsdrift, Bloekombos, Bongolethu, Bontebok, Brackenfell, Brandwacht EK, Bredasdorp, Danie Ackerman, De Tuinen, Dennemere, Die Eike VGK, Dryden Street, Eden, Eisleben, Erica, Esselenpark, Fairview, Floreat, Friemersheim, George-Suid, Gericke, Glen Elgin Moravian, Goeie Hoop, Groote Schuur, Grove, Heathfield, Heideveld, Hexpark, Hibernia VGK, Hillwood, HM Dlikidla, Holy Cross, Hopolang, Huguenoot VGK, Idas Valley, Iketlo, Ikhaya, Imbasa, Injongo, Isiphiwo, Jan Bosman, JD Crawford, Jurie Hayes, Keisie VGK, Klipdale EK, Knysna, Le Chasseur VGK, Macassar, Mandalay, Masakhekhe Combined, Mbekweni, Milkwood, Montagu, Monte Video, Monte Vista, Morrisdale, Mosselbaai EK (All Saints), Mullersrus, Mzoxolo, Naphakade, Nduli, Niko Brummer, Norma Road, Observatory Junior, Oranjekloof Moravian, Orchard, OudtshoornNoord, Ouplaas EK, Outeniqua, Overberg, Panorama, Paulus Joubert, Pinehurst, Pinelands, PJB Cona, R.R. Franks, Rhenish, Robertson, Rocklands, Rosmead, Saldanha, Saturnus, Sedgefield/Smutsville, Silverlea, Silversands, Sir Lowry’s Pass, Siyafuneka, Somerset West, Sonwabo, Sophakhama, St Idas RC, St. Augustines, St. Matthews, St. Michael’s, Steenvliet, Stellenbosch, Stratford, Surrey, Swellendam, Table View, Teske Gedenk, Thembaletu, Thembani, Thembelitsha, Thornton, TM Ndanda, Touwsrivier, Tuscany Glen, Ukhanyo, Vergesig, Victoriapark, Volschenk, Vooruitsig, Voorwaarts, Vredenburg, Vuselela, Vuyani, WA Rossouw, Walmer, Westville, Wolraad Woltemade, Worcester, Worcester-Noord, Worcester-Oos, York Road.
1.4 Language in education surveys in the Western Cape ......... 31 Chapter 2: Research design ...................................................... 36 2.1 Introduction ............................................................... 36 2.2 Language vitality indicators ........................................... 37 2.3 Research aims and hypotheses ..................................... 40 2.4 Research instruments .................................................. 42 2.5 Sampling, data collection and processing ........................ 44 Chapter 3: Findings from the urban (Greater Cape Town) survey .... 47 3.1 Language at home ...................................................... 48 3.2 Language at school ..................................................... 61 3.3 Urban home-language groups in comparison (overview) ...... 67 3.4 Urban ex-department groups in comparison (overview) ....... 71 Chapter 4: Findings from the rural/town survey ........................... 76 4.1 Language at home ...................................................... 76 4.2 Language at school ..................................................... 83 4.3: Rural/town home-language groups in comparison (overview) ... 86 4.4 Rural/town ex-department groups in comparison (overview) 88 4.5 Rural/town EMDC groups in comparison (overview) ........... 90
Chapter 5: Discussion and recommendations .............................. 93 5.1 New (draft) primary schools language policy in the Western Cape ...................................................... 93 5.2 Summary of findings .................................................... 95 5.3 Recommendations ...................................................... 99 References ........................................................................... 102 Endnotes ........................................................................... 107 Appendices .......................................................................... 109 1. English version of the children’s questionnaire ..................... 110 2. Afrikaans version of the children’s questionnaire .................. 112 3. IsiXhosa version of the children’s questionnaire .................. 114 4. Urban vs. rural/town children: Comparative overview of main findings ............................................................. 116
4
PRAESA – Occasional Papers No. 15
Abbreviations BRO CCT ex-CED ex-DET DoE EMDC EMIS HL ex-HoR LANGTAG LiEP LoA LoLT LoT LPPS NCCRD oth PanSALB PRAESA SBA SCK SDU SGB VOC WCED WCW
Breede River/Overberg (EMDC) City of Cape Town Former Cape Education Department Department of Education and Training Department of Education Education Management Development Centre Education Management Information System Home language Former House of Representatives Language Plan Task Group Language in Education Policy Language of assessment Language of learning and teaching Language of teaching Language Policy for Primary Schools (in the Western Cape) National Centre for Curriculum Research and Development Other Pan South African Language Board Project for the Study of Alternative Education in South Africa Stigting vir Bemagtiging deur Afrikaans Southern Cape/Karoo (EMDC) Schools Development Unit School governing body Vereenigde Oostindische Compagnie Western Cape Education Department West Coast/Winelands (EMDC)
Language policy implementation and language vitality in Western Cape primary schools
5
Opsomming In ’n veeltalige samelewing wat besig is om te transformeer het opnames toegespits op taalkwessies ’n belangrike rol om te speel. Verskeie beleidsdokumente verplig die Suid-Afrikaanse staat, insluitende die Departement van Onderwys, om veeltaligheid te bevorder. Die suksesvolle verwesenliking en monitor van hierdie beleidstukke sal onder andere afhang van ’n databasis toegelig deur gefokusde taalopnames. In hierdie dokument berig ons oor ’n taalopname wat onder Graad 1 en Graad 7 leerders in primêre skole in die Weskaap wat vanaf 1999–2002 gedoen is. Die hoofdoelstelling van die opname was om die status van tale wat in primêre skole in die Weskaap gebruik word, te bepaal, ten einde taalbeplanning te verbeter en taalbewussyn onder onderwysers, leerders, beamptes van die onderwysdepartement sowel as skoolbeheerliggaamslede aan te wakker. Vir die datainsameling is ’n drietalige, gestandaardiseerde vraelys gebruik. Die hoofstukke oor die opname self word voorafgegaan deur ’n hoofstuk oor die status en verspreiding van tale in Suid-Afrika, met spesifieke verwysing na die Weskaap. Ons kyk na die potensiaal sowel as die beperkinge van bestaande sensus-inligting en geografiese taalkaarte. Die teoretiese raamwerk vir die empiriese bevindinge wat hier uiteengesit is, is die sosiologie van taal. Sleutelbegrippe sluit in taalvitaliteit en die hegemonie van taal. Die bevindinge toon dat Engels al hoe meer dominant blyk te wees in die Kaapstadse metropolitaanse gebied, en dat Engels ook in die tradisioneel Afrikaans-dominante platteland aan invloed toeneem. In die stedelike gebiede (Kaapstad en omgewing) is respondente van die opname meestal Engels- georiënteerd. Afrikaans bly die mees-gesproke huistaal in die dorpe en landelike gebiede, alhoewel selfs hier die invloed van Engels bespeur kan word. Daar is ’n hoë mate van tweetalige (Afrikaans en Engels) huisgesinne in die stedelike gebiede, en minder in die dorpe en landelike gebiede. Xhosasprekendes kom oor die algemeen van eentalige huissituasies. Maar die belangrikste bevinding is die begin van ’n moontlike taalverskuiwing van Afrikaans na Engels in die private sfeer van die gesin, sowel as in die openbare sfeer van die skole. Houdings jeens isiXhosa onder Afrikaans- en Engelssprekendes blyk teenstrydig te wees. Aan die een kant is daar heelwat antipatie teenoor isiXhosa; aan die ander, ’n bereidwilligheid om die taal te leer. Xhosasprekendes verkies oor die algemeen isiXhosa as leer-, onderrig- en asseseringstaal, en nie uitsluitlik Engels soos wat huidiglik in die skole die geval is nie. Die hoofaanbeveling is dat die Weskaapse Onderwysdepartement ondersteun en, waar nodig, gedruk moet word om die ontwerpsdokument oor ’n nuwe talebeleid in die primêre skole, van November 2002, te aanvaar. Die aanname en befondsing van die beleid sou dit moontlik maak
6
PRAESA – Occasional Papers No. 15
om die meeste van die kwessies wat in hierdie studie geïdentifiseer word, aan te spreek. Daarbenewens word die volgende aanbeveel: 1. Raadpleeg die leerders. Om die leerders self te raadpleeg oor taalgebruik en houdings jeens taalgebruik word duidelik geïmpliseer in die demokratiese impuls wat die nuwe skooltalebeleid ten gronde lê. 2. Dink provinsiaal, handel plaaslik. Die taalbeleid behoort rekening te hou met dinamieka op plaaslike sowel as distriksvlak, sonder om afstand te doen van die visie om veeltaligheid binne ’n amptelik drietalige provinsie te bevorder. Die skeidings wat in hierdie berig geïdentifiseer is, sluit in dié tussen stedelik en landelik, dié tussen die voormalige exdepartemente van onderwys, en dié tussen die verskeie huistaalgroepe. 3. Versterk die implementeringsakteurs. Skole behoort ondersteun te word in die formulering van ’n toepaslike skooltalebeleid wat die belange van alle taalgroepe dien. Belangegroepe wat in dié proses betrek en bemagtig moet word sluit in skoolbeheerliggaame, strategiese bestuursspanne, en die forums vir skoolhoofde. 4. Hou databasisse op datum. Daar is ’n dringende behoefde daaraan dat databasisse m.b.t. taal in die onderwys aangepas moet word om met die werklikheid van twee- en veeltalige huissituasies tred te hou. 5. Ondersoek taalverskuiwing. Meer navorsing word benodig om vas te stel tot hoe ’n mate daar tans ’n taalverskuiwing vanaf Afrikaans na Engels in die metropolitaanse gebied plaasvind, soos in hierdie studie uiteengesit.
Language policy implementation and language vitality in Western Cape primary schools
7
Isishwankathelo Uvavanyo-zimvo olugqaliseleyo lokusetyenziswa kweelwimi lunendima ebalulekileyo ekufanele luyidlale, ingakumbi kwiindawo zoluntu ezineelwimi ezininzi nekuqhubeka inguqu kuzo.Imigaqo-nkqubo emininzi ibophelela urhulumente woMzantsi Afrika, oku kubandakanya neSebe lezeMfundo, ukuba lukhuthaze ukusetyenziswa kweelwimi ngeelwimi zeli lizwe. Ukuphunyezwa kwale migaqo-nkqubo, nokuhlolwa kokusebenza kwayo kuya kuxhomekeka, phakathi kwezinye izinto, kuphando olusekelezelwe kuvavanyo-zimvo olugqaliseleyo lokusetyenziswa kweelwimi. Olu xwebhu lunika ingxelo ngovavanyo-zimvo lokusetyenziswa kweelwimi kwizikolo zamabanga aphantsi eNtshona Koloni, nolwathi lwaqhutywa kubafundi beBanga 1 nabeBanga 2 kwisithuba sika-1999–2002. Injongo yolu vavanyo-zimvo, ngokubanzi, yayikukuqonda isimo seelwimi ezisetyenziswayo kwizikolo zamabanga aphantsi eNtshona Koloni ngenjongo yokuphakamisa ucwangciso lokusetyenziswa kweelwimi, nokuqaqambisa ulwazi ngolwimi okanye ngentetho phakathi kootitshala, abafundi, amagosa esebe lezemfundo namalungu ombutho olawulayo ezikolweni. Xa kwakuqokelelwa iinkcukacha zolwazi ezifunekayo kwaye kwasetyenziswa iphepha-mibuzo eliqingqiweyo, nelalingeelwimi ezintathu. Izahluko malunga nenqobo yovavanyo zimvo zandulelwa sisahluko esijonga isimo kwakunye nokusasazeka kweelimi eMzantsi Afrika, ngakumbi ngokubhekisele eNtshona Koloni. Sijonga izinto ezinokuphunyezwa ziinkcukacha zamanani kwakunye neenkcukacha ezibonisiweyo emephini, kwakunye nalapho zisilela khona ezi nkcukacha. Isicwangciso sethiyori esisetyenzisiweyo ukubonisa iziphumo zophando ngokwamava nangembali yi sociology of language – izifundo zenzululwazi ngolwimi nangokunxulumene noluntu. Izinto eziphambili nolusekelwe phansti kwazo olu phando singabandakanya kuzo i language vitality – ukubaluleka kolwimi kunye nokongamela kolwimi. Iziphumo zolu phando zibonisa ukuba isiNgesi siye sivelela ngaphaya kwezinye iilwimi kwisithili saseKapa, kwaye siyaqalisa nokungenelela kwiindawo ezisemaphandleni nebekusoloko kuvelele isiBhulu kuzo. Kuvavanyo-zimvo olwenziwe ezindaweni ezisedolophini (imimandla yesithili saseKapa) abantu abaphenduleyo bebekekelela ngasesiNgesini. IsiBhulu sisaqhuba sisiso esithethwayo ikakhulu emakhayeni abantu abasezidolophini ezingaphandle kwesixeko nabasemaphandleni, nangona nalapha amandla esiNgesi evakala. Sifumanise ukuba ezindaweni ezisezidolophini zininzi izehlo apho emakhayeni kuthethwa ngokupheleleyo iilwimi ezimbini ezisisiBhulu nesiNgesi, kodwa zibe mbalwa kwiidolophana ezingaphandle nasemaphandleni; abantu abantetho isisiXhosa ikakhulu bavela kumakhaya apho kuthethwa isiXhosa kuphela. Mhlawumbi ezona ziphumo zibalulekileyo kolu phando ingabubukho beziqalo ezibonisa inguqu ekekelele esiNgesini xa kujongwa bucala kumakhaya abantu, naxa kubhekiswa kwicandelo
8
PRAESA – Occasional Papers No. 15
likawonke-wonke elisisikolo. Indlela abasijonga ngayo isiXhosa abantu abathetha isiBhulu nesiNgesi iyabetha-bethana. Iziphumo zibonisa intiyo engaphaya yesiXhosa, ziphinde zibonise nokufuna ukusifunda. Abantetho isisiXhosa babonisa ukuba bakhetha ukufunda, ukufundiswa nokuvavanywa ngesiXhosa, kwakunye nesiNgesi ecaleni kwesiXhosa kwezinye iimeko. Thina ingcebiso yethu ephambili yeyokuba urhulumente wentshona Koloni kufuneka axhaswe kwaye, apho kuyimfuneko, afakwe ekoneni ukuba amkele uyilo loMgaqo-nkqubo weeLwimi ezikolweni zamabanga aphantsi eNtshona Koloni. Ukwamkelwa nokufakwa kwemali ukwenzela ukusebenza kwalo mgaqo-nkqubo kuya kwenza ukuba uninzi kwemiba ephakanyisiweyo kolu phando lukhangelwe. Ngaphezu koko, kuvela nezi ngcebiso zilandelayo: 1. Makubandakanywe izimvo zabantwana . Ukubuza abantwana ngqo ngendlela abazisebenzisa nabazibona ngayo iilwimi kuqukiwe kwimo eqhubela phambili idemokhrasi nosekelwe phantsi kwayo umgaqonkqubo weelwimi ezikolweni. 2. Makucingwe ngokwephondo, kodwa kwenziwe izinto ngokweengingqi . Umgaqo-nkqubo weelwimi kufuneka uthathele ingqwalasela izinto ezigqubayo kwinqanaba lesithili nelengingqi, kodwa ungawulahli umbono wephondo “wokuvelisa” abemi abathetha iilwimi ngeelwimi kwiphondo elisebenza, ngokwasebugoseni, ngeelwimi ezintathu. Iyantlukwano eboniweyo kule ngxelo ibandakanya leyo iphakathi kwedolophu namaphandle, phakathi kwamasebe emfundo ebeya kuba ngakarhulumente kwimo yocalu-calulo ngaphambili, nakwiilwimi ezisetyenziswa ekhaya. 3. Makonelelwe imibutho nee-arhente emazifezekise lo mgaqo-nkqubo. Izikolo kufuneka zinikwe inkxaso xa zivakalisa ngokucacileyo umgaqo-nkqubo welwimi wesikolo, umgaqo-nkqubo ojonge ukwanelisa onke amaqela aneelwimi ngeelwimi. Amaqela achaphazelekayo nekufanele ukuba abandakanywe kwaye axhotyiswe kule nkqubo yimibutho elawulayo ezikolweni, amaqela abaphathi ajongene nezicwangciso-nkqubo, neeforam zeenqununu. 4. Makuhlaziywe uphando oluneenkcukacha zamanani . Kukho isidingo esingxamisekileyo sokuba oovimba beenkcukacha bezemfundo bahlaziywe ukuze babonise ngokuyinene ubunyani beemeko zasemakhayeni apho kusetyenziswa iilwimi ezimbini nangaphezulu. 5. Uphando kutshintso losekutyenziswa kweelwimi . Kufuneka kwenziwe olunye uphando ukuqinisekisa ubunzulu botshintsho lokusetyenziswa kolwimi ukusuka kwisiBhulu ukuya kwisiNgesi kwiindawo ezisedolophini okanye esixekweni, njengokuba kubonwe njalo kolu phando.
Language policy implementation and language vitality in Western Cape primary schools
9
Summary Focused language surveys have an important role to play, particularly in a multilingual society undergoing transformation. Various policies commit the South African state, including the Department of Education, to promoting multilingualism. The successful realisation and monitoring of these policies will depend on, amongst other things, a database that is informed by focused language surveys. This document reports on a language survey of primary schools in the Western Cape that was conducted amongst Grade 1 and Grade 7 learners during 1999–2002. The overall aim of the survey was to establish the status of languages used at primary school level in the Western Cape with a view to enhancing language planning and raising language awareness among teachers, learners, education department officials and governing body members. For data collection a standardised questionnaire in three languages was used. The chapters on the survey itself are preceded by a chapter on the status and distribution of languages in South Africa, with particular reference to the Western Cape. We look at the potential as well as the limitations of existing census data and mapping. The theoretical frame in which the empirical findings presented here are viewed is the sociology of language. Key informing concepts include those of language vitality and linguistic hegemony. The findings show that English is becoming increasingly dominant in the Cape Town metropolis, and is also beginning to make inroads into the traditionally Afrikaans-dominant platteland. In the urban (Greater Cape Town) survey respondents were mainly English-oriented. Afrikaans continues to be the most widely spoken home language in the towns and rural areas, although even here the power of English is being felt. We found a high incidence of Afrikaans-English bilingual homes in the urban areas, and fewer in the towns and rural areas; Xhosa-speakers tend to come from largely unilingual homes. Perhaps the most significant finding is the possible existence of the beginnings of a language shift to English in the private sphere of the family, as well as in the public sphere of schooling. Attitudes towards isiXhosa amongst Afrikaans- and English-speakers are contradictory. Results indicate the existence of both considerable antipathy towards isiXhosa, as well as the willingness to learn it. Xhosa-speakers tend to prefer isiXhosa as LoLT and for assessment, alongside English in some cases. Our main recommendation is that the Western Cape government be supported and, where necessary, pressurised to adopt the new (draft) Language Policy for Primary Schools in the Western Cape. The adoption and resourcing of the policy would enable most of the issues identified in this study to be addressed. In addition, the following recommendations arise:
10
PRAESA – Occasional Papers No. 15
1. Include children’s views. Asking the children themselves about language use and attitudes towards use is clearly implied by the democratic impulse underlying school language policy. 2. Think provincially, act locally. Language policy should take district-level and local particularities into account without losing the provincial vision of ‘producing’ multilingual citizens in an officially trilingual province. The divides identified in this report include those along the urban-rural axis, the ex-department axis, and the home-language axis. 3. Strengthen implementation agents. Schools should be supported in the formulation of appropriate school language policies that serve the interests of all language groups. Stakeholder groups that need to be involved and empowered in the process include school governing bodies, strategic management teams, and principals’ forums. 4. Update databases. There is an immediate need for educational databases to be amended to capture the reality of bilingual and multilingual home environments. 5. Research on language shift. More research is required to confirm the extent of the apparent language shift from Afrikaans to English in the metropolis, as identified in this study.
Language policy implementation and language vitality in Western Cape primary schools
11
Chapter 1 Status and distribution of languages in South Africa, with particular reference to the Western Cape This chapter goes into the status and distribution of languages in South Africa, with a focus on the Western Cape province. Section 1.1 provides an overview of the new constitutional and policy context of multilingualism in South Africa since the end of apartheid. Section 1.2 examines the continuities and discontinuities between the rhetoric and the practice of multilingualism. Most of the information presented in these two sections is derived and updated from Broeder et al. (2002) and Maartens (1998). Section 1.3 looks in more detail at census language statistics from the Western Cape, while section 1.4 examines some findings of recent educational language surveys conducted in the province.
1.1 The constitutional and policy context South Africa provides a complex and intriguing picture of multilingualism, due to its broad spectrum of both indigenous and non-indigenous languages and to its politically burdened history of apartheid. During the years of apartheid (1948-1994), English and Afrikaans were the only two languages with an officially recognized nation-wide status, despite the wide variety of other languages learnt and spoken in South Africa. Apart from Afrikaans, English and other languages of European origin, two major groups of languages should be mentioned here, i.e., • so-called Bantu languages, in particular (isi)Zulu, (isi)Xhosa, (si)Swati, (isi)Ndebele, (Se)Sotho, (Se)Tswana, (xi)Tsonga, (tshi)Venda and (Se)pedi; • Indian languages, in particular Hindi, Gujarati, Tamil, Urdu and Telegu. While so-called Bantu languages have their roots in Southern Africa, European and Indian languages originate from abroad, having come into South Africa largely since the 17th and 19th centuries respectively. For a historical and sociolinguistic discussion of the spectrum of languages in South Africa, we refer to Webb (2002), Extra & Maartens (1998), and Mesthrie (1995a). The years after 1990 represent a period of transition and political negotiation in South Africa at the time apartheid came to an end after a period of almost half a century (see Hartshorne 1995 and Webb 1995, 2002). Various matters had to be debated, among others: the political and constitutional rights of the African languages as opposed to Afrikaans and English; the need for a lingua franca; the choice of the languages to
12
PRAESA – Occasional Papers No. 15
Language policy implementation and language vitality in Western Cape primary schools
13
be used as medium of instruction and as subjects at school; and the role of English as a linking language. The ANC position on these and related issues were spelt-out in documents such as the Freedom Charter, the Constitutional Guidelines and the Proceedings of the ANC Language Workshop, which had been held in Harare. Heugh (1995:340) states that all these documents seem to reflect the dilemma of most of Africa since the 1960s: on the one hand the reality of language needs (such as the need for a ‘language of national unity’) that are met by English, and on the other hand, the need to free the majority of inhabitants from the languages that were part of earlier imperialist political systems by developing the African languages. The latter need, in particular, has been stressed by organisations such as the National Language Project. The major contribution from the non-governmental education sector, came from the National Education Policy Investigation (NEPI) committee in 1992. It spelt out the language options and their implications without choosing a specific ‘solution’. Heugh (1995:340) points out that both the ANC and NEPI have taken a laissez-faire position: making a policy-decision but ignoring the necessity of formulating attendant planning strategies through which to implement the policy-decision. Such a mismatch between goal and strategy is already leading to the potential subversion of an essentially integrationist policy by assimilationist pressure from English as the language of dominance. The Nationalist government position in the period before the installation of a democratic government was not clear, except that there was considerable concern about maintaining the position of Afrikaans. In November 1991, from government education circles came the voice of the Curriculum Model for Education in South Africa (CUMSA) which proposed that in general not more than two languages should be compulsory, one of which should be the medium of instruction. CUMSA specifically recommended that only one should be compulsory in Grades 1–2, but that in Grades 5–7, English or Afrikaans and the regionally prevalent African language should be compulsory. The Department of Education, on the other hand, wanted the parents in primary schools to choose from among the options broadly outlined in the De Lange Report (1981) (see Section 1.5). In 1994, the so-called ‘Government of National Unity’ (the first-ever democratically elected South African government) came into power. The 1993 Interim Constitution contained the following language clauses (Clause 3): 1. Afrikaans, English, isiNdebele, SeSotho sa Leboa, SeSotho, siSwati, Xitsonga, Setswana, Tshivenda, isiXhosa and isiZulu shall be the official South African languages at national level, and conditions shall be created for their development and for the promotion of their equal use and enjoyment.
2. Rights relating to language and the status of languages existing at the commencement of this Constitution shall not be diminished, and provision shall be made by an Act of Parliament for rights relating to language and the status of languages existing only at regional level, to be extended nationally. These two clauses are of course contradictory in practice and cannot be implemented simultaneously. It is, therefore, not surprising that the second clause was not included in the final Constitution. On 8 May 1996, the Constitutional Assembly of the post-apartheid Republic of South Africa adopted a new Constitution, which provides in Clause 6 for no less than eleven official languages in the context of an ambitious language policy: 1. The official languages of the Republic are Sepedi, Sesotho, Setswana, siSwati, Tshivenda, Xitsonga, Afrikaans, English, isiNdebele, isiXhosa and isiZulu. 2. Recognising the historically diminished use and status of the indigenous languages of our people, the state must take practical and positive measures to elevate the status and advance the use of these languages. 3a. The national government and provincial governments may use any particular official languages for the purposes of government, taking into account usage, practicality, expense, regional circumstances and the balance of the needs and preferences of the population as a whole or in the province concerned; but the national government and each provincial government must use at least two official languages. 3b. Municipalities must take into account the language usage and preferences of their residents. 4. The national government and provincial governments, by legislative and other measures, must regulate and monitor their use of official languages. Without detracting from the provisions of subsection (2), all official languages must enjoy parity of esteem and must be treated equitably. 5a. A Pan South Africa Language Board established by national legislation must promote and create conditions for the development and use of: i) all official languages; ii) the Khoi, Nama and San languages; and iii) sign language; and 5b. promote and ensure respect for: i) all languages commonly used by communities in South Africa, including German, Greek, Gujarati, Hindi, Portuguese, Tamil, Telegu and Urdu; and
14
Language policy implementation and language vitality in Western Cape primary schools
PRAESA – Occasional Papers No. 15
15
ii) Arabic, Hebrew, Sanskrit and other languages used for religious purposes in South Africa. It is important to note that the term ‘official language’ in the 1996 Constitution has a completely different meaning from its use in the previous 1961 Constitution. Steyn (1992:206) cites a range of interpretations of the meaning of the term ‘official status’ as it is applied to language. Fasold (1984:74), for example, considers that a true official language fulfils all or some of the following functions: • as language of communication for government officials in carrying out their duties at national level; • as written communication between and internal to government agencies at national level; • for the keeping of government records at national level; • for the original formulation of laws and regulations that concern the nation as a whole; • for forms such as tax forms. Fishman (1971:288) mentions the same functions, but adds to these the use of the language in the schools and courts of the country. The official languages Afrikaans and English of the 1961 Constitution met all the above criteria. Of the eleven languages listed as official in the 1996 Constitution, however, only English meets these criteria at present. Central government spelled out its position on language in education in the 1996 South African Bill of Rights, Clause 29: Everyone has the right to receive education in the official language or languages of their choice in public educational institutions where that education is reasonably practicable. In order to ensure the effective access to, and implementation of this right, the state must consider all reasonable educational alternatives, including single medium institutions, taking into account: a. equity; b. practicability; and c. the need to redress the results of past racially discriminatory law and practice. In the Department of Education documentation, specifically the Language-in-Education Policy (henceforth LiEP) (DoE 1997), the emphasis is on developing multilingualism within a framework of additive bi/ multilingualism. The LiEP consciously sees itself “as part of a continuous process by which policy for language in education is being developed as part of a national language plan encompassing all sectors of society, including the deaf community”. Its orientation is towards valuing cultural and
16
PRAESA – Occasional Papers No. 15
linguistic diversity as well as nation-building through the promotion of multilingualism (“being multilingual should be a defining characteristic of being South African”). With regard to the curriculum the LiEP supports an additive approach to bilingualism in which “the underlying principle is to maintain home language(s) while providing access to and the effective acquisition of additional language(s)”. The distribution of languages across the curriculum is not prescribed in detail; the LiEP merely stipulates that “the language(s) of learning and teaching [LoLT] in a public school must be (an) official language(s)”. Furthermore, the right to choose the LoLT is vested in the individual parent or guardian, a right that falls within “the overall framework of the obligation on the education system to promote multilingualism”. This individual right is, however, subject to certain practicability clauses, and should be read together with the duty of the school governing body to “stipulate how the school will promote multilingualism”. Concerning language subjects, minimally two languages have to be offered (taken) from Grade 3 on up, among them the LoLT(s), although it is only in the last three school years (Grades 10– 12) that both have to be passed as a condition for promotion and certification. The LiEP has been greeted with relief by language practitioners in the years since 1997, as its overt endorsement of multilingualism and of the African languages in particular signals a paradigmatic break with the official bilingualism of apartheid. Within this overall ground swell of support the policy has, however, also been criticised for a number of shortcomings, including, amongst others, – the non-articulation with the national curriculum policy development process (Curriculum 2005) that occurred in the same period, resulting in discursive as well as substantive discontinuities (cf. Du Toit et al. 1997) – weaknesses within the LiEP document itself, notably its voluntarist or non-prescriptive position concerning the curricular use of African languages, as well as some inconsistencies in the use of key terms (Granville et al. 1997, Desai 1999, NCCRD 2000) – its supposedly Eurocentric notion of adding on (notionally distinct or discreet) African languages that in reality are better represented by a more fluid language or dialect continuum (Makoni 1998) – the lack of specificity, often referred to as the absence of an implementation plan (Heugh 1999, Webb 2002). A decade after the watershed year of 1994 it has become increasingly apparent that a considerable mismatch appears to exist between language policy on the one hand, and actual language practice in the spheres of Language policy implementation and language vitality in Western Cape primary schools
17
government and education on the other. Whereas language policy expressly professes to promote multilingualism in South Africa, language practitioners in languages other than English are complaining more and more that their languages are being marginalised to an even greater extent than in the past.AsearlyasM arch1996,attheLANGTAG workshopLanguage on Equity, the hegemony of English was severely criticised. Since then an entire generation of practitioners and observers has been critical of the lack of implementation or realisation of government policy. The fiercest criticism has come from progressive teachers (e.g. Jansen 2002) and language practitioners (e.g. Alexander 2000, Bamgbose 2000, Heugh 2003) who have identified South Africa’s self-imposed neo-liberal economic policies, elite closure and the neo-colonial/apartheid habitus as key reasons. It is the perceived mismatch between rhetoric and practice for the languages of lesser status that is the focus of this chapter and this report at large. In the South African situation, the social, economic and political context can only be fully understood in terms of the history of language policy in South Africa. The focus here will specifically be that of the history of language policy in education, because this is the area in which the decisions and mistakes of today most affect the common future. Before turning to this history, the term ‘language policy’ should be briefly examined. Dirven (1991:165) points out that this concept is usually understood to mean the official policy of a government in planning the use of one or more languages in a given country. He explains that it can also be given a wider interpretation to refer to the attitudes of different population groups towards the official language legislation and towards the other languages of their nation. Dirven’s interpretation of the term includes the non-statutory, but tacitly agreed-upon, attitudes of language communities towards official legislation and the influx of elements from one language into another – what Alexander (1989) and Heugh (2003), amongst many others, have termed a ‘bottom-up’ approach to language planning, or ‘language planning from below’. Pertinently, Stroud argues that ‘implementation is not a mere technocratic execution of policy decisions but in point of fact a political process in itself’(2002: 75, original emphasis). With regard to the implementation (or otherwise) of policy, Jansen (2002) goes even further to argue that where educational policy decrees from ‘above’ are simply ignored in the classroom, policy is what happens at the chalk face: practice becomes policy. In similar vein, Darling-Hammond (1997) argues that unless policy is negotiated amongst various stakeholders, and teachers’ experiences and knowledge are taken as a necessary starting point, policy will simply remain a dead letter. Plüddemann (2003) draws on Bourdieu in distinguishing between symbolic and material policies; and prefers the term policy realisation, as it implies a more gradual negotiation amongst stakeholders and has fewer top-down connotations than policy implementa-
tion. In what follows, then, language policy will be referred to in both the above senses, i.e., both as official and as community-based. The historical contextualisation is followed by an overview of present-day statistics and trends concerning the languages that play a role in South Africa’s multilingual and multicultural society. As shown in Section 1.2, isiXhosa is the second-largest home language in South Africa, with some 7.9 million speakers nationwide, according to the 2001 population census results. While isiXhosa was officially the thirdlargest language in the Western Cape in 1996 with around 750 000 speakers (19%), this figure has increased dramatically to almost 1,1 million (24%) five years later on account of an economically-driven migration from the impoverished Eastern Cape. In the process isiXhosa has replaced English as the second-biggest language in the province, behind Afrikaans (2,5 million speakers, or 55%). Western Cape Education Department statistics for 2002 show that 22.5% of children in public schools had isiXhosa as a home language, 55.7% had Afrikaans, 20.7% had English, 0.4% had Sotho, and 0.7% had other home languages (source: EMIS Unit, WCED). A second majority-language feature is that isiXhosa enjoys official status at both national and provincial levels. As already mentioned, it is recognised in the Constitution (1996) as one of the country’s eleven official languages. In the Western Cape isiXhosa was declared an official language alongside Afrikaans and English in 1998 by the Western Cape Language Act. Despite these majority-language features, isiXhosa effectively remains a minority or dominated language (cf. Alexander 2001b) and Xhosa-speakers continue to be a social minority, both nationally and in the Western Cape. The majority of Xhosa-speakers continue to live in impoverished ghettoes and remain marginalised from the mainstream economy, while a minority are assimilated on terms set by the dominant English-speaking elite. Historically, a defining aspect of social stratification in Cape Town and the Western Cape has been the official attempt, first under colonialism and then apartheid, to keep out Africans, who continue to live in largely segregated areas. These attempts, in the guise of the notorious ‘coloured labour preference policy’ from 1953-1984 and the particularly brutal forced removal of Africans from KTC/Crossroads in 1986 (Cole 1987), were ultimately to prove fruitless as economic considerations held sway. A demolinguistic mapping of the city, based on the 1991 census figures, shows that the segregation index for Xhosa-speakers was extremely high (96%), followed at some remove by English (60%) and Afrikaans (57%) (Williams & Van der Merwe 1996:59). As the authors observe, with conscious or unconscious understatement, ‘The spatial patterns illustrated suggest underlying processes of legal separation, selected interaction, social ecology, assimilation and language segregation’ (ibid: 59)!
18
Language policy implementation and language vitality in Western Cape primary schools
PRAESA – Occasional Papers No. 15
19
As was already mentioned in the constitutional context of Section 1.1, different meanings are attributed to the concept ‘official language’. Cooper (1989:100) distinguishes among three types of official languages: statutory, working and symbolic official languages. A statutory official language is a language that the government has specified as official or declared as appropriate by law. A working official language is used by a government for its daily activities whereas a symbolic official language is the language which a government uses as the medium for symbolic purposes. During the period of the 1961 Constitutional dispensation, English and Afrikaans were both statutory and working official languages. Afrikaans also functioned as a symbolic official language. The languages recognised as official in terms of the 1996 Constitution, have no judicial status; have, except for English, very limited use as working official languages; and have no symbolic role. As a matter of fact, their inclusion in the Constitution seems to be the only symbolic act with which they can be associated. In the final report of the constitutional Language Plan Task Group (LANGTAG 1996), a national language plan for South Africa was outlined. The extensive report deals with a wide range of issues, such as language equity, language development, literacy, heritage languages and the role of language in economy, education and public services. The languagein-education proposals seek to provide an appropriate balance between the maintenance of social cohesion on the one hand and the acceptance of cultural diversity in South Africa on the other. According to LANGTAG (1996:124–125), language policy in education should: a. facilitate access to meaningful education for all South African students; b. promote multilingualism; c. promote the use of students’ primary languages as languages of learning and teaching in the context of an additive multilingual paradigm and with due regard to the wishes and attitudes of parents, teachers and students; d. encourage the acquisition by all South African students of at least two but preferably three South African languages, even if at different levels of proficiency, by means of a variety of additive bi- or multilingual strategies; it is strongly recommended that where the student’s L1 is either Afrikaans or English, an African language should be the additional language; e. observe and sustain the legal equality of status of all South African languages;
f. promote the linguistic development and modernisation of the African languages as well as their equality of social status; g. promote respect for linguistic diversity in the context of a nationbuilding strategy by supporting the teaching and learning of all other languages required by children or used by communities in South Africa, including languages used for religious purposes, languages which are important for international trade and communication, and Sign Language; h. help to equip South African students with the language skills needed to participate meaningfully in the political economy of South Africa; i. harmonise with the intentions of the proposed National Qualifications Framework (NQF) by: • opening up qualification routes; • facilitating the integration of education, training and adult basic education; • using language and communication skills to promote core competencies such as problem solving and critical thinking. In order to achieve these goals, a wide variety of research and development activities have been proposed in terms of language statistics, language attitudes, resources for teacher training, curriculum and assessment, language policy documentation, and classroom practice investigations. What looks beautiful on paper in these and many other recommendations is, however, not easy to realize in practice. The major obstacle in South Africa is not so much the availability of necessary financial means for implementing these recommendations, as the prevailing reluctant attitudes towards accepting and promoting multilingualism – what has variously been termed the monolingual habitus (Gogolin 1997) and the anglocentric habitus (Plüddemann 1999). Heugh (2000) discusses a number of popular myths against bilingual and multilingual education in South Africa and proposes an equal number of alternatives. In an effort to nudge local agencies and actors to resourcing African languages and implementing language policies and plans, Heugh (2003) has drawn on research elsewhere which has shown the cost-effectiveness of producing learning support materials (such as textbooks) and stories in the larger indigenous languages. Plüddemann (1999) refers to the fact that only 16% of all books published in 1991 were in one of the nine official African languages of South Africa, as opposed to almost 50% of the titles being in English. Not without reason, the Pan South African Language Board (PanSALB 1999), established by the government to monitor the implementation of the constitutional provisions by all organs of state, concluded that there is a need to educate people about their rights and to
20
Language policy implementation and language vitality in Western Cape primary schools
1.2 Multilingualism in rhetoric and practice
PRAESA – Occasional Papers No. 15
21
improve the system of monitoring and attending to issues of language rights violations. PanSALB (2001) released a summary of the major findings of a survey amongst 2,160 South Africans of 16 years and older, drawn from a variety of rural and urban social strata. The fieldwork took the form of personal interviews by experienced interviewers in the languages of choice of the respondents. In this final section, some of the major outcomes are presented. Table 1.2.1 provides a comparative proportional overview of the outcomes of this survey concerning the distribution of the main languages at home or spoken to members of the immediate family, as reported by the respondents, compared to the outcomes of the 1991 and 1996 census data.
PanSALB survey (conducted in 2000)
EMIS data, 2001
Home
Primary
Mis-
Focus
Home
language
LoT
match
language
language
24
6
-18
IsiZulu
26
LoLT
Mismatch
6
-20
16
2
-14
IsiXhosa
21
6
-15
17
16
-1
Afrikaans
11
13
2
8
–
-8
Sepedi
11
3
-8
7
1
-6
SeSotho
7
2
-5
Home
1996
2000
2001
Largest
9
80
71
English
7
66
59
language
Census
PanSALB
Census
mismatch
10
2
-8
Setswana
6
2
-4
isiZulu
22.9
23.8
23.8
0.9
3
1
-2
Xitsonga
5
1
-4
isiXhosa
17.9
16.3
17.6
1.6
3
–
-3
SiSwati
3
-2
Afrikaans
14.4
16.5
13.3
3.2
2
–
-2
Tshivenda
3
1
-2
Sepedi
9.2
7.7
9.4
1.7
1
–
-1
IsiNdebele
2
-1
English
8.6
8.7
8.2
0.5
Setswana
8.2
9.5
8.2
1.3
Sesotho
7.7
6.8
7.9
1.1
Xitsonga
4.4
3.2
4.4
1.2
SiSwati
2.5
3.3
2.7
0.8
Tshivenda
2.2
1.8
2.3
0.5
IsiNdebele
1.5
1.2
1.6
0.4
Afrikaans + English
N/a
0.9
N/a
pm
European/Oriental/other
0.6
0.3
0.5
0.3
Table 1.2.2: Mismatch between languages at home and at school, in percentages. Adapted from: PanSALB 2001 and EMIS unit, Department of Education, Pretoria.
Table 1.2.1 shows some fluctuation between the outcomes of these surveys, in particular for Afrikaans. According to PanSALB (2001), people are at least bilingual in some 36% of South African homes. In the PanSALB survey, one question addressed the issue of the home language vs. the primary language of tuition. The outcomes are presented in Table 1.2.2.
The results presented in Table 1.2.2 clearly show both the amount and degree of the mismatch between the languages at home and at school, as reported by South Africans of 16 years and older (PanSALB 2001) and by the official data bureau of the national Department of Education in Pretoria, respectively. Compared to the eleven home languages, only the two previously official languages occur as substantial primary languages of tuition, namely English and Afrikaans. The statistics demonstrate again the dominance of English at school in contrast to its relatively low status at home. Of the 11 million-plus children in the public school system nationally in 2001, more than ten times as many children were taught through the medium of English than had English as a home language. Only one-quarter of African-language speakers learn through their home language, and almost all of these would be in the first three school Grades. This implies that the African languages are hugely under-utilised as LoLTs. The hegemony of English in the schooling system is particularly problematic as most teachers are not (highly) proficient in it (Working Group on Values 2000). For most children advanced proficiency in English thus becomes unattainable (Alexander 2000). This mismatch between learner home
22
Language policy implementation and language vitality in Western Cape primary schools
Table 1.2.1: Comparative overview of survey data on the main home languages of South Africa, in percentages
PRAESA – Occasional Papers No. 15
23
language and the LoLT continues to be accompanied by large-scale underperformance by the majority of children in the country, including African-language speakers in the Western Cape (see October 2002). In other words, systemic inequality continues to be reproduced by inappropriate language practices. The outcomes of the PanSALB survey on language learning attitudes are as follows: • mother tongue instruction (and the good teaching of another official language) should be available (37%); • children should have the opportunity to learn both their mother tongue and English equally well (42%); • children should learn through both English and their mother tongue (39%); • it is more important that children should learn in English than in other languages (12%). In other words, the vast majority of respondents favour a strong role for the home language. These outcomes show the mismatch between the respondents’ attitudes and the actual practices in education. The answers given by non-native speakers of English to the question: These days most ministers in government, councillors in municipalities and officials make statements or speeches in English. Do you understand what they are saying? led to the following remarkable outcomes: • fully (22%); • as much as I need to (27%); • I often do not understand (30%); • I seldom understand (19%); • other answers (2%). These and other outcomes, on such issues as understanding radio and television programs, illustrate the fallacy of assuming that English smoothly functions as the lingua franca for intercultural communication in South Africa. Alexander (2000, 2001b) points out that most black South Africans’ lack of confidence in the value of African languages is a symptom of the apartheid syndrome. They have come to believe that they have to learn English to overcome their ‘deficit’. The resultant loss of self-esteem and of a dignifying self-image is referred to by Alexander as fatal. In spite of affirmative action programmes, African languages are either not used as languages of teaching at all, or only during the first three or four years of initial schooling, and are then dropped. Hardly any materials in African languages exist beyond that point, or are of poor quality. Moreover, as soon as English becomes the predominant language in the classroom, most teachers are not
proficient enough to use it adequately as a medium of instruction. The result is that African HL children’s literacy in both their own language and in English at the end of elementary schooling is often poorly developed. Alexander suggests more firmly established planning steps in order to realize the ambitions of the Constitution, such as nation-wide language awareness campaigns, regional and local action programmes to enhance the value, visibility and status of African languages, compulsory knowledge and use of African languages in public jobs, better teacher training programmes, and initiatives to encourage the creation of texts and literature in the African languages. For a discussion of these and other suggestions in the domain of multilingual education, see Heugh et al. (1995) and Plüddemann et al. (2000). It should be clear that the new beginning of South Africa is very much a matter of blind navigation. The dominant position of English is rapidly becoming entrenched. The unfortunate result is that the majority of people (approximately 80%) do not have the command of English needed to succeed in higher education or to compete on an equal footing for the prestigious and higher paid jobs. Alexander (1997:86) points out that no nation ever thrived or reached great heights of economic and cultural development if the vast majority of its people were compelled to communicate in a second or even third language. The indigenous languages, and in many areas this now includes Afrikaans, have little value in the market place if not combined with proficiency in English. As a result of the official language policies over the years, most African people attach little value to their mother tongue and believe it to be deficient or impoverished in a way that makes it unsuitable for use in a modern society. This situation is not helped in any way by the prestige that English enjoys among the new black elite or the recent tendency among major institutions to adopt (ostensibly for economic reasons) an English-only policy. As yet, the paradoxical outcome of the 1996 constitutional recognition of eleven official languages is that English has risen to an even higher status than during apartheid, at the cost of all of the other languages in South Africa. As is clear from the official documentation, the will to do ‘the right thing’ for the most part seems to be there. For that reason, if for no other, it is important to emphasise the very real mismatch between the multilingual policy of official documentation and the actual language practice in government, education and business. Only if the leadership is seen to take pride in all of South Africa’s languages; only if the schools value every child’s mother tongue as an unique asset, and offer multilingual options; and only if the people are rewarded for their knowledge of a variety of languages in terms of jobs and status can language practice in South Africa eventually reflect language policy.
24
Language policy implementation and language vitality in Western Cape primary schools
PRAESA – Occasional Papers No. 15
25
1.3 Census data and language mapping: the Western Cape Before continuing we provide a brief overview of language demographics in the Western Cape province. As indicated earlier, provincial and local governments (municipalities) have considerable powers to decide on their own language policies in the provision of services such as education, subject to national norms. It is thus at this level that reliable language statistics could have most impact. Census information on the population of the Western Cape shows the potential as well as the limitations of existing census data to inform language planning. The Western Cape has been officially classified as the second most urbanised province after Gauteng, with a 89% urban and a 11% rural population (Statistics South Africa 2003). This figure is somewhat misleading, however, as many smaller towns have been included in the definition of ‘urban’. For present purposes we make a distinction between the only metropolis, the City of Cape Town, and the rest of the province, consisting of towns in various sizes and the rural areas. This distinction forms the basis of the surveys on which we report in the next chapter. The most densely populated area is the City of Cape Town (henceforth CCT), the largest urban area, which is situated in the south-western corner of the province. Although it covers only a small fraction of the surface area of the province, CCT houses 64% (i.e. 2 893 246 of 4 524 335) of its population – testimony to the degree of urbanisation. In the five-year period between the two most recent censuses, the province has experienced a substantial population increase of 14%, from just under 4 million in 1996 to over 4,5 million by 2001. In numerical if not in percentage terms, CCT has grown more than the rest of the province, i.e. by close on 330 000 people (13%) as opposed to 238 000 (17%). The largest rate of increase has come in the fast industrializing medium-sized towns such as George, Knysna, Mossel Bay, Oudtshoorn – all of which are close to the impoverished Eastern Cape province from which the majority of in-migrants enter the province – and Saldanha on the west coast. City of Cape Town (CCT)
Western Cape
Western Cape
excluding CCT
(all)
2001 population
2 893 246
1 631 089
4 524 335
1996 population
2 563 612
1 393 263
3 956 875
329 634
237 826
567 460
12.9
17.1
14.3
Increase 1996-2001 % increase 1996-2001
In demographic terms the Western Cape is essentially a trilingual province. Afrikaans remains by far the most widely spoken (first) home language with 2,5 million speakers (55%), followed by isiXhosa (24%) and English (19%). All other home languages combined total less than 2%, and are disregarded for present purposes. Home Language
Western Cape 2001
Persons (number)
Persons (%)
Afrikaans
2 500 748
55,3
IsiXhosa
1 073 951
23,7
English
874 660
19,3
Sesotho
31 438
0,7
IsiZulu
9 166
0,2
Setswana
5 522
0,1
IsiNdebele
2 216
0,0
Sepedi
1 898
0,0
Xitsonga
2 065
0,0
SiSwati
1 738
0,0
Tshivenda
1 284
0,0
Other
19 650
0,4
TOTAL
4 524 335
100,0
Table 1.3.2: Population of the Western Cape province, 2001 Census (source: StatsSA 2003)
The comparison between the 1996 and 2001 Census data on population by (first) home language speaks volumes. While all three major home-language groups recorded growth, isiXhosa has increased the most in both absolute and percentage terms, from three-quarters of a million in 1996 to almost 1,1 million five years later – a massive increase of 44%. By contrast, increases for Afrikaans (8%) and English (10%) have been more modest. At present rates Xhosa-speakers will outnumber Afrikaansspeakers in the province by 2015.
Table 1.3.1: Population of the Western Cape, 1996-2001 (adapted from: Statistics South Africa 2003)
26
PRAESA – Occasional Papers No. 15
Language policy implementation and language vitality in Western Cape primary schools
27
Home Language
1996
2001
Home Language
Increase
City of Cape Town
Persons
Persons
Persons
Persons
(number)
(%)
(number)
(%)
2 315 067
59.2
2 500 748
55,3
185 681
8.0
IsiXhosa
747 977
19.1
1 073 951
23,7
325 974
43.6
IsiXhosa
English
795 211
20.3
874 660
19,3
79 449
10.0
English
Afrikaans
Western Cape excl.
Western Cape (all)
City of Cape Town
1996 – 2001 Persons Persons
Persons
Persons
Persons
Persons
Persons
Persons
(number)
(number)
(%)
(number)
(%)
(number)
(%)
1 198 989
41.4
1 301 759
79.8
2 500 748
55,3
831 608
28.7
242 343
14.9
1 073 951
23,7
808 608
27.9
66 052
4.0
874 660
19,3
(%) Afrikaans
Table 1.3.3: Population growth in the Western Cape, 1996 – 2001
Table 1.3.4: Population by home language (3 major languages only) for City of Cape
(adapted from: StatsSA 2003)
Town, Western Cape excluding City of Cape Town, and Western Cape (all), 2001
The figures continue to tell the story of the ongoing legacy of the political economy of apartheid. Recall that in terms of the Bantustan policy after 1948, millions of ‘black Africans’ were ghettoised by home-language group in the so-called ‘homelands’, with only temporary work or residence permits in ‘white’ South Africa. The dual purpose was to facilitate the minority regime’s divide-and-rule strategy vis-à-vis the unenfranchised majority, while simultaneously providing a pool of cheap labour for the ‘white’-owned mines, farms, businesses, and the civil service. The two ‘homelands’ for the Xhosa-speaking people, the former Transkei and Ciskei, today form part of the Eastern Cape province which is wracked by high unemployment and economic stagnation – testimony not only to a decade of misguided neo-liberal macro-economics since 1994 but also (still) to the failure of racial capitalism before then. It is unsurprising, therefore, that the relative concentration of capital and the accumulation of wealth in (parts of) greater Cape Town and the medium-sized towns of the province should act as a magnet to people from the Eastern Cape seeking to eke out a living. Given the overlap between home language and so-called ‘population group’, and the continued correlation between the latter and socio-economic status, it is inevitable that the majority of those seeking jobs in the wealthier Western Cape should be Xhosa-speakers. Despite the in-migration of Xhosa-speakers into the larger towns of the province, the Western Cape outside the CCT remains overwhelmingly Afrikaans-speaking, with 80% of people reporting Afrikaans as their home language. A mere 4% reportedly speak mainly English at home. The metropolis, by contrast, has three contending home languages. Afrikaans is still the most widely-spoken home language (41%), but isiXhosa (29%) and English (28%) are not that far behind. These regional differences pose a number of challenges to language policy implementation in public life, including schooling.
28
PRAESA – Occasional Papers No. 15
Census (Source: Statistics South Africa 2003)
Our final table in this section provides an overview of language distribution in the two regions identified in this report. Afrikaans-speakers are almost equally divided between the CCT (48%) and the rest of the province (52%), i.e. they are the least urbanised. By contrast Xhosa-speakers (77%) and, especially, English-speakers (92%) are overwhelmingly drawn to the metropolis. Home Language
City of Cape Town
Western Cape excl.
Western Cape (all)
City of Cape Town Row %
Row %
Row %
Afrikaans
47.9
52.1
100.0
IsiXhosa
77.4
23.6
100.0
English
92.4
7.6
100.0
Table 1.3.5: Proportional distribution of the three major home languages in urban and rural areas of the Western Cape, 2001 Census (Adapted from: StatsSA 2003)
These figures should not obscure the numerical preponderance of Afrikaans, however. The basic profile of almost every town in the province (including CCT) is the same: Afrikaans-speakers are in the majority, followed (at some remove) by Xhosa-speakers and then by English-speakers. Again, in the interests of democratisation this bald fact must of necessity be factored into any language policy equation at regional and local level, notwithstanding the dominance of English in the public sphere. We shall return to this point in subsequent chapters.
Language policy implementation and language vitality in Western Cape primary schools
29
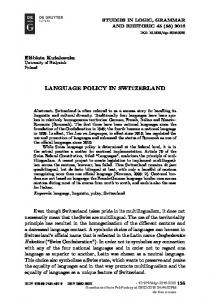
To conclude this section, it is instructive to illustrate the potential as well as the limitations of the Census questions on language with reference to the CCT map of language dominance (Figure 1.3).
Figure 1.3: Dominant Home Language, 2001: City of Cape Town [Cape Town] (Statistics South Africa 2003)
We have already pointed out some shortcomings of the 2001 census, namely • The limited number of questions on language use in the home • The lack of elucidation when the language question was asked • The provision for only one home language • The absence of questions about language use in other domains The Statistics South Africa website helpfully defines ‘dominant home language’ as:
30
PRAESA – Occasional Papers No. 15
• One home language having more than 50% of the total home language of the municipality; or • Between 33% to 50% of one home language and no other home language having more than 25%. Further, ‘multiple dominance’ is defined as follows: “One home language having between 25% to 50% of the total home language and one or more other home language(s) with more than 25% of total home language of the municipality”. Finally, ‘none’ or ‘no dominance’ is defined thus: “No one home language with more than 25% of the total home language of the municipality.” At first glance the map makes for compelling viewing. It is easy to see that Afrikaans is ‘dominant’ in the north, north-west, east, and south-east of the CCT; likewise, that English is ‘dominant’ in the central, western and south-western reaches, and that isiXhosa ‘dominates’ certain smaller areas in the south and east of the CCT that only informed observers will be able to identify as the historically ‘African’ townships of Langa, Guguletu, Nyanga, Crossroads, Khayelitsha, as well as a number of newer settlements, some of them informal. Pertinently, there are a number of smaller ‘multiple dominance’ areas, notably along the south-western coast (Muizenberg, Fish Hoek) as well as in the city bowl area. What is missing from the map is that many people, especially on the Cape Flats, have two home languages, something that could have been mapped from the 1996 but not the 2001 data. With the help of interactive Geographical Information Systems (GIS) software, it would then have been possible to create digitalized overlays to show the language distribution. Moreover, language use in domains such as health care, the courts, municipal services, business, and education could not be mapped because no questions about these were asked. Another limitation is that the map does not try to correct the misleading impression that, judging by the surface areas of each ‘dominant language’, English is numerically more ‘dominant’ than isiXhosa. This is because population density has not been taken into account. Is it not possible to combine more nuanced language ‘dominance’ data with population density to create a more accurate picture? Finally, the concept of ‘dominant’ language as used here is problematical as it already has two other, pre-established meanings that are widely recognised in the sociology of language and in sociolinguistics, namely (1) the most powerful or influential language in a given (usually public) domain, and (2) an individual’s best-known or most proficient language. It is in the latter two ways, at any rate, that we use the concept in this report.
1.4 Language in education surveys in the Western Cape As we will see in the chapters that follow, most of the survey findings pertaining to language use at home and at school, language choice, lanLanguage policy implementation and language vitality in Western Cape primary schools
31
guage proficiency, language dominance and language preference are reflected in the new (draft) language policy for primary schools (LPPS) in Western Cape, which is discussed in Chapter 5. The draft LPPS takes full cognisance of the dilemma posed by the hegemony of English in an officially trilingual province. The document was drawn up in 2002 at the behest of the MEC for Education by a task team which had been given the brief of investigating the feasibility and legality of introducing a policy of mother-tongue education and third-language tuition in primary schools. The LPPS process was informed by a number of studies of language attitudes and language use amongst Western Cape school communities. Two of the studies are briefly reviewed, below. SBA/MSSA 2002 One of these was a two-part language attitude survey relating to education in the Western Cape (SBA/MSSA 2002). The particular focus was on language preferences of school communities (adults) with regard to mother-tongue education and the introduction of a third language at primary school level. A total of 750 adults across the province, constituting a representative sample, were interviewed via a survey questionnaire, and community meetings were held to gauge responses on a more qualitative level. Results show ‘a positive attitude and perception regarding mother tongue instruction in Grades 1–7’ (SBA/MSSA 2002); that parents in bilingual households would prefer their children to be taught on the basis of the child’s mother tongue; that a mother-tongue based education should first target Grades 1–3; that ‘most respondents are in favour of their children learning a third language in primary school’; concomitantly, that most respondents do not envisage their children learning only one language while at primary school. With regard to the preferred language of learning and teaching (LoLT) for content subjects, results are as follows: Content subjects like maths and science should be taught and learnt through the mother tongue only
38%
Content subjects like maths and science should be taught and learnt through English only
11%
Content subjects like maths and science should be taught and learnt through the mother tongue AND a second language, that is, bilingually – as in dual medium schools
51% Total
100%
Table 1.4.1: Percentage preference for LoLT in content subjects (Maths & Science) in Grades 1–7 (source: SBA/MSSA 2002:15)
32
PRAESA – Occasional Papers No. 15
Nine out of every ten respondents (89%) thus prefer a strong role for the mother tongue as a LoLT, either alone (38%) or alongside a second LoLT (51%). Only 11% are in favour of an English-only policy. These results are remarkably similar to those of the PanSALB/MarkData survey of two years’ previously (see elsewhere in this report). Further analysis reveals that all three home-language groups strongly favour a mother-tongue based approach (see Table 1.4.2). Afrikaans MT group Mother-tongue option
Xhosa MT group
English MT group
45%
5%
63%
English option
8%
23%
13%
Bilingual option
47%
72%
24%
100%
100%
100%
Totals
Table 1.4.2: Percentage preference for LoLT in content subjects (Maths & Science) in Grades 1–7 (adapted from: SBA/MSSA 2002:15)
Xhosa-speakers strongly favoured the use of the bilingual option, English-speakers preferred the mother-tongue option, and Afrikaansspeakers were almost equally divided between the mother-tongue (MT) and the bilingual options. Similar findings were reported with regard to preferred LoLT options for Grades 8-12, i.e. the high-school years. The results are strikingly at odds with the current trend towards an English-mainly curriculum in many schools, and indicate potential majority support across the province for a mother-tongue based dual-medium education. SDU/PRAESA 2002 and PRAESA 2002 These two studies into language use in Western Cape schools were designed as a complementary pairing focusing on quantitative and qualitative aspects, respectively. The former surveyed schools across the province through a standardised questionnaire that was filled in by a senior management person at the school. Some salient findings from the SDU/PRAESA (2002) study are hereby listed. • Afrikaans is the home language of the majority of children (59%), ahead of English (37%) and isiXhosa (15%). • 11% of children have two home languages, mostly in the Afrikaans/ English combination. • One-third of Xhosa-speaking children are enrolled in non-ex-DET schools, representing a unidirectional and partial desegregation of exHoR and ex-CED schools.
Language policy implementation and language vitality in Western Cape primary schools
33
• A minority of schools (14%) have reportedly changed their language policies and practices in the last decade, mainly on account of parental pressure for English. • The LiEP appears to be ineffectual as an instrument for language-driven transformation of the curriculum. • A large majority of dual-medium schools report that continuous assessment can be done in either language and that tests and exams can be written in either language. However, only 39% of schools offer bilingual test and exam papers, and only 50% of the dual-medium schools report that sufficient learning support materials (LSMs) are available in both languages. • Ex-CED schools are by far the best resourced, if the number of teachers funded by the school itself (SGB posts) is used as a gauge. • Almost half the Xhosa-speaking teachers are NOT teaching in their home language. • Almost half of all schools do not have a written language policy. • On account of the demands on bilingual teaching, learning, and assessment, dual-medium schools are in greater need of support than other schools. • Many linguistically-mismatched schools see the need to appoint Xhosaspeaking teachers and teaching aides, and for state-funded isiXhosa lessons for teachers, but do not themselves have the necessary funds. • Schools express a great need for reading support by way of learning support materials and library books. • With regard to language attitudes, English is viewed as the language most valued by the school community in the public domains of higher education and the job market; the position of Afrikaans in higher education and the job market is surprisingly weak; and isiXhosa has virtually no currency in the marketplace or in higher education. As we hope to show, below, results of the SDU/PRAESA survey largely confirm those of our study. The SDU/PRAESA survey was followed up by a qualitative study of dual- and parallel-medium education (PRAESA 2002) in 12 carefully selected schools representing the widest possible spectrum of LoLT descriptors, regional distribution, ex-department, and school type. Via interviews and classroom observations, a more textured image of dual- and parallel-medium schools emerged. Key findings are that • there is an economically-driven quest for an English-medium education across Western Cape schools, at the expense of Afrikaans and isiXhosa • in the better-resourced school communities where Afrikaans is still a marker of cultural self-identification the apparent language shift from
Afrikaans to English is not so apparent, but initiatives to promote English for economic reasons are still evident • ex-DET schools continue to bear the brunt of inadequate resourcing and an anglocentric disposition, and tragically disadvantage their children through misguided LoLT practices in which the home language is, at best, used orally and covertly alongside English • dual-medium education is generally applied as a default option to parallel single-medium education, i.e. the ideal remains home-language based education • many dual-medium and/or parallel-medium schools appear to be moving towards an English-mainly and even an English-only orientation • no teachers are formally trained for systematic dual-medium education, although many are successful through years of trial and error • despite their linguistic diversity, few dual- and/or parallel-medium schools are able to offer isiXhosa as a language subject. As a result, apartheid-era language subject practices continue to apply • schools remain largely unaware of, or impervious to, the LiEP and its advocacy of additive bilingualism • a severe form of primary-language deprivation is experienced by Xhosaspeaking children in ex-HoR and ex-CED schools which do not offer isiXhosa as a subject, let alone as a LoLT. Predictably, drop-out and failure rates are high. (PRAESA 2002: 6-10) Collectively, therefore, the studies paint a bleak picture of the current language-in-education situation in Western Cape schools where communities follow the lead of the middle classes in the instrumentally-driven quest for an English-mainly education. On the other hand, the studies also show that where hypothetical (what-if) questions about language use in education are inserted, responses in favour of home-language based schooling have a decidedly counter-hegemonic character. This discrepancy between reality and vision is neatly captured in the (draft) Language Policy in the Primary Schools of the Western Cape, which is discussed in Chapter 5.
34
Language policy implementation and language vitality in Western Cape primary schools
PRAESA – Occasional Papers No. 15
35
Chapter 2 Research design 2.1 Introduction Language surveys in multilingual societies have a dual function: they provide information crucial to informed language planning; and they raise awareness of dominant and dominated languages and their speakers, and of language matters in general. Population censuses often neglect language issues. As we have seen, recent population censuses (1996, 2001) in South Africa have added little understanding to actual patterns of language use and linguistic diversity in a multilingual society. In recognition of the inadequacy of existing language surveys and the paucity of information on language matters in the country, and of the nascent trend towards an English-mainly public sphere, the pathfinding LANGTAG report (1996) called for the establishment of baseline data on language use and language attitudes across all social sectors and domains. Such data would be essential for language policy and planning purposes. One of the more detailed of these studies has been the 2000 survey commissioned by the Pan South African Language Board and conducted by MarkData amongst over 2000 adults nationwide. The survey finding that some 36% of the population speak at least two languages at home or with the immediate family (PanSALB/Markdata 2000:1) complements existing census data in important ways. With regard to education, 88% of the respondents would prefer to see a prominent role accorded to the mother tongue, while only 12% agreed it was “more important that children should learn in English than in other languages” (ibid:6). This finding spectacularly explodes the myth that speakers of African languages are prepared to sacrifice their home languages in the drive for proficiency in English. A more detailed discussion of the PanSALB/MarkData survey can be found in the concluding chapter of this report. In light of the limitations of census data, focused language surveys have an important role to play, particularly in a multilingual society in the throes of social transformation. As already discussed, the South African Constitution of 1996, the national language-in-education policy for public schools (DoE 1997), and the report on Values, Education and Democracy which recommends that mother-tongue education and fostering multilingualism be retained and developed as core language values (Working Group 2000), all expressly commit the State to promoting multilingualism. In the Western Cape, the new (draft) language policy for primary schools (WCED 2002) that advocates mother-tongue-based bilingual education, together
36
PRAESA – Occasional Papers No. 15
with the Revised National Curriculum Statement, lays the basis for a transformation of education. It is self-evident that the successful realisation and monitoring of these policies will depend on an updated and multifaceted database that is informed by focused language surveys, amongst other sources of information. The need for special language surveys should, however, not blind us to their inherent limitation. After all, they capture merely a synchronic moment of a diachronic process, what Mesthrie (1995:xvii) calls “the essentially dynamic nature of language use in any society”: Language statistics must always be in flux on account of large-scale movements in and out of the country, shifts in language preferences, and, above all, the very multilingual nature of countries like South Africa. (ibid:xvii) While we are justly cautioned against any inflated sense of their value, language statistics remain indispensable to informed language planning and should therefore be collected and constantly updated with intensified vigour, systematicity, and contextually-determined sensitivity. We remain mindful that even the most scientific study is ineluctably ideological and political, since questions of power and values are never far away: the very nature of the inquiry as well as the phrasing and sequencing of questions in themselves reflect choices that are ultimately undergirded by particular beliefs about language use and language attitudes and, in this case, by the advocacy of policy positions also.
2.2 Language vitality indicators The building blocks of the survey were a set of indicators or dimensions of language vitality that have been successfully used as a basis for numerous surveys conducted in The Netherlands and, lately, in other European countries as well (cf. Extra & Yagmur 2004). The concept of language vitality (Van der Avoird et al. 2001), in turn, derives from ethnolinguistic vitality, a term coined by Giles et al. (1977). Against the background of increased migration of minority groups to Europe and North America in the 1970s, the concept of ethnolinguistic vitality referred to “that which makes a group likely to behave as a distinctive and active collective entity in intergroup situations” (Giles et al. 1977:308). Determinants of ethnolinguistic vitality included the status of the language group, the number of group members, and the degree of institutional support such as use of the group’s language in highstatus domains, for example in education and government (309). The relative vitality of an ethnolinguistic group could then be determined by analysing these three main factors together, and by classifying groups along a continuum of vitality from high to low (317). As used in Dutch Language policy implementation and language vitality in Western Cape primary schools
37
and European contexts, language vitality (Van der Avoird et al. 2001) builds on the earlier concept within a similar context of increased immigration to European Union countries. However, the concept loosens the potentially problematic link between language on the one hand, and ethnic group and culture, on the other. It seeks instead to “operationalise ethnolinguistic vitality” (2001:10) by concentrating on a cluster of five language-specific indicators. As a way of comparing the status of respective immigrant minority languages the authors posit a language vitality index, a concept deriving from the ethnolinguistic continuum (Giles et al., see above). The index enables a comparison of the relative status of (immigrant minority) languages in situations where they are usually marginalized by the monolingual habitus (cf. Gogolin 1997) in the public domain, including education. The de facto status of dominated languages (Alexander 2001b) in South Africa and the Western Cape is similar enough to that of immigrant minority languages in Western Europe to warrant the use of the language vitality indicators for the present study. For example, both Moroccan Arabic in the Netherlands and isiXhosa in South Africa have very little prestige amongst non-speakers of these varieties, and their (home-language) speakers are generally marginalized in society. However, there are at least two important differences in status: isiXhosa is both an official language in South Africa and in the Western Cape, and it is numerically closer to a majority language with almost 8 million speakers countrywide and over 1 million in the Western Cape. Furthermore, many children in the Western Cape, especially in Greater Cape Town, have both Afrikaans and English as home languages, and grow up bilingually. In many cases the languages are not neatly separated, to such an extent that in certain parts of Cape Town the variety has been described by researchers as a mixed Afrikaans/English code (McCormick 1992). It thus seems inappropriate to invoke a language vitality index in gauging the relative status of Afrikaans, English, and isiXhosa in the Western Cape. On a discursive level, too, the concept of language vitality seems alien to the South African struggle for ‘parity of esteem’ between the newly official languages. At best such an index could be used to gauge the status of non-official languages of indigenous (KhoeSan), other African (Shona, Chichewa, Oshivambo, Kiswahili, Eritrean), Asian (Gujarati, Hindi, Vietnamese, Mandarin Chinese, Japanese) or European origin (Portuguese, German, Greek, French, Italian). For these reasons we have adapted constituent elements of the language vitality concept without adopting the language vitality index itself. In slightly modified form, the five language specific indicators used in the present study are:
Home language profile
38
Language policy implementation and language vitality in Western Cape primary schools
PRAESA – Occasional Papers No. 15
• Language repertoire: the extent to which the language in question is the only language used at home, in competition with other languages, alternatively in co-occurrence with other languages • Language choice: the extent to which the language is used in interaction with the mother, the father, brothers and sisters, grandparents, with the best friend, in religious contexts, and with the shopkeeper (cashier) • Language proficiency: the extent to which the language is understood, spoken, read, and written • Language dominance: the extent to which respondents speak this language best • Language preference: the extent to which respondents prefer to speak this language. Our survey is based on multiple rather than single questions on language use in home, family and community domains, for reasons already alluded to. For purposes of the present study, an inventory of home languages acts as the basis for the home language profile. In addition, a school language profile is specified on the basis of the data on children’s participation in and need for learning these languages at school. The following school language indicators have been added in order to provide a fuller picture of language status at primary school level: School language profile • Language use by the teacher: actual and preferred (Grade 1) • Languages learnt at school: actual and preferred (Grades 1 and 7) • Language of content subjects: actual and preferred (Grade 7) Together, these vitality indicators serve to describe the language profiles at school, circuit, district and provincial levels, and to elicit crucial information on language use at home and at school, on language attitudes, and on sociolinguistic phenomena such as language shift. These profiles stand to contribute to complement existing databases and in so doing to facilitate strategic policy interventions at the level of educational language policy and practice. The reader is reminded that the collected information is in the form of self-reported data, which assumes that the respondent is able and willing to provide the information correctly. It is possible that attitudinal factors may play a role in the answer patterns. For this reason the current survey should be validated with more in-depth follow-up studies of a qualitative nature.
39
2.3 Research aims and hypotheses The overall aim of the survey was to establish the status of languages used at primary school level in the Western Cape with a view to enhancing language planning and raising language awareness among teachers, children, education department officials and governing body members. The main research objectives were thus to establish • the status of languages at home and at school, and • the attitudes towards language use. Other research objectives included: • to raise awareness amongst schools around language matters in general, and the Department’s language-in-education policy (LiEP) for schools, in particular, and in so doing to encourage schools to critically review their policies; • to support school governing bodies, school management teams, and governing bodies by providing them with a language profile of their school, district or province which could inform language planning and policy processes; • to employ empirical methods of data collection that will inform language policy implementation at school, district and provincial levels, and to assist stakeholders in accessing relevant information. The need to raise language awareness amongst schools is explained below. Equally urgent is the need to complement and update existing databases on language statistics, particularly in education. While the Western Cape Education Department, to its credit, has an up-to-date database on children’s home languages for every school in the province, these statistics are in themselves inadequate as a starting point for informed language planning. This is because, amongst other things, they provide for only one home language per child. As indicated, recent findings from the PanSALB survey (2000) show that 36% of adults nationwide grow up with two or more home languages. In a city in which Afrikaans/ English bilingualism is manifestly widespread, it is puzzling that this fact has hitherto not been reflected in educational language statistics. On the basis of existing research on language and schooling in the Western Cape (see Schlebusch 1994, De Klerk 1995, Crawford 1996, Bloch 1998, Desai 1999, Plüddemann et al. 2000, October 2002, Dyers 2003, WCED n.d.) as well as our own day-to-day experiences in primary schools, we developed a number of hypotheses. For the children’s survey, these were as follows: 1. Inventory of home languages: we expected to find (a) three major home languages, namely Afrikaans, English and isiXhosa, and a few dozen smaller home languages, especially in the metropolis (Greater Cape Town), and (b) that the majority of children would come from Afrikaans-speaking homes, particularly in the rural areas where the power of Afrikaans-
40
PRAESA – Occasional Papers No. 15
2.
3.
4.
5.
6.
speaking land-owners and business people would be greatest, and that the next most widely-spoken home language in the urban areas would be English, followed by isiXhosa, while the order would be reversed in the rural areas. Language repertoire: we anticipated finding (a) many Afrikaans-English bilingual homes in the urban areas, i.e. a high degree of language concurrence (b) that Xhosa-speakers would come from mainly unilingual homes, i.e. that isiXhosa would have a high exclusive-use value in the home, and (c) that the majority of rural children would come from monolingual Afrikaans-speaking homes, with a large Afrikaans exclusive-use value. Language choice: here we expected to find (a) that language choice in interaction with family members would correspond largely to home language use, (b) that Afrikaans would be the language of choice for most interactions in the family domain, especially but not exclusively in the rural areas, and (c) that language choice in interaction with shopkeepers would point to the commercial power of English, at the expense of other languages. Language proficiency: we expected that (a) reported reading and writing proficiency would coincide with home language use, except in the case of the Xhosa-speaking group whose isiXhosa literacy levels were expected to be significantly lower than their isiXhosa oral language proficiency on account of the low status of isiXhosa in schools and in the political economy of the region; and (b) that reported proficiency in speaking amongst Grade 1s would broadly match home language use. Language dominance and language preference: we expected to discover (a) that Afrikaans would be the dominant language by a considerable margin in the rural areas and by a smaller margin in the Greater Cape Town area, (b) a preference for English amongst all three home language groups, particularly amongst English-HL and isiXhosa-HL speakers, (c) a preference for Afrikaans amongst ex-CED (‘white’) Afrikaans-dominant speakers because of the historical-cultural links between language and identity in that constituency, (d) antipathy towards Afrikaans amongst Xhosa-speakers and, to a lesser extent, among English-speakers, and (e) antipathy towards isiXhosa amongst Afrikaans-HL and English-HL speakers. Language subjects: we expected to find that (a) apartheid-era language subject practices still applied, i.e. that Afrikaans- and English-speakers were taking Afrikaans and English as subjects, but that Xhosa-speakers were taking isiXhosa, English, and Afrikaans, (b) that there would be little interest amongst English- and Afrikaans-speakers in learning isiXhosa or other African languages, and (c) that there would be considerable interest in learning European languages, especially amongst Grade 7 urban respondents.
Language policy implementation and language vitality in Western Cape primary schools
41
7. Teachers’ language use (Grade 1): we expected that (a) most Grade 1s would be taught through the medium of their HL, but that (b) in cases of language mismatch, those affected would want their teacher to address them in their HL. 8. Content subjects: we expected (a) that disjunctures would exist between the LoLT and the home languages of many Grade 7 children, particularly in the urban areas, and (b) that in such cases of language mismatch many would prefer to study through the medium of their HL. For the teachers’ survey, our hypotheses were that (a) patterns of language use and language attitudes amongst teachers would broadly correspond to those of their children, particularly of those in Grade 7, (b) that very few teachers would be proficient in all three provincial official languages, but that many would express confidence in their ability to teach bilingually, and (c) that most teachers would not be familiar with the LiEP.
2.4 Research instruments As the research was designed to establish the status of languages amongst a broad cross-section of respondents, the research methods were empirical. Two separate questionnaires for data collection were used for the children and their teachers, respectively. The questionnaire for children (Appendices 1–3) was administered orally (via interviews) to a sample of Grade 1 children (urban survey), and in writing to a sample of Grade 7 children (urban and rural; see Appendix 1). The data collection tool for the children’s survey was a questionnaire that was adapted from a similar survey conducted in 1996/97 in the Greater Durban metropolitan area (see Extra & Maartens 1998, Broeder et al. 2002). The prototype had been developed in Europe following a detailed study and evaluation of language-related questions in large-scale population research in a variety of non-European countries with a long history of migration and minorisation processes, and was also derived from extensive empirical experiences gained in carrying out municipal home language surveys amongst children in both primary and secondary schools in the Netherlands (see Broeder & Extra 1995, 1998 and Extra et al. 2002). As indicated, variables selected for the home language profile included respondents’ home language repertoire, language proficiency, language choice, language preference, and language dominance. A few additional questions specifically targeted school language use. The questionnaire had to be brief so as to minimise the time needed by teachers and children to answer it during school hours. It also had to be transparent for greater ease of answering by all children individually, where necessary in co-operation with the teacher, after an explanation of the survey in class. And it had to be powerful to elicit sensitive and complex
42
PRAESA – Occasional Papers No. 15
information in compact form. The survey consisted of 20 questions formatted onto a single A4 sheet which was made available to schools in three language combinations: Afrikaans/English, isiXhosa/English, and Afrikaans/isiXhosa (see Appendix 1–3). The questionnaire was made available and administered by home language speakers or proficient additional-language speakers of all three main regional languages in the following combinations: English/Afrikaans; English/isiXhosa; and Afrikaans/ isiXhosa, which would require fieldworkers with varying language proficiencies to visit classes in tandem. While we anticipated that most children would opt for either the English/Afrikaans or the English/isiXhosa questionnaire, an Afrikaans/isiXhosa questionnaire was initially included in order to raise awareness about the (potential) equality of status of the three languages under consideration. A further requirement of the questionnaire was that the answers given by the children should be controlled, scanned, interpreted, and verified as automatically as possible, given the large size of the resulting database. In order to fulfil this demand, both hardware and software conditions had to be met. The children’s questionnaire had the following structure: Questions
Focus
1–6
Socio-biographical information (name, age, grade, gender, country of birth, name of school)
7–9
Home language repertoire, language proficiency, language choice
10
Preferred radio/TV programme [this question was eventually discarded]
11–12
Teacher’s language use, and child’s preference w.r.t. teacher’s language use (Grade 1 only)
13–14
Languages learnt at school and languages children would like to learn at school
15–18
Language use, and child’s preferred language use, in content subjects (Grade 7 only)
19–21
Language dominance, language preference
Table 2.4: Outline of the children’s questionnaire
The dimensions of home language repertoire, language proficiency, choice, dominance, and preference profile the status of languages in the personal domain comprising home, family and community, with one important caveat. The questions on language proficiency (‘Which language(s) do you understand/speak/read/write?’) apply equally to languages known from home and those (successfully) learnt at school. QuesLanguage policy implementation and language vitality in Western Cape primary schools
43
tion 9, about the favourite radio/TV programme was discarded, on reflection, as too many other variables were involved. On the basis of questions 10–18, a school language profile could be compiled. This profile provides information about the available and preferred languages of teaching and learning in school, as well as on language subjects offered and preferred. Questions 19–21 complete the picture of language vitality, and were purposely placed last to induce respondents to consider both their home and school languages. A question about what might be termed ‘negative preference’ was included (‘What language(s), if any, do you not like?’), as we had a reasonable expectation of finding considerable antipathy towards Afrikaans and, to a lesser extent, isiXhosa. The questionnaire was tested in a pre-pilot (1 school) and in a pilot study (12 schools) in Greater Cape Town in 1999. On the basis of observed difficulties during this phase, the phrasing and wording of the questionnaires were amended. The questionnaire for teachers (Appendix 4) aimed at gathering data on the teachers’ language vitality, and to gauge the degree of correlation between learner and teacher language profiles. The questionnaire included similar questions to those that were posed to children so that language mismatches could be noted. Other questions related to professional qualifications and experience, subject specialisation, and Grades taught. Another category of questions centred on language awareness, by focusing on the national Language-in-Education Policy (LiEP) and the de facto school language policy. Teachers had the option of completing the questionnaire in any one of the three official provincial languages. Data on returned teachers’ questionnaires was captured manually onto an Excel spreadsheet. Criteria for the selection of the sample schooling population, and reasons for the sampling criteria, were as follows: • We sampled Grade 1 (urban only) and Grade 7 (urban and rural) children in public ordinary schools only. During the urban phase of the survey both Grade 7 and Grade 1 children were successfully surveyed. Upon commencement of the rural (town) survey several months later, however, it quickly became apparent that unlike their more urbanised counterparts, many Grade 1 children in the smaller towns did not understand what was being asked of them; alternatively, that they took much longer to complete the survey interview. The time lapse thus facilitated this critical methodological review. For this reason a decision was taken to drop the Grade 1s from the rural survey. • We sought to ensure geographic spread of schools in order to cater for possible local- and district-level (EMDC) variation and to ensure representivity. The urban (Greater Cape Town) survey was conducted in
1999/2000, before the WCED’s area offices had been replaced by the new districts, termed Education Management Development Centres (EMDCs). The urban survey included a few schools that subsequently fell under the West Coast/Winelands EMDC, notably those in Stellenbosch and Paarl. The rural survey, by contrast, took place after the re-demarcation. An analysis by EMDC could therefore only be undertaken in relation to the latter survey. All the biggest (i.e. medium-sized and some smaller) towns were covered by the survey. Our surveyed rural/town schools are situated in or near the following towns: Beaufort West, Bredasdorp, Caledon, Ceres, George, Knysna, Malmesbury, Montagu, Mossel Bay, Oudtshoorn, Riversdale, Robertson, Saldanha, Swellendam, Touws River, Vredenburg, Worcester. • Diversity of schools in terms of language medium (LoLT), according to information provided by the WCED’s Education Management Information Centre (EMIS) database was an important criterion. All schools in the province are classified by language medium, i.e. single medium, parallel medium, or dual medium. While the terms themselves are often misunderstood (see PRAESA 2002), they do provide some basis for purposive sampling. • A cross-section of schools by former education department was deemed necessary to ensure a representative distribution of children, since schools in post-apartheid South Africa continue to largely reflect apartheidera divisions by (former) ‘racial’ classification, officially non-racial policies notwithstanding. These divisions still largely overlap with language and social class divides, particularly in the case of ex-DET and ex-CED schools. Ex-HoR, ex-DET and ex-CED schools were sampled in a ratio of 3:1:1 to reflect the proportion of schools in the province as a whole. • In the rural/town survey, between one and three teachers per school were asked to complete an teacher questionnaire. This was done to ascertain the following: (i) the language repertoire of teachers, (ii) the extent of the home language (mis)match between children and teachers, and the (mis)match between teachers’ HL and the LoLT, (iii) the teachers’ subjective sense of preparedness to teach bilingually, and (iv) the teachers’ sense of the degree of language awareness at the school, measured by the school’s engagement with the LiEP. In the event, teachers were selected randomly, in most cases by the principal, depending on their availability at the time of our visit. The translated questionnaires were printed in multiple copies. Data processing and analysis was done through automatic scanning techniques at the University of Tilburg. Due to the requirements of automatic processing, it was essential that printed rather than photocopied questionnaires be used. Uniformity, in both content and form, was important for convenience
44
Language policy implementation and language vitality in Western Cape primary schools
2.5 Sampling, data collection and processing
PRAESA – Occasional Papers No. 15
45
in data processing. When this rule was unwittingly broken by the PRAESA researchers, the automatic scanning could not take place, and much time was lost before the data were eventually captured manually in Cape Town. A letter of permission to approach the schools was granted by the Western Cape Education Department. In each school, the printed questionnaires were distributed and administered by the PRAESA researchers/ fieldworkers themselves, to enhance reliability of response. In some schools, class teachers assisted freely. In total, 6625 children and 80 teachers across 112 primary schools were surveyed over the period 1999–2002. Insofar as this is a representative, purposive sample, conclusions can fairly be generalised to the whole province. Table 2.5 gives an overview of the three databases. Urban children’s survey
Rural towns children’s survey (Greater Cape Town)
1586 Grade 1
Rural towns teachers’ (teachers’) survey 80 teachers
1791 Grade 7
3173 Grade 7
49 schools
63 schools
45 schools*
Table 2.5: Statistical overview of the various sample populations * For logistical reasons teachers could be surveyed in only 71% of the schools visited. These schools overlapped with those for the rural/town children’s survey
Data processing was done centrally at Tilburg University. Given the large size of the database, an automatic processing technique based on specially developed software and available hardware was developed and utilised. By means of this automatic processing technique, for example, the entire batch of 3452 forms comprising the urban survey could be scanned in a day. Because some questionnaire items were answered in handwriting by the children, additional verification of these items had to be done using character recognition software. After scanning and verification was completed, the database was analysed using the SPSS programme. Four different phases were involved in data processing, namely • Phase 1: Design, testing and printing of the questionnaires • Phase 2: Scanning, interpretation, and verification of the data • Phase 3: Coding, preparation and analysis of the data • Phase 4: Reporting of the results in the format of tables and figures.
Chapter 3 Findings from the urban (Greater Cape Town) survey 3452 children across 49 primary schools participated in the main study of the urban (Greater Cape Town) language survey. The sample consisted of 1641 boys and 1707 girls. For 104 children the gender was unknown. There were 1586 children in Grade 1 and 1791 children in Grade 7. For 75 children the Grade was unknown. For purposes of this report the two Grade groups will be treated separately and alongside each other, in order to facilitate comparison and contrast. In this chapter we highlight key findings before assessing the extent to which our hypotheses were confirmed. More detailed findings for the respective home-language and exdepartment groups are to be found in the following chapters. An analysis of results by gender (sex) was undertaken, but yielded no differences between boys and girls with regard to any of the language status (vitality) indicators. These results will therefore be left out of consideration. Note that throughout this report multiple responses were permissible for many questions, and also that percentages have been rounded off. This means that the totals do not always come to 100%. For layout purposes the prefixes for the names of African languages, notably of isiXhosa, have been excluded in the Tables that follow.
Fig.3: Urban or metropole EMDCs (districts), Western Cape. The great majority of schools covered by the urban (Greater Cape Town) survey fall within the Metropole EMDCs. (Source: MAPS Cape Town n.d.)
46
PRAESA – Occasional Papers No. 15
Language policy implementation and language vitality in Western Cape primary schools
47
3.1 Language at home
Afrikaans
Inventory of home languages The findings show that Greater Cape Town houses three main home languages and fifteen other, smaller home languages. The numerical superiority of English over Afrikaans as the most widely reported home language (henceforth HL) is unexpected in the light of known HL data. Equally unexpected is the extent to which isiXhosa is reportedly used, eclipsing even Afrikaans amongst younger respondents. Afrikaans
508
32%
English
667
42%
Xhosa
613
39%
Sotho
49
3%
Arabic
12
–
German
2
–
Gujarati
1
–
Italian
1
–
Japanese
1
–
19
1%
2
–
Tswana Zulu
51%
Gujarati
–
–
1010
56%
Indian (sic)
1
–
Xhosa
591
33%
Italian
1
–
Sotho
80
4%
Japanese
–
–
Arabic
14
–
Portuguese
1
–
Chinese
2
–
Spanish
1
–
Dutch
3
–
Tswana
21
1%
French
5
–
Venda
1
–
German
1
–
Zulu
28
2%
Table 3.1.2: Inventory of home languages, urban Grade 7 (N = 1791) group
Table 3.1.1: Inventory of home languages, urban Grade 1 (N = 1586) group
The Grade 1 group is marked by three large home languages, with none having an absolute majority. English (42%) is marginally ahead of isiXhosa (39%), with Afrikaans a few percentage points behind (32%). Only 5% report the presence of other home languages, of which Sesotho is the largest (3%). As in the case of their younger peers, English reportedly remains the most widely-used home language amongst the Grade 7s (56%). However, there are also differences. Firstly, Afrikaans is now in second place (51%), substantially ahead of isiXhosa (33%). Secondly, the higher figures for both English and Afrikaans point to a much higher incidence of bilingualism and multilingualism in the homes of the Grade 7s. Details follow under language repertoire, below. Meanwhile, some 9% of homes use other languages, of which Sesotho accounts for half.
48
908
English
PRAESA – Occasional Papers No. 15
In general, the Grade 1 and Grade 7 groups have remarkably dissimilar home language profiles. There are two possible explanations for this. Either the Grade 7s use the language(s) they have learnt at school when they are at home; and/or they become much more attuned to the variety of languages they hear at home than the Grade 1s, and tend to regard a language as a HL even if relatively little use is made of it. The survey questionnaire provided space for multiple home languages. It should be borne in mind that the phrasing of the question (‘Which language/s are used in your home?’) left open the possibility, even likelihood, that respondents hear language varieties at home that they do not actually speak to anyone in the home. The results for the inventory of home languages only partially support our hypothesis. (a) We did indeed find three major home languages, namely Afrikaans, English and isiXhosa, although we found fewer smaller home languages than expected. (b) We did not expect to find that English has replaced Afrikaans as the most widely used home language amongst primary school children in the metropolis, something that could indicate the existence of a language shift. Equally unexpected was the ascendancy of isiXhosa over Afrikaans amongst younger (i.e. Grade 1) respondents. (c) We had not anticipated such major differences between the Grade 1 and Grade 7 cohorts. The explanation may lie in the greater language repertoire Grade 7 children enjoy on account of their schooling. Language repertoire As indicated above, figures for language repertoire show the high number of bi-/multilingual homes from which our respondents come. They also show substantial differences between the Grade 1 and Grade 7 cohorts. Language policy implementation and language vitality in Western Cape primary schools
49
Xhosa only
Afrikaans
535
34%
English only
367
23%
English
259
16%
220
14%
Afrikaans only Xhosa Afrikaans
106
7%
other
38
2%
21
1%
21
1%
Xhosa English
Afrikaans
other
other
English
Xhosa
13
1%
English
Xhosa
3
–
Afrikaans English
Xhosa
other
2
–
Xhosa
other
1
–
Table 3.1.3: Language repertoire, Grade 1 urban group
(N = 1586)
Among the Grade 1s, isiXhosa has the highest exclusive use value in absolute terms (535 of 1586, or 34%), followed by English (23%). Homes in which solely Afrikaans is spoken (14%) are slightly outnumbered by bilingual Afrikaans/English homes (16%). Some 7% of Grade 1s hear only ‘other’ languages at home. The remaining 6% of homes are bi- or multilingual in various combinations.
Relative to the number of home-language speakers, Grade 1 figures show isiXhosa to have a very high exclusive-use rating (87%), with English considerably less so at 55% and Afrikaans further back at 43%. This indicates that Xhosa-speakers are more protective of their home language than many Afrikaans-speakers and English-speakers, for whom the boundaries between the two languages are more permeable. (For a more detailed disaggregation by home-language group, see 3.3.) Afrikaans
English
554
31%
308
17%
257
14%
225
13%
122
7%
Other
120
7%
Other
61
3%
43
2%
26
1%
Xhosa only Afrikaans only English only English
Xhosa
Xhosa Afrikaans
English
Xhosa
English
Xhosa
Afrikaans Afrikaans
Other
23
1%
English
Xhosa Other
19
1%
English
Other
17
1%
Xhosa
Other
8
0%
Xhosa
Other
6
0%
2
0%
Unilingual homes
1228
77%
Afrikaans
Bilingual homes
352
22%
Afrikaans
6
–
Afrikaans
Other
Table 3.1.6: Language repertoire, urban Grade 7 group
(N = 1791)
Multilingual homes
Table 3.1.4: Overview of home-langu ag e combinations, urban Grade 1 group
(N = 1586)
This means that over three-quarters (77%) of all Grade 1s are reportedly exposed to only one home language, 22% to two home languages, and fewer than 1% to three home languages. That is to say, almost onequarter of urban Grade 1s come from bi-/multilingual homes. Home language (HL)
Exclusive HL Count
% of HL
Xhosa
613
535
87%
English
667
367
55%
Afrikaans
508
220
43%
Table 3.1.5: Language repertoire in relation to home language, urban Grade 1 group
50
English
Figures for the Grade 7 group reveal that exlusive use of the three main languages is limited to relatively few homes, and that sole home use of all three languages falls within a narrow band of between 17% (isiXhosa) and 13% (English). All three languages thus have a low exclusive-use rating. Both Afrikaans and English appear far more often in combination with each other (31%) than alone, and English and isiXhosa in combination are used in 7% of homes, confirming that many Cape Town homes are at least bilingual. An interesting statistic is that ‘other’ languages feature in some 14% of homes, more often than not in combination with one or more of the ‘big three’.
(N = 1586)
PRAESA – Occasional Papers No. 15
Language policy implementation and language vitality in Western Cape primary schools
51
Unilingual homes
910
51%
Bilingual homes
779
44%
Multilingual homes
102
6%
Table 3.1.7: Overview of home-language combinations, urban Grade 7 group
(N = 1791)
Among the Grade 7s, therefore, exclusive use of one language is limited to just over half of all homes (51%), while concurrent use of two or more languages occurs in the remaining 49% of homes. The proportion of bi-/ multilingual homes is thus more than double that for the Grade 1s, something that requires further investigation. Home language (HL)
Exclusive HL
For the Grade 1s , the reported patterns of language choice for the family and community domains are generally stable. English and isiXhosa are used by similar proportions of Grade 1 respondents for interaction with the mother, father, siblings, grandparents, shopkeeper, best friend, and church (in the case of isiXhosa), with figures between 37% and 40%. The only difference of note is that in the religious domain, English is used by relatively fewer Grade 1s (33%). The pattern for Afrikaans is similar, although figures are much lower at between 22% and 23% for all domains except the religious domain, which is slightly lower (20%). These figures suggest that most Grade 1 respondents use the same language with their significant others; concomitantly, very few use more than one language with any one interlocutor (the totals for each barely add up to 100%). Grade 1s in Greater Cape Town, it seems, are essential unilingual, although not necessarily monolingual.
Count
% of HL
590
308
52%
Mother
367
23%
634
40%
609
38%
Afrikaans
906
257
28%
Father
369
23%
607
38%
602
38%
English
1005
225
22%
Brothers/sisters
355
22%
585
37%
608
38%
Grandparents
367
23%
588
37%
605
38%
Shopkeeper
351
22%
598
38%
634
40%
Best friend
367
23%
619
39%
631
40%
Religious
310
20%
517
33%
624
39%
Xhosa
Table 3.1.8: Language repertoire in relation to home language, Grade 7 urban group
Afrikaans
(N = 1791)
In relation to the number of speakers for the respective home languages, the exclusive-use rating for isiXhosa (52%) is higher than for Afrikaans (28%) and English (22%) combined. However, all three figures are much lower than for their Grade 1 counterparts, suggesting the threat of a loss of vitality for all three home languages as children progress through school. It is only in combination with other data that it is possible to see that the threat is not to English but to Afrikaans and, to a lesser extent, to isiXhosa. Our hypotheses on language repertoire were confirmed. (a) As expected, we found a very high incidence of Afrikaans-English bilingual homes (or language concurrence) amongst our respondents, particularly at Grade 7 level. (b) We also found, as expected, that Xhosa-speakers come from mainly unilingual homes, i.e. isiXhosa has a high exclusive use value in the home. (c) The differences between the Grade 1 and Grade 7 cohorts were unexpectedly large, however, and point to the need for more qualitative follow-up studies.
English
Table 3.1.9: Language choice, urban Grade 1 group
Xhosa
(N = 1586)
Language choice In accordance with the figures for home language use, in the urban areas English is most often reported as the language of choice across the domains of family and community interaction. There are nevertheless significant differences within these domains, according to interlocutor.
The Grade 7 group differs from the Grade 1 group in several ways. Firstly, figures for English and Afrikaans are significantly higher, while isiXhosa appears to be losing ground. English retains its position as the chosen medium of interaction with significant others, both within and particularly outside of the home, although Afrikaans records minor gains in relation to English. Secondly, there is noticeably more variation in the Grade 7 group in the case of English and Afrikaans. Figures for choice of English range from a high of 57% (shopkeeper) to a low of 39% (grandparents). The range is smaller in the case of Afrikaans, which is reportedly used by 36% of respondents in interaction with the best friend but by only 28% when going to church or mosque. Figures for isiXhosa remain stable across interlocutors at between 29% and 31%. Thirdly, for a minority of respondents interaction with some interlocutors occurs through the use of two languages. This is especially true of community domains (shopkeeper, best friend), where one in five (21%) Grade 7s use two languages.
52
Language policy implementation and language vitality in Western Cape primary schools
PRAESA – Occasional Papers No. 15
53
Afrikaans
English
Xhosa
Mother
559
31%
822
46%
557
31%
Father
537
30%
772
43%
534
30%
Brothers/sisters
578
32%
857
48%
541
30%
Grandparents
626
35%
703
39%
515
29%
Shopkeeper
592
33%
1029
57%
552
31%
Best friend
642
36%
965
54%
562
31%
Religious
495
28%
920
51%
538
30%
Table 3.1.10: Language choice, urban Grade 7 group
(N = 1791)
Grade 7 figures suggest the beginnings of a language shift from Afrikaans to English. More Grade 7s use English with their siblings (48%) than with their father (43%) and their grandparents (39%); concomitantly, fewer use Afrikaans with their siblings (32%) than with their grandparents (35%). No such differences emerge in the Grade 1 response patterns (see above). This implies the shift is happening rapidly, within the same generation, not just across generations, and points to the formative influence of schooling in the anglicisation of Afrikaans-speaking children on the Cape Flats. Language of the questionnaire The survey questionnaire was available in Afrikaans, English and isiXhosa to give respondents a meaningful choice, and to signal the ‘parity of esteem’ in which the three languages are officially held in the Western Cape. While Grade 1 children did not fill in the questionnaire themselves, they were asked by the fieldworker in which language they wanted to respond. The English version of the questionnaire was answered by half the Grade 1s (50%), the isiXhosa version by one-third (34%), and the Afrikaans version by 16%. This indicates that even young children in Greater Cape Town perceive English to be the most appropriate language for answering questionnaires in a formal schooling context. Grade 1
Grade 7
Afrikaans
256
16%
383
21%
English
790
50%
1020
57%
Xhosa
540
34%
388
22%
Table 3.1.11: Questionnaires filled in by language version, urban Grade 1
(N = 1586)
and Grade 7 (N = 1791) groups
54
PRAESA – Occasional Papers No. 15
This conclusion is reinforced in the case of the Grade 7s, more than half of whom (57%) completed the English questionnaire. The substantially lower figure for isiXhosa (22%) indicates a loss of prestige, both in relation to the isiXhosa figures for Grade 1 and in relation to English and Afrikaans. When the results are disaggregated by home language group (see Chapter 5), we see that the vast majority of isiXhosa HL Grade 1s answered the isiXhosa version of the questionnaire. However, almost one-third of the isiXhosa HL Grade 7 group elected to answer in English. Unsurprisingly, over half this group are from ex-HoR schools where English is more prevalent than in ex-DET schools; correlatively, most ex-DET respondents chose the isiXhosa-language version. Our language choice hypotheses proved mostly incorrect. While not unaware of the drive for English, we had underestimated the extent to which children in Greater Cape Town were opting for English in interaction and transaction with significant others. (a) We were not correct in assuming that language choice in interaction with family members would correspond largely to home language use; in fact, our respondents’ interactions with family members reportedly tended to be mostly unilingual, despite the high incidence of bilingual homes. (b) We were also wrong in assuming that Afrikaans would be the most widely chosen language of interaction amongst family members in Greater Cape Town. We had also not anticipated the major differences in language choice patterns between Grade 1 and Grade 7 respondents. Most important of all, we had not anticipated the emerging language shift to English in (formerly) Afrikaans-mainly families. Significant numbers of parents appear to be addressing their children in English, even though they (still) converse with each other in Afrikaans. (c) Our assumption that language choice in interaction with shopkeepers would show the commercial power of English at the expense of other languages was proved correct only in relation to the Grade 7s; Grade 1s tend to use English to the same extent with shopkeepers as with family members. This, in turn, illustrates young children’s limited buying power. In the African townships most transactions of a commercial, interpersonal and religious nature are still conducted in isiXhosa, pointing to its continued vitality in these domains. While no hypotheses were developed specifically in regard to choice of language version, it is evident that respondent’s choice of questionnaire is reflective of broader language status as well as language proficiency issues. Many of these will be taken up again in more detail. What is already evident is that the valorisation of English as the preferred language of the questionnaire comes at the expense of both Afrikaans and isiXhosa amongst primary-school children in Greater Cape Town. Language policy implementation and language vitality in Western Cape primary schools
55
Language proficiency The figures for self-reported language proficiency for both groups provide a useful subjective index of language proficiency levels, and illustrate the powerful position of English at primary schools in Greater Cape Town. Respondents were asked to state which languages they understand, speak, read, and write. Half (49%) of all Grade 1s report being able to understand English, and two-fifths understand Afrikaans (41%) and isiXhosa (40%), respectively. Concerning the productive dimension of speaking, 46% report proficiency in English, 35% in Afrikaans, and 40% in isiXhosa.
Afrikaans
English
Xhosa
Understand
1108
62%
1467
82%
608
34%
Speak
1017
57%
1349
75%
609
34%
Read
1159
65%
1551
87%
502
28%
Write
1129
63%
1498
84%
513
29%
Table 3.1.13: Language proficiency, urban Grade 7 group
(N = 1791)
The gap between reported understanding and speaking skills is noticeable in the case of Afrikaans (6%), less so for English (3%), and virtually non-existent for isiXhosa (0.2%). It suggests that around 100 Grade 1s come from bilingual (Afrikaans/English) homes in which parents and older siblings speak Afrikaans to each other, but not necessarily to the respondents. Among the Afrikaans HL and English HL Grade 1 groups (see Chapter 5), a high proportion claim oral/aural proficiency in both languages while very few report proficiency in isiXhosa. The isiXhosa HL Grade 1 group, by contrast, is practically monolingual. Unlike the Grade 1s, Grade 7 figures reveal the influence of schooling on respondents’ language proficiencies. Between 75% and 87% report English proficiency, between 57% and 65% report Afrikaans proficiency, and between 28% and 34% report isiXhosa proficiency, suggesting the continuation of the apartheid-era valorisation of English and, to a lesser extent, of Afrikaans at the expense of isiXhosa. Similarly to their younger schoolmates, the vast majority of Afrikaans HL and English HL Grade 7 respondents report bilingual proficiency; yet relatively few (between 10% and 20%) claim proficiency in isiXhosa also (see Chapter 5). The Grade 7 isiXhosa HL group, too, is reportedly bilingual – this time in the isiXhosa/ English combination. This is of course not surprising, given the lionisation of English in the schooling system. Somewhat paradoxically, however, those claiming reading proficiency in Afrikaans (48%) are more than twice the number of those who reportedly understand the language (23%). This may point to the limited access to Afrikaans outside the classroom, impoverished additional-language teaching methods, and the teacher’s own lack of proficiency in Afrikaans.
When the findings are further disaggregated by ex-department (see Chapter 6), significant differences emerge. We will concentrate on the isiXhosa home-language groups in the ex-DET and ex-HoR schools, as the comparison between them is particularly instructive. While all ex-DET primary schools offer isiXhosa as a language subject throughout, a significant number of Xhosa-speaking students are enrolled in ex-HoR schools where the language is either not taught, or is taught mainly orally. For this reason, Xhosa-speakers enrolled in ex-HoR schools tend to experience a form of home-language deprivation that expresses itself in low literacy (in relation to oracy) figures. In relation to their ex-HoR counterparts, ex-DET isiXhosa HL Grade 7 children are guaranteed at least a basic reading and writing proficiency in the HL, i.e. home-language maintenance. With regard to English, however, it is the ex-HoR group that expresses greater confidence in its oral/aural proficiency, probably because of the Englishmainly school milieu. Ex-DET respondents appear to suffer a chronic lack of confidence in their ability to speak English; and their understanding also lags far behind their reported reading proficiency. Afrikaans appears to be in a precarious position in ex-DET schools, judging from the extremely low reported oral/aural proficiency. The status of Afrikaans is somewhat higher in ex-HoR schools, where four times as many respondents report being able to understand Afrikaans; yet the total is still well below 50%, leading us to question whether the project of producing trilingual children can succeed without firm home-language foundations. Overall, the fact that reported speaking proficiency lags behind the other dimensions for English and for Afrikaans indicates the additional-language status of these two languages in some cases. The discrepancy between oral/ aural proficiency and reading/writing proficiency in the case of isiXhosa is a clear sign that HL Xhosa-speakers’ literacy development in the language is neglected. It suggests the continued low status of isiXhosa as a language of print, and the absence of a culture of reading and writing in the African languages. Many more respondents understand English and Afrikaans than the respective figures for ‘home language variety’ would indicate, while reported proficiency in isiXhosa matches the latter category. This suggests
56
Language policy implementation and language vitality in Western Cape primary schools
Afrikaans
English
Xhosa
Understand
652
41%
775
49%
639
40%
Speak
559
35%
737
46%
636
40%
Table 3.1.12: Language proficiency, urban Grade 1 group
(N = 1586)
PRAESA – Occasional Papers No. 15
57
that the schooling system successfully enables the learning of Afrikaans and especially English, but not of isiXhosa. For both groups, the fact that Afrikaans and English are being learned as second or additional languages by many children probably accounts for the ‘lag’ between understanding and speaking. The absence of such a ‘lag’ in the case of isiXhosa, together with the fact that the percentage of those speaking isiXhosa tallies with that of home language variety, indicates that very few respondents are learning isiXhosa as an additional language at school. Or if there are, they consider their proficiency levels to be too low to warrant mentioning under this rubric. Either way, the figure for isiXhosa reflects its lack of status in exHoR and ex-CED schools. Overall figures for language proficiency reinforce the notion that English is becoming increasingly dominant at primary schools. The vitality of English is assured, as measured by the numbers of those who reportedly understand it. A less certain future awaits Afrikaans and isiXhosa in the long term, both of which appear to be losing ground. It should be stressed that the fundamental reason for this state of affairs is the de facto lower status of Afrikaans and isiXhosa in relation to English, both locally and nationally, official policies on multilingualism notwithstanding. Our language proficiency hypotheses were largely confirmed. (a) Our expectation that reported proficiency in speaking amongst our urban Grade 1 sample would broadly match home-language use proved correct. What was unexpected was the enormous impact of English on Afrikaans-speakers and Xhosa-speakers by Grade 7, measured by reported English proficiency levels for all three language groups. (b) Reported literacy levels in the home language amongst the Grade 7 isiXhosa HL group did turn out to be low, particularly amongst those enrolled in ex-HoR schools. Also remarkable is the low number of Afrikaans HL and English HL children reporting (third-language) proficiency in isiXhosa. Language dominance and language preference Patterns of language dominance and language preference within the Grade 1 group are likely to be more reflective of the home than of the school environment. Afrikaans
English
Xhosa
Slightly more respondents report English to be the language they speak best (41%) than those who report being able to speak isiXhosa best (38%), with only one in five (20%) reportedly speaking Afrikaans best. When Grade 1 responses are disaggregated by home language group (see Chapter 5), it emerges that the dominance of isiXhosa amongst the isiXhosa HL group is greater than the dominance of English amongst the English HL Grade 1 group, which in turn is substantially greater than the dominance of Afrikaans amongst the Afrikaans HL Grade 1 group. In regard to the language dominance indicator, therefore, isiXhosa has the greatest vitality of the three languages amongst the Grade 1s. Concerning language preference, English has more vitality amongst our Grade 1 respondents (57%) than Afrikaans (28%) and isiXhosa (22%) put together. Of the three home-language groups the Afrikaans and English groups reportedly prefer to speak Afrikaans and English, respectively (see Chapter 5). Within the Grade 1 isiXhosa HL group, however, more children reportedly prefer to speak English rather than their home language, if only by a small margin (3%). The majority of these, significantly, are those attending ex-HoR schools (see Chapter 6), where the influence of English is greater and the status of isiXhosa likely to be lower than in exDET schools. Among the ex-CED Afrikaans HL Grade 1 group, slightly more prefer English (54%) than Afrikaans (50%). Afrikaans (23%) is the language not liked by the highest number of Grade 1 respondents, followed by isiXhosa (14%) and English (10%). What is remarkable is that more than half the Grade 1s (53%) did not answer this question, implying the majority of young children in our sample have not yet acquired outspoken language attitudes. Of those who did express some language antipathy, Afrikaans HL and English HL speakers both fingered isiXhosa, while isiXhosa HL and English HL speakers both fingered Afrikaans; English is the only language that escaped relatively unscathed. Among the Grade 7 cohort, on the other hand, the influence of schooling with regard to language dominance and preference is clearly visible. Afrikaans
English
Xhosa
Speak best
479
27%
941
53%
474
26%
Speak best
319
20%
650
41%
609
38%
Most like to speak
567
32%
1163
65%
181
10%
Most like to speak
441
28%
897
57%
343
22%
Do not like (to speak)
577
32%
101
6%
580
32%
Donotlike(tospeak)360 23%
164 10%
226 14%
Table 3.1.14: Language dominance and language preference, urban Grade 1 group (N = 1586)
58
PRAESA – Occasional Papers No. 15
Table 3.1.15: Language dominance and language preference, urban Grade 7 group (N = 1791)
For more than half our Grade 7 respondents (53%), English is reportedly their strongest language, followed at some distance by Afrikaans Language policy implementation and language vitality in Western Cape primary schools
59
(27%) and isiXhosa (26%). Particularly the latter appears to lose out in the course of schooling, as isiXhosa dominance figures for Grade 7 are much lower than for Grade 1. A more detailed analysis (see Chapter 5) reveals that the home language is dominant in the case of the isiXhosa HL and English HL Grade 7 groups (around 75% for both). Somewhat anomalously, however, the principle of home-language dominance does not apply to the Grade 7 Afrikaans HL group, for most of whom English is reportedly the language they speak best. The anomaly is largely explained by the fact that the majority of our Afrikaans HL Grade 7 respondents were schooled through the medium of English, as we show in more detail in Chapter 5. A further breakdown per ex-department (see Chapter 6) tells us that within the isiXhosa HL group it is those who attend ex-HoR (as opposed to ex-DET) schools whose home-language dominance is steadily eroded. Under conditions where isiXhosa is marginalised in linguistically diverse schools, it follows that the language will suffer a loss of vitality. English is overwhelmingly preferred as the language Grade 7 respondents most like to speak (65%), followed by Afrikaans (32%) and isiXhosa (10%). Once again isiXhosa appears to be suffering a significant loss of vitality in the course of schooling, the attitudinal correlative to its status as a mere transition to English in most cases. English is preferred by all three HL groups, most manifestly at the expense of isiXhosa and, to a lesser extent, of Afrikaans (cf. 3.3). Paradoxically it is the ex-DET isiXhosa HL group, rather than its ex-HoR peer group, that most favours English (cf. 3.4). Even the ex-CED Afrikaans HL Grade 7 group collectively prefers English (68%) over Afrikaans (42%) by a considerable margin, pointing to a loosening of the traditional ties between language and identity for ‘white’ Afrikaans-speakers or ‘Afrikaners’ (see Giliomee 2003). Compared to the Grade 1 cohort, there is a strong increase in antipathy towards isiXhosa (32%) and Afrikaans (32%) among the Grade 7s, while very few reportedly do not like (to speak) English. Only 30% of children chose not to answer this question. There is a similarly strong antipathy (around 40%) towards isiXhosa on the part of the Afrikaans HL and English HL Grade 7 groups. The results show an even stronger aversion to Afrikaans reported by the isiXhosa HL group (over 50%) in both ex-DET and ex-HoR schools. Our language dominance and language preference hypotheses turned out to be only partially correct. Our prediction (a) that Afrikaans would be the dominant language in the Greater Cape Town area was proved false. As we have seen, English is reportedly dominant particularly amongst the Grade 7 cohort. On the other hand, we were largely correct in predicting (b) a preference for English amongst all three home language groups, particularly amongst English-HL and isiXhosa-HL
speakers. It seems clear that English tends to acquire increasing status through schooling. This probably has less to do with any inherent love for the language, and more with its perceived instrumental value in providing access to formal education, the job market, and social mobility (see Vesely 2000). IsiXhosa, on the other hand, appears to be suffering a significant loss of vitality by the time children reach Grade 7 – no doubt a reflection of its status as a mere transition to English. Respondents’ attitudes towards Afrikaans demonstrate some ambivalence – indicative, perhaps, of its changing status in a multilingual society increasingly dominated by English. Only the Grade 1 Afrikaans HL group expressed a preference for Afrikaans. (c) The expected preference for Afrikaans amongst ex-CED (‘white’) Afrikaans-dominant speakers did not materialise, illustrating a loosening of the historical-cultural links between language and identity in that constituency. (d) As expected, we found considerable antipathy towards Afrikaans amongst Xhosa-speakers and, to a lesser extent, among English-speakers, particularly at Grade 7 level. The high negative rating for Afrikaans amongst Xhosa-speakers probably has more to do with its demise as a public language (Giliomee 2003), although the collective memory of the historical role of Afrikaans in enforcing apartheid may also have contributed. Finally, as expected, we discovered (e) negative language attitudes towards isiXhosa amongst Afrikaans-HL and English-HL speakers, particularly at Grade 7 level – again pointing to the insidious influence of schooling and ultimately of a society in which most of the language practices and attitudes continue to reflect the apartheid era.
60
Language policy implementation and language vitality in Western Cape primary schools
PRAESA – Occasional Papers No. 15
3.2 Language at school Language subjects At Grade 1 level, the majority of respondents report that they are learning English at school (57%), followed by isiXhosa (24%) and Afrikaans (21%). A small minority are taught in Sesotho (3%) and Setswana (1%). It seems clear that almost all Grade 1 children are formally exposed to only one language at school. With regard to (other) languages they would like to learn at school, the ‘big three’ are the main ones mentioned: two in five (40%) indicate isiXhosa, one-quarter (24%) English, and 18% Afrikaans. This means that at Grade 1 level Afrikaans is the least popular of the three major languages, by a considerable margin. Few respondents expressed interest in learning Sesotho (2%) and Setswana (1%). In general, therefore, Grade 1s appear to know little about other languages outside of their immediate environment, and hence show little desire for learning them.
61
Language variety
Languages learned at school
Other languages respondents
Language variety
Languages learned at school
would like to learn at school Afrikaans
336
21%
293
18%
English
902
57%
384
24%
Xhosa
385
24%
641
40%
Sotho
47
3%
36
2%
Tswana
22
1%
20
1%
Zulu
1
–
1
–
German
2
–
1
–
Sign lang.
1
–
–
–
French
–
–
2
–
Spanish
–
–
1
–
Arabic
–
–
1
–
Bantu [sic]
–
–
1
–
Other languages respondents would like to learn at school
English
1596
89%
344
19%
Afrikaans
1447
81%
273
15%
Xhosa
771
43%
641
36%
French
58
3%
271
15%
Sotho
45
3%
67
4%
Tswana
17
–
16
–
Zulu
14
–
79
4%
German
6
–
118
7%
Spanish
8
–
34
2%
Italian
8
–
35
2%
Chinese
3
–
38
2%
Arabic
3
–
52
3%
Table 3.2.1: Languages learned at school, and other languages respondents would
Venda
2
–
3
–
like to learn at school, urban Grade 1 group
Portuguese
–
–
9
–
Greek
–
–
6
–
Russian
–
–
2
–
Japanese
1
–
7
–
Hebrew
–
–
1
–
Korean
–
–
2
–
Ghanese [sic]
–
–
1
–
Dutch
1
–
18
1%
Ndebele
1
–
1
–
Latin
1
–
13
–
(N = 1586)
By Grade 7, however, nine out of ten respondents are learning English (89%), eight out of ten are learning Afrikaans (81%), and some 43% are learning isiXhosa – a surprisingly large number, given the known low status of isiXhosa in schools. A possible explanation is that many respondents included their informal learning of isiXhosa from peers, in addition to formal learning of isiXhosa as a school subject. A closer look (cf. Chapter 6) enables us to identify ex-DET isiXhosa HL Grade 7s as the main group who are learning three languages: some three out of five are learning a third language (Afrikaans), in addition to isiXhosa and English. Only 36% of their ex-HoR peers, by contrast, are exposed to all three languages; the majority do not only have no curricular access to their home language (isiXhosa), but are compelled to take their second language (English) at first-language level and their third language (Afrikaans) at second-language level – a classic case of ‘subtractive multilingualism’. Taken as a whole, language learning practices represent a continuation of the apartheid-era practice of valorising English/Afrikaans bilingualism at the expense of African languages.
62
PRAESA – Occasional Papers No. 15
Table 3.2.2: Languages learned at school, and other languages respondents would like to learn at school, urban Grade 7 group
(N = 1791)
The pattern for other languages Grade 7 respondents would like to learn at school is remarkably similar to that of their younger peers. The wish to learn isiXhosa is greatest (36%), followed by English (19%) and Afrikaans Language policy implementation and language vitality in Western Cape primary schools
63
(15%). In other words, the majority of those not yet learning isiXhosa would like to learn it at school. This applies to the Afrikaans HL group and (to a lesser extent) to the English HL group (see Chapter 5) – a cheering statistic for those committed to phasing in third-language tuition in Western Cape primary schools. There is some support also for the learning of French (15%) and German (7%), both prestigious European languages. Other African languages mentioned in this category include Sesotho (4%), isiZulu (4%), and Arabic (3%). While the desire to learn other languages is larger among the Grade 7s than among their younger peers, it has a definite eurocentric bias, and the overall interest in learning African languages (isiXhosa excepted) is small. Turning to our hypotheses pertaining to language subjects we did find, as predicted, that (a) residues of apartheid-era language subject practices remain evident, i.e. that Afrikaans- and English-speakers were taking Afrikaans and English as subjects, but that Xhosa-speakers were taking isiXhosa, English, and Afrikaans. We had, however, overlooked the home language deprivation endured by Grade 7 isiXhosa HL respondents in ex-HoR schools, where isiXhosa is mostly not offered. We were too pessimistic in forecasting (b) that there would be little interest amongst English- and Afrikaans-speakers in learning isiXhosa or other African languages. It turns out many are open to learning isiXhosa, particularly at Grade 7 level, making the ground fertile for the introduction of third-language tuition. (c) Besides the three official provincial languages, we unexpectedly found very little interest in learning other languages, even amongst Grade 7 urban respondents. The flickering of interest in learning Sesotho probably stems from the fact that the Western Cape has a number of Sesotho-speakers and at least two Sesotho-medium primary schools. The interest in French presents an argument for the expansion of this language as a subject in urban schools. Language of teaching (Grade 1) More than half of all Grade 1 respondents (58%) report that their teacher talks to them in English. 23% report the teacher to be using isiXhosa when addressing them, and 17% report the teacher to be speaking Afrikaans. This effectively identifies English as the main language of teaching (LoT) at Grade 1 level, an oversubscription if respondents’ language use with the mother is taken as a yardstick. Considerable dissatisfaction at this state of affairs is evident in the high number (568, or 36%) who would prefer their teacher to address them in isiXhosa. A ready explanation is that this latter figure corresponds closely to the number of Grade 1s who reportedly speak isiXhosa to their mother (38%). Concomitantly, fewer respondents (6%) want to be addressed in English. Figures for respondents’ preference for Afrikaans use by the teacher largely correspond with the actual use pattern at around 17–18%.
64
PRAESA – Occasional Papers No. 15
Teacher speaks
Would like teacher to speak
Afrikaans
271
17%
290
18%
English
926
58%
832
52%
Xhosa
371
23%
568
36%
Table 3.2.3: Current and preferred language of teaching, urban Grade 1 group
(N = 1586)
More detailed analysis reveals that it is the ex-HoR isiXhosa HL cohort for which the disjuncture between HL and LoLT is greatest, and which prefers to be taught in isiXhosa (see Chapter 6). By contrast, a small but significant minority of ex-DET isiXhosa HL respondents (14%) would prefer to be taught in English; currently, almost all are taught through their HL. In regard to our hypothesis about the teacher’s language use (Grade 1): we were right in predicting that (a) most Grade 1s would be taught through the medium of their HL; and also that (b) in cases of language mismatch, those affected would want their teacher to address them in their HL. It is evident that already at Grade 1 level there is considerable dissatisfaction amongst Xhosa-speakers in ex-HoR schools with the mismatch between their home language and the language of teaching. Put differently, the school’s valorisation of English at the expense of the HL is being experienced as problematic by its very youngest clients. Ex-HoR schools had better take heed. Language of teaching and of assessment (Grade 7) When asked about the language of teaching for content subjects such as Maths and Science, the vast majority of Grade 7s (73%) indicate this to be English. The proportion of those who like the use of English in this (oral) context is 67%, some 6% fewer. A substantial minority report the language of teaching to be Afrikaans (27%), which is similarly preferred by 6% fewer respondents (21%). A small minority claims that the maths and science teacher uses isiXhosa (8%). However, twice as many respondents would prefer isiXhosa as LoT in these subjects (16%). Afrikaans
English
Xhosa
Language of teaching (LoT)
491
27%
1307
73%
149
8%
Preferred LoT
369
21%
1199
67%
295
16%
Language of assessment (LoA)
671
37%
1405
78%
233
13%
Preferred LoA
383
21%
1194
67%
348
19%
Table 3.2.4: Languages used and preferred for teaching and assessment in content subjects, urban Grade 7 group (N = 1791) Language policy implementation and language vitality in Western Cape primary schools
65
With regard to the reported language of tests and exams in the content subjects, all three languages record increases of between 5% and 10% over the reported language of teaching. English is used (78%) and preferred by the overwhelming majority (67%), followed by Afrikaans (37% and 21%), and isiXhosa (13% and 19%). Two languages are reportedly used simultaneously for assessment in some 29% of cases, even though relatively little dual-medium teaching (9%) appears to be taking place. Relatively few (7%) respondents are in favour of bilingual assessment. When findings concerning assessment are broken down by HL group (see Chapter 5), it is apparent that many Afrikaans HL and most isiXhosa HL respondents are dissatisfied with current practices. The Afrikaans HL group would like to see considerably less use made of English, and also much less use made of Afrikaans for content subject tests and exams. The isiXhosa HL group, by comparison, would like far less use made of English, and concomitantly far more use made of isiXhosa – although English remains the preferred LoA for two-thirds, and isiXhosa for one-third of respondents. Inregardtocontent subjects, we were correct in hypothesising (a) that disjunctures would exist between the LoLT and the home languages of many Grade 7 children, in regard to both teaching and assessment. We found this amongst both isiXhosa HL and Afrikaans HL speakers. (b) We were also right in predicting that in such cases of language mismatch many children would prefer to study through the medium of their HL. Perhaps the most important conclusion to be drawn from this is that over half of the Xhosa-speaking Grade 7 children realise they are being disadvantaged by being denied the educational use of their home language where it really matters, namely in tests and exams. A concomitant conclusion is that the widespread use of English as an assessment tool is not as popular amongst Xhosa-speaking children as might be expected from existing practice. On the other hand, we were not able to predict that although half the respondents have Afrikaans as a home language, many more than half prefer to be assessed not in Afrikaans, but in English. It turns out that most Afrikaans HL Grade 7s are already being taught through the medium of English. This trend illustrates a process of language assimilation into what is perceived to be the more economically useful or prestigious language, that may well be indicative of a language shift from Afrikaans to English amongst Afrikaans-speakers.
3.3 Urban home-language groups in comparison (overview)
66
Language policy implementation and language vitality in Western Cape primary schools
PRAESA – Occasional Papers No. 15
Grade 1 Table 3.3.1 provides a summary of results for the three major urban homelanguage groups (Grade 1). Language status
Sub-category
indicator
Afrikaans Gr.1
Xhosa Gr.1
HL group
HL group
HL group
(N = 505)
(N = 613)
(N = 664)
Afr Language repertoire
100 51
Exclusive HL use Language choice
44
3
2
100
39
Eng
Xho
100
2
–
–
–
–
87
–
55
–
67 42
5
3
3
97
19
89
2
Father
67 39
4
4
2
97
19
85
2
Brothers/sisters
63 38
4
3
1
98
17
81
2
Grandparents
67 37
4
3
0
98
20
82
2
Shopkeeper
62 38
4
2
1
98
19
82
2
Best friend
62 42
4
2
2
98
21
85
2
Religious contexts
55 35
5
1
2
97
18
70
2
Q’nnaire version
46 52
2
1
15
84
6
93
1
91 71
5
3
4
99
61
97
3
87 62
5
3
4
99
47
96
2
58 43
4
1
4
96
15
87
2
6
13
54
50
22
78
5
9 22
32
18
2
20
4
23
Speak Language dominance Speak best
Language at school
4
Eng Xho Afr
Mother
Language proficiency Understand
and preference
Eng Xho Afr
English Gr.1
Most like to speak
59 40
Do not like
12
Languages learnt
47 55
4
11
37
60
11
93
2
Want to learn
28 30 15
5
20
85
33
23
13
Teacher speaks
44 54
2
5
37
59
7
95
1
Prefer T to speak
51 50
3
2
25
91
12
91
1
Table 3.3.1: Comparative overview of urban Grade 1 home-language groups, in percentages
Home language repertoire. Afrikaans HL and English HL groups are virtually symmetrical: English is a major (additional) home-language for the
67
former, and Afrikaans occupies a similar position for the latter. IsiXhosa hardly features as an additional home language for either group. The isiXhosa HL group, by contrast, appears to be unilingual. The high degree of language concurrence or bilingualism in the homes of both Afrikaans HL and the English HL groups, and hence their relatively low exclusive-use language ratings, indicates the existence of a bilingual Afrikaans/English group alongside the Afrikaans-only and English-only groups. Language choice. The Afrikaans HL respondents are clearly more bilingual than English HL respondents in their interactions with others. More Afrikaansspeakers use English than English-speakers use Afrikaans. Almost all Xhosaspeakers choose isiXhosa. The dominance of English as a school language of choice amongst both English-speakers and Afrikaans-speakers is reflected in the high preference for the English version of the questionnaire. Language proficiency. The symmetry between the Afrikaans HL and English HL groups is manifest once more. The majority of Afrikaans HL speakers report being able to understand and speak English; and vice versa. This testifies to the high degree of bilingualism in the home, and to the exposure to both languages even in the first year of school. The Grade 1 isiXhosa HL group appears to be largely monolingual. Language dominance and preference. Here the symmetry between the Afrikaans HL and English HL groups, noted above, begins to break down. The English HL group is far more dominant in English than the Afrikaans HL group is dominant in Afrikaans, confirming the overall dominance of English. That language preference figures for the Afrikaans HL group mirror language dominance suggests that the oft-cited hegemony of English is not acquired at home or in the first year of schooling, but subsequently. This does not apply to the isiXhosa HL group, however, more of whom prefer English than isiXhosa. The single highest negative rating of any language is reserved for Afrikaans, by the isiXhosa HL group – indicative of considerable antipathy amongst Xhosaspeaking families towards Afrikaans for its lingering association with apartheid. Language at school . Stark differences between the English HL group and the other two groups underline the dominant position of English at school. Almost all English HL respondents report that their teacher addresses them in their home language. The figure for the isiXhosa HL is substantially lower (although still a majority), while the majority of the Afrikaans HL group are reportedly taught in English! Those most unhappy with the evident mismatch between home language and LoLT are the isiXhosa HL speakers, almost all of whom would prefer to be taught in their HL. Further analysis shows (see under ex-departments, below) that the language mismatch issue arises mainly in ex-HoR schools, the majority of whom have no Xhosa-speaking teachers. Unlike their English HL counterparts, most Afrikaans HL speakers and many isiXhosa HL speakers reportedly learn more than one language in their first year of schooling.
Grade 7 Patterns for the respective Grade 7 home-language groups are very different from those of their younger peers, as Table 3.3.2 summarises.
68
Language policy implementation and language vitality in Western Cape primary schools
PRAESA – Occasional Papers No. 15
Language status
Sub-category
indicator
Afrikaans Gr.1
Xhosa Gr.1
HL group
HL group
HL group
(N = 912)
(N = 597)
(N = 1012)
Afr Language repertoire Exclusive HL use
E n g Xho Afr
English Gr.1
E n g Xho Afr 31 100
E n g Xho
100
68
8
11
62 100
20
28
–
–
–
–
52
–
22
–
Language
Mother
56
50
7
5
22
91
28
71
17
choice
Father
53
48
7
5
16
87
25
67
16
Brothers/sisters
57
52
7
6
23
88
29
70
16
Grandparents
60
44
6
7
11
84
33
60
15
Shopkeeper
53
63
7
8
32
86
31
76
16
Best friend
60
58
7
8
29
88
35
74
16
Religious contexts
48
59
7
4
25
85
25
69
16
Q’nnaire version
39
57
3
6
32
63
13
77
10
Language
Understand
92
90 11
23
74
92
77
94
20
proficiency
Speak
89
86 10
19
59
94
66
92
20
Read
83
89
8
48
89
77
69
95
16
Write
81
86
8
41
83
77
67
93
17
Language
Speak best
45
57
6
8
28
76
19
74
14
dominance
Most like to speak
40
58
7
12
67
21
23
72
8
and preference
Do not like
16
7 42
54
6
8
29
3
40
Language
Languages learnt
87
88 29
69
91
69
85
90
44
at school
Want to learn
9
12 42
31
40
33
10
11
31
LoT in contents
43
59
3
14
84
22
20
83
6
Preferred LoT
28
62 10
16
66
35
14
74
10
Lang. of assessm.
53
72
4
25
81
34
32
86
8
Preferred LoA
32
62 11
14
65
43
17
76
12
Table 3.3.2: Comparative overview of urban Grade 7 home-language groups, in percentages
69
Home language repertoire. The symmetry between the Afrikaans HL and English HL groups continues into Grade 7 level. Similarly-sized majorities of the respective groups report the other language as a (second) home language, leading to low language exclusive-use ratings for both Afrikaans and English. Amongst isiXhosa HL speakers, the language exclusive-use value for isiXhosa is roughly twice that for the other groups. Language choice. English is the language of choice for most English HL speakers, for many Afrikaans HL speakers, and for a large minority of Xhosa-speakers (sometimes alongside isiXhosa) in interactions with significant others. Afrikaans is still used by a narrow majority of Afrikaans HL speakers with key interlocutors. Xhosa-speakers generally choose isiXhosa. Language proficiency. Large majorities in all three groups report proficiency in English, especially in the written domain, reflecting the curricular emphasis on English in schooling. All three groups report bilingual but not trilingual proficiency: Afrikaans/English for the Afrikaans and English HL groups, isiXhosa/English proficiency for the isiXhosa group. Third-language proficiency appears to be underdeveloped, especially in the oral/aural dimensions. Language dominance and preference. Although it is the dominant language for only two home-language groups, English is the preferred language for all three HL groups. The major discrepancy is evident amongst isiXhosa-dominant group, the vast majority of whom reportedly prefer to speak English above their home language. By contrast, there are almost no discrepancies between language dominance and language preference for the Afrikaans HL and English HL groups, respectively. The high negative ratings for Afrikaans amongst Xhosa-speakers, and for isiXhosa amongst Afrikaans- and English-speakers indicate ongoing polarisation along language and colour lines. Language at school. All HL groups are reportedly learning English at school, indicating the pre-eminent position of English in the curriculum and perhaps extra-murally. Afrikaans HL and English HL speakers are each learning their HL and the other language. But a large minority of Xhosaspeakers are not learning their HL at school. This figure correspondents with the number of those enrolled in ex-HoR schools, and points to the absence of isiXhosa as a subject in these schools. For majorities in all three HL groups, English remains the current language of teaching and of assessment. Minorities of Afrikaans-HL and isiXhosa HL respondents express a preference for the use of their HL for these purposes. Encouragingly, considerable numbers of Afrikaans- and English-speakers would like to learn isiXhosa.
70
PRAESA – Occasional Papers No. 15
3.4 Urban ex-department groups in comparison (overview) Grade 1 The similarities and differences between the different urban Grade 1 exdepartment groups are summarised in Table 3.4.1. Language status
Sub-category
indicator
Ex-HoR group
Ex-DET group
Ex-CED group
(N = 971)
(N = 385)
(N = 230)
Afr
E n g Xho Afr
E n g Xho Afr
E n g Xho
Language repertoire
44
49
25
2
1
93
30
81
6
Exclusive HL use
21
25
22
0
0
81
8
53
0
Language choice
Language proficiency
Mother
33
47
25
1
1
93
17
77
6
Father
33
45
24
0
1
92
18
74
5
Brothers/sisters 33
44
25
1
1
93
15
68
4
Grandparents
33
43
24
1
0
93
17
74
5
Shopkeeper
32
43
25
0
0
100 16
79
5
Best friend
34
44
24
0
1
99
16
84
5
Religious contexts 29
39
24
0
0
99
13
59
5
Understand
59
25
0
0
100 42
88
6
Speak Language dominance Speak best and preference
Language at school
57 51
55
25
0
0
99
29
88
6
29
47
24
0
0
95
14
82
4 6
Most like to speak 37
60
9
9
37
63
20
75
Do not like 24
16
25
21
2
11
4
29
Languages learnt 30
73
4
0
1
90
20
84
1
Want to learn
21
29
28
3
14
86
33
20
15
Teacher speaks
23
74
1
0
0
92
16
87
0
Prefer T to speak 26
58
22
1
15
90
14
86
2
8
Table 3.4.1: Comparative overview of urban Grade 1 ex-department groups, in percentages
Home language repertoire. Three dissimilar groups emerge: an ex-DET group where isiXhosa is overwhelmingly preponderant and has a high language exclusive-use rating in the home; an ex-CED group in which mostly English is spoken, with a substantial minority who also speak Language policy implementation and language vitality in Western Cape primary schools
71
Afrikaans at home; and an ex-HoR group almost equally divided between Afrikaans HL and English HL speakers, with a substantial Xhosa-speaking minority – collectively a trilingual group. Language choice. The differences alluded to above are reflected in the language choice dimension. Ex-DET Grade 1s are unilingual in their interactions with significant others. Most ex-CED respondents choose English, and a minority use Afrikaans for these purposes; and ex-HoR respondents are divided between those who use English, those who use Afrikaans and those who use isiXhosa. For all three ex-department subgroups, interactions with interlocutors are almost entirely conducted through one language only. Language proficiency. Ex-DET Grade 1s are reportedly entirely monolingual, reporting proficiency in isiXhosa only. Ex-CED Grade 1s are generally orally/aurally proficient in English, while a large minority also reportedly understand and speak Afrikaans. Ex-HoR respondents, meanwhile, consist of four almost equally strong groups: one proficient in Afrikaans only, a second in English only, a third in the Afrikaans/English bilingual combination, and a fourth in isiXhosa only. Language dominance and language preference. Figures for language spoken best largely correlate with those for language choice with family members, for all three ex-department groups. In particular, the language spoken with their mother is a good predictor of young children’s language dominance. The predilection for English becomes visible even at Grade 1 level, as we can see from the ex-CED and ex-HoR figures. Even a large minority of Xhosa-speaking children in both ex-DET and ex-HoR schools reportedly prefer English above their home language. Approximately half of all respondents across the three ex-departments report some kind of linguistic prejudice, either towards Afrikaans (ex-HoR and ex-DET), towards English (ex-DET) or towards isiXhosa (ex-CED). Language at school. English is reportedly learnt by most ex-CED and most ex-HoR Grade 1s; minorities in both groups report also learning Afrikaans at school. Ex-DET Grade 1s, it seems, are exposed to only one language at school (isiXhosa). Not surprisingly, these figures coincide with the language spoken by the teacher when addressing the children, i.e. with the LoLT. Again, it comes as no surprise to learn that Xhosaspeaking children in linguistically mismatched ex-HoR schools would prefer to be taught in their home language, not in English as at present.
there are major divides between the three ex-department groups, and some commonalities. Home language repertoire. The three ex-department groups show sharp contrasts. IsiXhosa is preponderant for the ex-DET group, English occupies a similar position for the ex-CED group, but the ex-HoR group is almost equally divided between HL Afrikaans and HL English speakers. Exclusiveuse values are low all round, signifying high numbers of bi-multilingual homes. IsiXhosa is the only language with an exclusive-use rating in exDET schools. English has a higher exclusive-use rating in ex-CED schools than in ex-HoR schools, where Afrikaans enjoys the greater exclusive use. Language choice. Interaction with the mother broadly corresponds to figures for home-language use across all three groups. However, respondents’ interactions with family members generally are somewhat more unilingual with regard to smaller (additional) languages spoken in the home, e.g. 25% of the ex-HoR group report isiXhosa as a home language, but only 16% reportedly speak isiXhosa to their mother. A similar pattern is observable for the use of English in ex-DET homes, and the use of Afrikaans in ex-CED homes, respectively. Also, respondents across all three groups reportedly use more English with their siblings than with their grandparents. By far the most English is used in interactions with the shopkeeper. Language proficiency. We see the continuing effects of differential resourcing and partial desegregation of schooling in the context of the dominance of English. The vast majority across all three groups report English literacy proficiency (reading, writing), but only ex-HoR and exCED respondents are equally confident of their oral/aural English proficiency. A majority of these two groups (especially ex-HoR) also report proficiency in Afrikaans, while relatively few report proficiency in isiXhosa. Ex-DET respondents, by contrast, show less confidence in their oral/aural proficiency in English; and for the vast majority, Afrikaans is a language they do not speak or understand (even though many claim to be able to read and write it).
The similarities and differences between the different urban Grade 7 exdepartment groups are summarised in Table 3.4.2. We see at a glance that
Language dominance and preference. The ongoing failure of multilingual education policies is most evident. English is dominant in ex-CED and (to a lesser extent) in ex-HoR schools, while isiXhosa occupies a dominant position amongst ex-DET respondents. Language preference figures for exCED and ex-HoR correspond almost exactly with language dominance figures for these groups. But for the ex-DET group, the huge preference for English (and to a much lesser extent, for Afrikaans) at the expense of isiXhosa is indicative of the hegemonic position of English in urban township schools.
72
Language policy implementation and language vitality in Western Cape primary schools
Grade 7
PRAESA – Occasional Papers No. 15
73
Language status
Sub-category
indicator
Ex-HoR group
Ex-DET group
Ex-CED group
(N = 1098)
(N = 414)
(N = 279)
Afr
Afr
Afr
Eng Xho
Eng Xho
Eng Xho
Language repertoire
44
49 25
7 23
91
38
72
5
Exclusive HL use
21
11
–
–
54
9
39
–
Language choice
Mother
45
50 16
3 17
89
20
73
4
Father
43
48 16
3 12
85
20
72
4
Brothers/sisters
47
52 16
3 17
86
19
78
3
Grandparents
48
43 15
4
7
81
29
73
4
Shopkeeper
46
61 14
3 22
93
26
95
4
Best friend
52
58 16
3 21
91
22
88
3
Religious contexts
39
57 16
2 22
86
22
74
4
Language proficiency Understand
80
87 19
12 68
91
66
82 10
Speak
75
83 19
12 50
91
51
84
9
Read
76
88 13
40 88
83
56
81
7
Write
76
86 13
33 78
83
58
84
8
37
56 13
4 21
77
20
86
3
Most like to speak 35
58 11
29 72
13
22
80
3
54
6
10
33
1 54
Language dominance Speak best and preference
Language at school
7
Do not like
24
6 35
Languages learnt
86
86 29
60 91
82
94
98 39
Want to learn
10
13 42
36 46
36
4
5 12
LoT in contents.
38
63
3
8 90
27
16
86
1
Preferred LoT
25
63 11
11 67
42
16
82
2
Lang. of assessm. 48
75
4
17 81
43
28
87
3
Preferred LoA
65 12
10 58
50
17
85
2
27
are reportedly learning Afrikaans as a third language alongside isiXhosa and English. The apartheid legacy is still evident in that the majority of ex-CED and ex-HoR respondents are not learning isiXhosa at school (although surprisingly large minorities reportedly are, and a large minority of ex-HoR respondents would like to learn isiXhosa). Furthermore, the main or preponderant language of teaching and of assessment in the content subjects is English for all three groups. Up to half of all Xhosa-speakers across ex-HoR and ex-DET schools would prefer to be taught and assessed in isiXhosa. In summary, the main commonality between the three ex-department groups is the powerful position of English in regard to reported proficiency, preference, and current use in school. The main divides are in regard to home language repertoire, language choice, language proficiency, and language dominance. It is clear that our ex-CED and ex-HoR groups have more in common with each other than either has with the ex-DET group. This is not just because ex-CED and ex-HoR schools have English and/or Afrikaans as majority home languages, but also because they have been partially desegregated. That (impoverished, overcrowded, often unstable) ex-DET schools remain largely unilingual and ‘black African’ in composition remains the most visible legacy of apartheid-era education.
Table 3.4.2: Comparative overview of urban Grade 7 ex-department groups, in percentages
Language at school. The legacy of apartheid is still evident, although there are signs that it is being partially overcome. With regard to languages learnt at school, all three ex-department groups valorise English; ex-CED and exHoR groups also lionise Afrikaans; and the majority of the ex-DET group
74
PRAESA – Occasional Papers No. 15
Language policy implementation and language vitality in Western Cape primary schools
75
Chapter 4
Afrikaans
Findings from the rural/town survey A total of 3173 Grade 7 children across 63 primary schools participated in the rural/town language survey. The sample consisted of 1542 boys and 1493 girls. For 138 children the gender was unknown. In this section, which builds on Braam et al. 2002, we highlight key findings before assessing the extent to which our hypotheses were confirmed. As in the case of the urban survey, a disaggregation of findings by gender (sex) was undertaken, but showed no discrepancies of any significance between boys and girls. These results will therefore be left out of consideration.
2494
79%
English
646
20%
Xhosa
660
21%
Sotho
27
1%
German
9
–
Zulu
4
–
Tswana
3
–
Italian
3
–
Greek
3
–
French
3
–
Spanish
1
–
Scottish
1
–
Portuguese
1
–
Polish
1
–
Norwegian
1
–
Table 4.1.1: Inventory of home languages, rural/town group (N=3173)
4.1 Language at home
From these data it is clear that there are three major home language varieties spoken in the rural/town areas of the Western Cape, namely, Afrikaans (79%), English (20%) and isiXhosa (21%), plus another 12 smaller languages. In our sample, Sesotho is used to a much smaller extent in the home (1%), followed by German (0.3%), isiZulu, Setswana, Italian, Greek, and French (0.1%), and Spanish, Scottish, Portuguese, Polish and Norwegian (0.03%). As expected, we found (a) three major home languages, namely Afrikaans, English and isiXhosa, and a few smaller home languages, and (b) that the majority of children come from Afrikaans-speaking homes, given the power of Afrikaans-speaking land-owners and business people. Given what we know about the massive migration of predominantly Xhosaspeakers from the impoverished Eastern Cape province to the Western Cape, it was to be expected that isiXhosa has eclipsed English as the second largest language in the province.
Inventory of home languages Table 4.1.1 contains an inventory of the home languages mentioned by all the children in the sample (What languages are used in your home?).
Language repertoire Table 4.1.2 gives an overview of co-occurring home language combinations that have been reported. A distinction is made between unilingual, bilingual and multilingual home language contexts.
76
Language policy implementation and language vitality in Western Cape primary schools
Fig. 4: Rural EMDCs (districts), Western Cape (source: MAPS Cape Town n.d.)
PRAESA – Occasional Papers No. 15
77
Unilingual
2445
77%
Bilingual
613
20%
42
1%
Multilingual
Table 4.1.2: Overview of home-language combinations, rural/town group
(N = 3173)
By far the majority of children (77%) indicate that they speak one language at home exclusively, while 20% report bilingual homes, and only 1% indicate that they come from multilingual homes. Of the unilingual homes in the sample, Afrikaans enjoys by far the strongest position (60%) and therefore has the largest exclusive-use value, followed by isiXhosa (14%) and English (3%) (see Table 7.3 ). In bi/multilingual homes, the Afrikaans-English combination is most common (14%), followed by much lower figures for Afrikaans-isiXhosa (4%), English-isiXhosa (2%) and Afrikaans-English-isiXhosa (1%). Afrikaans only
1891
60%
453
14%
449
14%
110
4%
101
3%
Xhosa only Afrikaans
English
Language choice Table 4.1.4 shows that for a large number of children, Afrikaans is the language most often chosen in interaction with parents (74% with mother, 72% with father). Afrikaans is also often spoken in interaction with other interlocutors such as best friends and the shopkeeper. In other words, the use of Afrikaans is widespread across all domains. Afrikaans
English
Xhosa
Mother
2356
74%
488
15%
613
19%
Father
2300
72%
434
14%
600
19%
Brothers/Sisters
2288
72%
433
14%
604
19%
Grandparents
2277
72%
386
12%
581
19%
Best friend
2304
73%
583
18%
597
18%
Shopkeeper
2383
75%
643
20%
592
19%
Religious contexts
2170
68%
442
14%
565
18%
Table 4.1.4: Language choice, rural/town group
(N = 3173)
This confirms our hypothesis (a) that the majority of children would come from unilingual Afrikaans-speaking homes, with a large Afrikaans exclusive-use value; and (b) the existence of a fairly large unilingual Xhosaspeaking minority.
When we divide the sample according to home language group (see Chapter 8 for details), we see that there is an increase in choice of Afrikaans in the community for both the English and the isiXhosa home language HL groups, albeit to a lesser extent. This reflects the economic value of Afrikaans in the broader Afrikaans-dominant community. An interesting finding in the English HL group is that the language of choice in all interactions is more often Afrikaans than English. This supports the idea that Afrikaans-English bilingual children have a stronger Afrikaans background and are moving towards English because of societal pressure. In addition, however, there is also an increase, amongst the Afrikaans HL and isiXhosa HL groups, in the number of children who report that they speak English with the shopkeeper and best friend. There is a general decline in the number of children who speak Afrikaans for religious purposes (68%). The language used on such occasions is mostly dependent on the language in which prayer books and the like are available, and on the language/s in which certain ceremonies or rituals are performed. English and isiXhosa are used to a much lesser extent. Another possible explanation is that not all children are involved in religious practices and therefore left the question unanswered. We see a similar pattern across the respondents’ family members and other interlocutors. The number of children who indicate that they speak English to their grandparents is lower compared to language choice with
78
Language policy implementation and language vitality in Western Cape primary schools
Afrikaans
Xhosa English only
Afrikaans
English
Xhosa
54
2%
English
Xhosa
42
1%
Table 4.1.3: Language repertoire, rural/town group
(N = 3173)
Of those who indicate that English is a home language, 70% also indicate that Afrikaans is used at home. There is also a substantial minority of children who speak Afrikaans in combination with English at home. The relatively high number of Afrikaans-English bilinguals could be indicative of the beginnings of a language shift from Afrikaans to English, although not as prominently as in the urban areas. The transition would be as follows: Afrikaans only Ô Afrikaans + English Ô English only
PRAESA – Occasional Papers No. 15
79
other family members. This may indicate a generational shift to English because of its dominant position. The numbers for Afrikaans and isiXhosa are the most stable when it comes to language choice in all domains. Language of the questionnaire Concerning the language version of the questionnaire, the vast majority chose Afrikaans (72%), around one-fifth chose isiXhosa (19%) and fewer than one-tenth (9%) chose English. For Afrikaans and isiXhosa, respectively, the figures closely reflect reported language choices with family interlocutors (see Table 4.1.4 above). The lower than expected figure for English is a further indication of its additional-language status. Afrikaans
2215
72%
English
275
9%
Xhosa
590
19%
Table 4.1.5: Questionnaires filled in by language version, rural/town group
(N = 3173)
We hypothesised that the language of choice in interaction with family and community members would correspond largely to home language use. We see that the numbers for language choice and home language use are similar for all three groups of children. However, there is an increase in the use of English in the community. Language proficiency The language proficiency profile (Table 4.1.6) shows that Afrikaans and English are understood by a large number of children (79% and 78% respectively). Since only 20% of the sample report that English is used in the home (see Table 7.1), the majority of the 78% of children who report that they understand English must have gained this proficiency from taking it as a second-language subject at school. The popularity of English as a second-language subject reflects its powerful position, and the ensuing desire to speak it. The number of children who report that they understand Afrikaans is the same as the number of children who report that Afrikaans is used in the home (79%). Afrikaans
English
Xhosa
Understand
2494
79%
2468
78%
705
22%
Speak
2607
82%
1954
62%
692
22%
Read
2719
86%
2471
78%
624
20%
Write
2647
83%
2323
73%
617
19%
Table 4.1.6: Language proficiency, rural/town group
80
(N = 3173) PRAESA – Occasional Papers No. 15
However, the number of children who report that they can speak (82%), read (86%) and write (83%) Afrikaans is higher than the number of children who report that they can understand Afrikaans (79%). When we dissect the sample according to home language group (cf. 4.3), we see that a similar pattern occurs among the isiXhosa HL group. While only 41% indicate that they understand Afrikaans, 51% and 44% indicate that they read and write Afrikaans, respectively. This may be due to poor language teaching methods in schools in which children are requested to repeat after the teacher without showing any real understanding. Reading and writing in some cases may refer to little more than copying off the blackboard. For children who speak English, the reverse is true. In other words, more children indicate that they understand English (78%) than those who indicate that they can speak it (62%). This could be related to levels of confidence and exposure to criticism and mocking by peers when errors are made in speech, especially in a second-language environment. However, when we isolate the isiXhosa HL group, we see a similar pattern as the one for Afrikaans occurring. While 68% of children report that they understand English, 77% and 71% report that they read and write it respectively. This suggests that the same factors may be at play here. IsiXhosa is understood by a smaller number of children (22%). This number corresponds to the number of children who report isiXhosa as a home language. The low status of isiXhosa as a language is underlined by the fact that it is offered as a subject at second-language level by only a small number of schools. In other words, Afrikaans and English speaking children generally do not learn isiXhosa as a subject, while Xhosa-speaking children are compelled to learn either English or/and Afrikaans. With respect to literacy, the same pattern can be observed for all three language groups: reading skills are more developed than writing skills. Our language proficiency hypothesis states that reported reading and writing proficiency would coincide with home language use, except in the case of the Xhosa-speaking group whose isiXhosa literacy levels were expected to be significantly lower than their oral isiXhosa proficiency. We see that there is only a slightly lower number of children who indicate that they can read and write in isiXhosa than those who indicate that they can understand and speak isiXhosa. Language dominance and language preference Afrikaans is the dominant language for 70% of children, and the most preferred language for 58%. An interesting revelation was that when arranging the data according to home language group, more English HL Language policy implementation and language vitality in Western Cape primary schools
81
children indicated that Afrikaans, and not English, was their best language (cf. 4.3). This again supports the idea that there is a strong Afrikaans dominance in the Afrikaans-English bilingual homes. It also points to a language shift in progress. Afrikaans
English
Xhosa
Speak best
2229
70%
573
18%
611
19%
Most like to speak
1850
58%
1458
46%
152
5%
Do not like (to speak)
556
18%
350
11%
955
30%
Table 4.1.7: Language dominance and language preference, rural/town group (N = 3173)
Compared to the number of children who report that English is their best language (18%), the number of children who report that English is their preferred language is remarkably high (46%). The largest differences between best language and preferred language occur in the isiXhosa HL group (cf. 4.3). The preference for both Afrikaans and English, despite a lack of proficiency, is a clear indication of the status of these languages. It also reflects the value of Afrikaans in the rural districts. The small percentage of children who indicate that isiXhosa is their language of preference is a further indication of the low status and value of isiXhosa as a vehicle for educational success and economic power. Some 18% of children report that Afrikaans is the language they do not like. When analysed by home language group, we see that the strongest dislike for Afrikaans is to be found in the isiXhosa HL and English HL groups. The number of children who report that they do not like isiXhosa is relatively high (30%). There is an overwhelming preference for English, although small pockets of children also express a dislike for the language. Our hypothesis (a) that Afrikaans would be the dominant language by a considerable margin was proved correct. (b) Contrary to expectations, however, attitudes towards Afrikaans do not correspond completely to proficiency in the language. We see that there is some negative sentiment towards Afrikaans. (c) Our prediction that many Xhosa-speakers would prefer English turned out to be right: there is a strong preference for English. (d) The predicted antipathy towards isiXhosa did materialise. It is clear that the low status of isiXhosa underlies the negative attitudes towards the language. We see this even for children who do not speak isiXhosa at all. What is particularly remarkable is that negative attitudes exist towards isiXhosa by Xhosa-speakers.
82
PRAESA – Occasional Papers No. 15
4.2 Language at school Language subjects Table 7.7 contains data on the actual versus preferred learning of languages by our children. 24 languages were mentioned twice or more as languages that our children would like to learn. English and Afrikaans are learnt at school by the largest number of children. A relatively high number of children (49%) would like to learn isiXhosa. Of the other African languages, a relatively large number of children would also like to learn isiZulu (113) and Sesotho (82) in addition to English, Afrikaans, and isiXhosa. This may be an indication of the number of home language speakers for these languages. The European languages that a relatively large number of children would like to learn are German (367 children) and French (364 children). Many children choose these languages over and above the local languages, which gives an indication of the low status of local languages and the high status attached to European languages. Our hypotheses about language subjects were largely correct, as we found that (a) apartheid-era language subject practices still apply, i.e. that Afrikaans- and English-speakers were taking Afrikaans and English as subjects, but that Xhosa-speakers were taking isiXhosa, English, and Afrikaans; (b) that there was little interest amongst English- and Afrikaansspeakers in learning isiXhosa or other African languages, and (c) that there was considerable interest in learning European languages. Language of teaching and of assessment Actual versus preferred use of particular languages for teaching and assessing content subjects such as Maths and Science is summarised in Table 4.2.2. Afrikaans is most commonly used in the content subjects (72%). However, fewer children prefer the use of Afrikaans in the content subjects (52%). This may be an indication of the migration of children from other language groups (most likely Xhosa-speaking children) into Afrikaans schools. It is also a reflection of the diminishing role of Afrikaans in public life, including education. The reverse pattern can be observed for English as well as for isiXhosa, for very different reasons. More children prefer to be taught through the medium of English and isiXhosa than the actual use of these languages would suggest (31% and 5% used vs. 46% and 18% preferred, respectively). The preference for English arises out of the status of the language and the desire to speak it, while the preference for isiXhosa arises out of a need to communicate and understand in the classroom. The high preference for English does not match the actual language use. However, a similar number of children indicate that they speak isiXhosa best and that they prefer the use of isiXhosa in content subjects. When we look at the figures associated with attitudes towards isiXhosa, we see that there is a Language policy implementation and language vitality in Western Cape primary schools
83
Language variety
Languages learned at school
Other languages respondents would like to learn at school
Xhosa
789
25%
1563
49%
English
2858
90%
568
18%
Afrikaans
big disparity in the number of children who indicate that they use isiXhosa in relation to those who prefer the use of isiXhosa in the content subjects (compare Table 4.1.7 with Table 4.2.3). Afrikaans
English
Xhosa
2801
88%
430
14%
Language of teaching (LoT)
2287
72%
969
31%
158
5%
German
14
–
367
12%
Preferred LoT
1658
52%
1473
46%
587
8%
French
6
–
364
11%
10
–
113
4%
Language of assessment (LoA)
2283
72%
1342
42%
170
5%
Sotho
7
–
82
3%
Preferred LoA
1611
51%
1334
42%
645
0%
Spanish
–
–
71
2%
Sign language
–
–
52
2%
Dutch
3
–
49
2%
Italian
–
–
44
1%
Chinese
2
–
31
1%
Tswana
–
–
14
–
Portuguese
–
–
13
–
Greek
3
–
12
–
Latin
–
–
12
–
Japanese
1
–
9
–
Arabic
–
–
7
–
Zulu
Unknown
–
–
4
–
Venda
1
–
3
–
Russian
–
–
3
–
Swedish
1
–
2
–
Swazi
–
–
2
–
Norwegian
–
–
1
–
Scottish
–
–
1
–
Polish
–
–
1
–
Danish
–
–
1
–
Hebrew
–
–
1
–
Sepedi
–
–
1
–
Swis [sic]
–
–
1
–
Table 4.2.1: Languages learnt at school, and other languages respondents would like to learn at school, rural/town group (N = 3173)
84
PRAESA – Occasional Papers No. 15
Table 4.2.3: Languages used and preferred in content subjects, rural/town group (N = 3173)
The strongest increase in preference for isiXhosa can be seen in the isiXhosa HL group when we divide the sample according to home-language group (see 4.3). There is an increase of 39% from those who are currently taught in isiXhosa, to those who would prefer to be taught in isiXhosa, and an increase of 37% from those who are currently assessed in isiXhosa, to those who would prefer to be assessed in isiXhosa. In testing and exams, a mismatch can be noted between the actual and preferred LoLT for the Afrikaans and isiXhosa groups. Although 72% of children make use of Afrikaans for assessment, only 51% prefer it. Again, this may be a reflection of increasing negative attitudes towards Afrikaans, or an indication of migration of children across ex-departments and thus of language groups. The reverse mismatch can be noted for isiXhosa. A much higher number of children would prefer to be assessed in the content subjects in isiXhosa (20%) than happens in practice (5%). This illustrates the dilemma children face: despite negative attitudes towards isiXhosa (see under Language dominance and language preference), children realise the value and importance of isiXhosa when it comes to understanding and testing in the classroom. The number of children who prefer to be examined through the medium of English corresponds with the number of children who are examined in this language. None of the children in the other language groups indicate that they would like to be examined in English. There is a larger number of children who use Afrikaans as medium of instruction in content subjects and assessment than those who prefer to do so. Only a few isiXhosa HL speaking children are taught and assessed through the medium of isiXhosa in content subjects, while all English HL children are taught and assessed through the medium of English. There is a mismatch between the language best spoken and the language preferred with isiXhosa speaking children (see Table 7.6), but this mismatch is not Language policy implementation and language vitality in Western Cape primary schools
85
carried through when it comes to preference in teaching and assessment of content subjects. This may be because the need is greater to be able to understand and communicate in the classroom. Regarding our hypothesis that some disjunctures would exist between the LoLT and the home languages of many Grade 7 children, we found this to be the case for the Afrikaans HL and isiXhosa HL groups. Predictably, many would prefer to study through the medium of their HL in order to sidestep the language mismatch.
Language status
Sub-category
Indicator
Afrikaans HL
Xhosa HL
English HL
group (N = 2492) group (N = 660 ) group (N = 646) Afr
E n g Xho Afr
22
6
23
76
–
–
–
–
69
–
16
–
Mother
92
14
5
15
10
90
62
58
13
4.3: Rural/town home-language groups in comparison (overview)
Father
90
13
5
12
7
88
59
55
12
Table 4.3.1 (over) compares and contrasts the three rural/town homelanguage groups with each other. We see at a glance that there are major divides between the three home-language groups, and some commonalities.
Brothers/sisters
89
12
5
14
10
89
60
50
13
Grandparents
89
11
5
11
5
86
59
47
11
Shopkeeper
90
20
4
22
13
86
69
52
11
Best friend
88
17
5
16
14
87
61
53
12
Religious contexts 84
12
4
13
9
82
57
39
11
96
80
9
41
68
91
86
92
16
Speak
96
65
8
34
45
94
83
88
15
Read
95
78
7
51
77
83
85
93
13
Write
94
73
6
44
71
84
82
86
12
Language dominance Speak best
87
15
5
13
19
86
52
50
12
and preference
67
38
Language choice. Afrikaans is the language chosen by almost all ex-HoR respondents. Afrikaans is also used (often reportedly alongside English) by our respondents in the majority of English HL speakers’ homes, and in a minority of Xhosa-speaking homes. Further research would be required to ascertain whether the majority of the English HL group would be more accurately described as an Afrikaans/English bilingual group. Language proficiency. Almost all Afrikaans HL and English HL respondents report being proficient in Afrikaans, as do many Xhosa-speakers. Reported proficiency in English is similarly widely distributed, although the low value for spoken English amongst isiXhosa HL respondents indicates its additional-language status. Judging from these figures, it is the latter group that is the most multilingual.
Exclusive HL use Language choice
Language proficiency Understand
Most like to speak
77 100
15
3
33
76
14
36
69
5
9
12 36
48
6
5
26
6
30
Languages learnt
92
89 13
70
93
81
89
92
16
Want to learn
13
18 57
22
22
19
12
15
46
LoT in contents.
88
16
3
15
84
15
56
48
6
Preferred LoT
57
39 11
14
73
54
35
62
11
Do not like Language at school
14 100
E n g Xho
100
Home language repertoire. Besides being the most widely-spoken home language, Afrikaans also enjoys the greatest exclusive use of the three major languages. IsiXhosa also has a high exclusive-use value. The extremely low exclusive-use value for English suggests it is used mainly alongside other home languages.
Language repertoire
E n g Xho Afr
Language dominance and language preference. Afrikaans is the strongest language for the Afrikaans HL group, and for half the English HL group. English is reportedly the dominant language for the other half of the English HL group. IsiXhosa is the dominant language for the isiXhosa HL group. English is preferred to a disproportionate degree by especially the isiXhosa HL group, and to a lesser extent by the Afrikaans HL group, for most of whom Afrikaans remains the language they most like to speak. Afrikaans is also the language that attracts the highest negative rating – mainly from the isiXhosa HL group, but also from the English HL group. There is considerable antipathy towards isiXhosa from the Afrikaans HL and English HL groups.
Language at school. Gauging by the number of languages reportedly learned at school, we have one trilingual group (isiXhosa HL) and two bilingual groups (Afrikaans HL and English HL). Given the amount of antipathy previously expressed towards isiXhosa (see above), there is a
86
Language policy implementation and language vitality in Western Cape primary schools
PRAESA – Occasional Papers No. 15
Lang. of assessm. 87
30
3
15
87
20
59
59
5
Preferred LoA
34 13
11
71
57
37
62
13
62
Table 4.3.1: Comparative overview of rural/town home-language groups, in percentages
87
surprising degree of openness towards learning the language on the part of both Afrikaans HL and English HL speakers. Concerning the content subjects, Afrikaans HL speakers are generally taught and assessed through the medium of Afrikaans, isiXhosa HL speakers have English for these purposes, and the English HL group is divided between those who have Afrikaans and those who have English as LoT/LoA. The majority of Xhosaspeakers would prefer to be taught and assessed through their home language, not through English (or Afrikaans) as at present.
Language status
55%
ex-CED
847
27%
ex-DET
566
18%
Table 4.4.1: Children by ex-department, rural/town group
Language repertoire. The ex-HoR and ex-CED groups are mainly Afrikaans-speaking, with a large minority of the latter group reporting English as a (second) home language. The ex-DET group come from largely unilingual Xhosa-speaking homes.
(N = 847)
Language repertoire
96
14
5
17 10
96
84
40
4
Exclusive (HL) use
80
0
2
1
74
56
11
1
Language choice
proficiency
The similarities and differences between the different rural/town exdepartment groups are summarised in Table 4.4.2. (over).
Ex-CED group
(N = 566)
Afr E n g Xho
Language
(N = 3173)
Ex-DET group
(N = 1757)
Afr E n g Xho
Of the 3173 children in the sample, more than half (55%) attend schools which were formerly classified as HoR, over one quarter (27%) attend schools which were formerly classified as ex-CED, and 18% attend schools which were formerly classified as DET. Table 4.4.1 shows the number of children in each category. 1757
Ex-HoR group Afr E n g Xho
4.4 Rural/town ex-department groups in comparison (overview)
ex-HoR
Sub-category
indicator
0
Mother
94
9
3
10
7
93
77
34
3
Father
93
8
3
6
4
93
74
32
3
Brothers/sisters
92
8
3
8
7
93
74
30
4
Grandparents
91
6
3
7
3
89
75
31
3
Shopkeeper
91
10
3
17 10
92
82
48
3
Best friend
91
11
3
10 11
92
77
39
3 3
Religious contexts
85
9
2
9
88
74
27
Understand
96
74
5
32 68
8
93
94
92 10
Speak
97
56
4
24 40
96
91
88
9
Read
96
72
3
43 77
92
93
92
7
Write
96
66
2
36 71
93
90
89
6
Language
Speak best
91
9
4
7 18
92
69
37
3
dominance
Most like to speak 70
31
4
33 81
11
51
54
3
& preference
Do not like
8
13
34
6
3
16
11 40
Language at school
LoLT in contents.
94
7
3
4 94
16
72
37
1
Preferred LoLT
54
38
13
10 78
61
60
43
2
51
Lang. of assessm. 92
26
3
5 62
21
76
41
1
Preferred LoA
33
15
7 59
63
61
39
4
Language choice. In keeping with the above trend, most ex-HoR and exCED respondents use mainly Afrikaans in interactions with family members and the community. English does play a role in the lives of a minority of ex-CED respondents, particularly when going shopping. IsiXhosa is by and large the only language of social interaction for ex-DET respondents. Language proficiency. English is reportedly understood by most respondents across the ex-department groups, although the lower figures for ‘speaking’ amongst ex-DET and ex-HoR respondents indicate its additionallanguage status and the lack of exposure to English outside the classroom. Proficiency in Afrikaans across all four dimensions is reported by virtually all ex-HoR and ex-CED children, but only by around one-third of ex-DET respondents. Proficiency in isiXhosa is largely limited to the latter group.
Language dominance and language preference. Language dominance figures largely reflect language choices with the parents (see above). Afrikaans is reportedly spoken best by almost all ex-HoR children and by approximately two-thirds of ex-CED children. IsiXhosa is dominant amongst ex-DET respondents. English is second to Afrikaans as a language of dominance amongst ex-CED respondents. There is a huge preference for English amongst ex-DET respondents (at the expense of isiXhosa), much
88
Language policy implementation and language vitality in Western Cape primary schools
PRAESA – Occasional Papers No. 15
60
Table 4.4.2: Comparative language profiles of rural/town ex-department groups, in percentages
89
more so than amongst ex-CED respondents who are almost equally divided in their preference for English and for Afrikaans. Ex-HoR respondents mainly prefer to speak Afrikaans, although even here English has begun to make some inroads. Language at school. Afrikaans is reportedly the main language of teaching and assessment in both ex-HoR and ex-CED schools, with a substantial role for English in the latter. Ex-DET respondents, on the other hand, have their content subjects taught and assessed largely through the medium of an additional language (English), with the auxiliary role for the home language (isiXhosa) probably limited to the oral/aural dimension. Hardly unexpectedly, the majority of ex-DET (i.e. Xhosa-speaking) children would like isiXhosa to feature as a LoT and LoA – alongside English. In keeping with findings in related studies (see SBA/MSSA 2002), there is thus considerable support for dual-medium teaching and assessment amongst Xhosa-speakers and, to a lesser extent, amongst Afrikaans-speaking ex-HoR respondents.
Language status
Breede River/Overberg
1615
51%
Southern Cape/Karoo
1321
42%
West Coast/Winelands
234
7%
Table 4.5.1: Children per EMDC (N = 3173)
In Table 4.5.2 we provide an overview of the similarities and differences between the three EMDC groups. It is worth remembering that the majority of respondents in all three districts are enrolled in ex-HoR schools.
Breede River/
Southern Cape/
Overberg group
Karoo group
Winelands group
(N = 1615)
(N = 1321)
(N = 234)
Afr Language repertoire
84
Exclusive (HL) use Language choice
E n g Xho Afr 15 15
71
West Coast/
E n g Xho Afr
E n g Xho
26 29
24
89
17
69
1 11
48
6 19
63
1
8
Mother
82
10 14
64
22 26
80
15
16
Father
81
9 14
60
19 26
81
16
15
Brothers/sisters
81
9 14
59
18 27
81
18
15
Grandparents
81
8 13
60
17 25
80
12
16
Shopkeeper
83
16 14
64
25 26
83
28
15
Best friend
82
14 14
60
23 26
80
24
15
Religious contexts 78
10 13
56
18 25
76
19
13
Language
Understand
86
78 18
80
76 29
93
88
16
proficiency
Speak
86
62 17
77
61 29
91
69
18
Read
87
78 16
83
76 25
91
89
14
Write
86
72 15
80
73 26
88
85
13
80
4.5 Rural/town EMDC groups in comparison (overview) Of the 3173 children in the sample, 1615 (51%) attend schools that are located in the Breede River/Overberg EMDC, 1321 (42%) attend schools that are located in the Southern Cape/Karoo, and 234 (7%) attend schools that are located in the West Coast/Winelands region. Table 4.5.1 shows the number of children in each region.
Sub-category
indicator
Language
Speak best
14 14
58
24 26
78
15
15
dominance
Most like to speak 64
40
5
53
52
5
53
54
4
& preference
Do not like
11 34
25
11 26
12
10
27
Language at school
LoLT in content s. 83
23
3
58
42
6
81
23
13
Preferred LoLT
42 17
39
51 20
40
50
21
Lang. of assessm. 81
36
3
59
50
7
83
42
8
Preferred LoA
34 19
39
51 22
50
47
25
12
55
61
Table 4.5.2: Comparative language profiles of rural/town EMDC groups, in percentages
Language repertoire. Afrikaans is the major home language across all three districts. English features mainly in SCK and WCW, while isiXhosa is fairly strongly represented in the SCK (mainly around the more industrialised towns of George, Knysna and Mossel Bay). English has virtually no exclusive-use value in any of the three districts, which signals its additionallanguage status. The SCK and WCW have similar combined totals for exclusive-use value, and appear to be more multilingual than the Afrikaansmainly BRO.
Language choice. Language-choice figures by and large reflect homelanguage figures (see above). For most respondents across all three districts, Afrikaans remains the chosen language of interaction with interlocutors in the home and the community. Both IsiXhosa and English features mostly in the SCK district. Language proficiency. Figures reveal the success of the schooling system in promoting proficiency in English, largely as an additional language (AL),
90
Language policy implementation and language vitality in Western Cape primary schools
PRAESA – Occasional Papers No. 15
91
and the singular lack of success of the system in promoting proficiency in isiXhosa AL. The vast majority of respondents across all three EMDCs report being able to understand, read and write (in) English. Figures for these dimensions are almost on a par with reported Afrikaans proficiency, the home language of the majority. It is only in the dimension of speaking English that our respondents are less confident in their abilities. IsiXhosa proficiency is limited almost exclusively to the isiXhosa HL group. Language dominance and language preference. Afrikaans is predictably the language spoken best by the highest number of respondents across all three districts, although Afrikaans-dominance figures in the more multilingual SCK are substantially below those for the other two EMDCs. Around one-quarter of children in the SCK report dominance in English and isiXhosa, respectively. With minor exceptions, figures for language dominance correlate closely with those for language choice (with parents). With regard to language preference, Afrikaans is still strongest in the BRO. But in the SCK and the WCW, English is preferred by as many as those who prefer to speak Afrikaans. The swing to English is most dramatically felt in the WCW. There is some antipathy towards isiXhosa in all three districts. The antipathy towards Afrikaans, while not major, is strongest in the SCK, which has the highest proportion of Xhosa-speakers of the three EMDCs – surely no coincidence.
Chapter 5 Discussion and recommendations Before we summarise the findings and spell out the conclusions and recommendations to be drawn from the study, it is necessary to outline briefly the changing educational language policy environment in the Western Cape province that forms the backdrop to the survey.
5.1 New (draft) primary schools language policy in the Western Cape
Language at school. Afrikaans is, as expected, the main LoT and LoA across all three districts. Figures for Afrikaans in these two sub-categories closely resemble those for language dominance, implying that where Afrikaans is used to teach and assess the content subjects, it becomes (remains) the learner’s strongest language. English is used as LoT and especially as LoA in all three districts, particularly in the SCK, where it is preferred above Afrikaans. Of the three EMDCs, the WCW has the highest proportion of dual-medium (Afrikaans/English) assessment practices. IsiXhosa is seldom used for teaching and assessment of Maths and Science, yet is preferred for these purposes by almost all Xhosa-speakers across the three districts.
In November 2002, after the conclusion of the current study, the draft new Language Policy in the Primary Schools of the Western Cape (henceforth LPPS) (WCED 2002) appeared on the WCED website. It has as its central recommendations: • to implement the policy of mother-tongue based bilingual education in Grades R – 6 as from 2004-2005 in all primary schools of the Western Cape Province • to institute incentives to guide all children towards electing to take (offer) the third official language of the Province as their second additional language (SAL). Secondary recommendations include the following: • training and language proficiency-related deployment of teachers • large-scale investment in reading books and learning support materials in isiXhosa • multilingualism awareness campaigns • incentives for schools to adopt LiEP-aligned language policies, i.e. financial rewards, a higher categorisation, more generous staff allocations, language proficiency endorsements on professional qualifications, better promotion prospects for teachers. (ibid.) Finally, implied or latent recommendation are ‘to carry out a full cost analysis of the recommendations ... and to secure approval of the costs prior to implementation of the plan’ (ibid.). The LPPS emphasizes that where parents opt for dual-medium education, the home language should as a rule be the formative language of learning and teaching (LoLT, formerly medium of instruction) and the first additional language (FAL) the supportive LoLT, that is gradually phased in without ever replacing the home language. The preferred model is of a ‘mother-tongue-based’ curriculum, which would depend in its permutations on contextual factors. Third-language (as subject) teaching should be phased in via a system of incentives rather than coercive measures.
92
Language policy implementation and language vitality in Western Cape primary schools
PRAESA – Occasional Papers No. 15
93
The LPPS thus consciously draws on available research to combine educational principles with a sense of pragmatism. Its concern at the erosion of isiXhosa and Afrikaans due to the hegemony of English is well supported by research findings; and its valorisation of isiXhosa as the additional language subject is historically correct. The LPPS takes a calculated risk in relying primarily on persuasion (via incentives) rather than coercion to achieve its stated goals; it remains to be seen to what extent the coercive back-up measures provided for can be avoided if and when school communities do not comply. Taken as a whole the LPPS builds on, yet clearly goes beyond, the earlier and largely symbolic LiEP. In its emphasis on budgets, timeframes, and responsibilities, the LPPS is a determinedly material policy that demonstrates a political will to profiling and resourcing marginalised languages in and through education (Plüddemann 2003). In short, the LPPS is cast in the mould of a LiEP implementation plan. Its adoption by the provincial cabinet depends on the finalisation of a costing exercise, which at the time of writing (May 2004) is distinctly overdue.
5.2 Summary of findings In light of the above policy’s emphasis on home-language based education with three language subjects, the findings of our survey have a particular salience. Rarely have the implications of survey findings dovetailed so neatly with a nascent policy. For the sake of easier reference, and in keeping with the rest of this report, the survey results are disaggregated by language vitality according to region (urban and rural/town). Urban (Greater Cape Town) region 1. Inventory of home languages: a. We find three major home languages, namely Afrikaans, English and isiXhosa, but fewer than expected other home languages. b. English has replaced Afrikaans as the most widely-used home language amongst primary school children in the metropolis, something that could indicate the beginnings of a language shift from Afrikaans. c. IsiXhosa is in the ascendancy over Afrikaans as a home language amongst younger (i.e. Grade 1) respondents. d. There are major differences between the Grade 1 and Grade 7 cohorts – the explanation may lie in the greater language repertoire Grade 7 children enjoy on account of their schooling. 2. Language repertoire: a. We find a very high incidence of Afrikaans-English bilingual homes (or language concurrence), particularly at Grade 7 level.
94
PRAESA – Occasional Papers No. 15
b. Xhosa-speakers come from mainly unilingual homes, i.e. isiXhosa has a high exclusive-use value in the home (expected). c. There are major differences between the Grade 1 and Grade 7 cohorts. 3. Language choice: a. There is widespread use of English in interaction and transaction with significant others. b. Interaction with family members tends to be mostly unilingual, despite the high incidence of bilingual homes. c. Major differences in language choice patterns between Grade 1 and Grade 7 respondents emerge. d. Many parents appear to speak to their children in English, even though they (still) converse with each other in Afrikaans. e. Language choice in interaction with shopkeepers shows the commercial power of English at the expense of other languages among the Grade 7s; Grade 1s tend to use English to the same extent with shopkeepers as with family members. In the African townships most transactions of a commercial, interpersonal and religious nature are still conducted in isiXhosa. 4. Language proficiency: a. Reported proficiency in speaking amongst our urban Grade 1 children broadly matches home-language use. b. English impacts greatly on Afrikaans-speakers and Xhosa-speakers by Grade 7, measured by reported English proficiency levels for all three language groups. c. Reported literacy levels in the home language amongst the Grade 7 isiXhosa HL group are low, particularly amongst those enrolled in exHoR schools. d. A very low number of Afrikaans HL and English HL children report (third-language) proficiency in isiXhosa, denoting the current low status of isiXhosa in the curriculum. 5. Language dominance and language preference: a. English has replaced Afrikaans as the dominant language among Grade 7 children in the Greater Cape Town area. b. There is a preference for English amongst all three HL groups, particularly amongst English-HL and isiXhosa-HL speakers, suggesting that English acquires increasing status through schooling. c. IsiXhosa tends to suffer a significant loss of vitality by the time children reach Grade 7, a function of its status as a mere transition to English. Language policy implementation and language vitality in Western Cape primary schools
95
d. There is some ambivalence towards Afrikaans, indicating its changing status in a multilingual society. e. Unexpectedly, there is no particular preference for Afrikaans amongst ex-CED (‘white’) Afrikaans-dominant speakers, illustrating a loosening of the historical-cultural links between language and identity. f. We find considerable antipathy towards Afrikaans amongst Xhosaspeakers and, to a lesser extent, among English-speakers, particularly at Grade 7 level. g. Some negative language attitudes towards isiXhosa are to be found amongst Afrikaans-HL and English-HL speakers, particularly at Grade 7 level – again pointing to the insidious influence of schooling and ultimately of a society in which many of the language practices and attitudes continue to reflect the apartheid era. 6. Language subjects: a. Residues of apartheid-era language subject practices can still be found, i.e. most Afrikaans- and English-speakers take only Afrikaans and English as subjects, while Xhosa-speakers tend to take isiXhosa, English, and Afrikaans. b. Significant home-language deprivation is endured by Grade 7 isiXhosa HL respondents in ex-HoR schools, where isiXhosa is mostly not offered. c. Many English- and Afrikaans-speakers are surprisingly open to learning isiXhosa, particularly at Grade 7 level. d. There is little interest in learning other languages (with the possible exception of French), even amongst Grade 7 urban respondents. 7. Language of teaching (Grade 1): a. Most Grade 1s are taught through the medium of their HL. b. In cases of language mismatch, those affected want their teacher to address them in their HL. Already at Grade 1 level there is considerable dissatisfaction amongst Xhosa-speakers in ex-HoR schools with the mismatch between their home language and the language of teaching. 8. Language of teaching and of assessment (Grade 7): a. Disjunctures exist between the LoLT and the home languages of many Grade 7 children amongst both isiXhosa HL and Afrikaans HL speakers. b. In such cases of language mismatch many children, particularly the Xhosa-speakers, prefer to study through the medium of their HL. c. More than half of all Afrikaans-speaking children are being taught through the medium of English, and prefer to be assessed in English.
Rural/town region 1. Inventory of home languages: a. There are three major home languages, namely Afrikaans, English and isiXhosa, and a few smaller home languages. b. The majority of children come from Afrikaans-speaking homes. c. IsiXhosa has not (yet) eclipsed English as the second-largest language in the province, despite the economically-driven in-migration of Xhosaspeakers from the Eastern Cape. 2. Language repertoire: a. The majority of children come from unilingual Afrikaans-speaking homes, with a large Afrikaans exclusive-use value. b. There is a fairly large unilingual Xhosa-speaking minority. 3. Language choice: a. The numbers for language choice and home language use are similar for all three groups of children. b. There is an increase in the use of English in interaction with shopkeepers and best friends, in relation to family members. 4. Language proficiency: a. Language proficiency figures largely reflect figures for home-language use. b. There is only a slightly lower number of children who indicate that they can read and write in isiXhosa than those who indicate that they can understand and speak isiXhosa, i.e. there is no significant drop-off from oral to written language proficiency. c. Where such a gap exists it is most likely to be found in ex-CED schools. 5. Language dominance and language preference: a. Afrikaans is the dominant language by a considerable margin. b. Attitudes towards Afrikaans do not correspond wholly to proficiency in the language, i.e. there is substantial antipathy towards Afrikaans, even amongst those who speak Afrikaans. c. Many Xhosa-speakers have a strong preference for English. d. Considerable antipathy towards isiXhosa exists, both amongst non-Xhosaspeakers and Xhosa-speakers. The low status of isiXhosa in schooling and society underlies the negative attitudes towards the language. 6. Language subjects: a. Apartheid-era language subject practices still obtain, i.e. Afrikaans- and English-speakers take mainly Afrikaans and English as subjects, and Xhosa-speakers take isiXhosa, English, and Afrikaans.
96
Language policy implementation and language vitality in Western Cape primary schools
PRAESA – Occasional Papers No. 15
97
b. There is little interest amongst English- and Afrikaans-speakers in learning isiXhosa or other African languages. c. On the other hand, there is considerable interest in learning foreign European languages. 7. Language of teaching and of assessment (Grade 7): a. There are some discrepancies between the LoLT and the home languages of many Grade 7 children, for both the Afrikaans HL and isiXhosa HL groups. b. Predictably, many would prefer to study through the medium of their HL in order to sidestep the deleterious effects of the language mismatch. In summary, therefore, results from the learners’ surveys show that English is becoming increasingly dominant – even hegemonic – in the Cape Town metropolis, and is also beginning to make inroads into the traditionally Afrikaans-dominant platteland. In the urban (Greater Cape Town) survey, respondents turn out to be much more English-oriented than census results have led us to expect. Afrikaans continues to be the most widelyspoken home language in the towns and rural areas, although even here the commercial power of English is clearly being felt. As expected, we find a high incidence of Afrikaans-English bilingual homes in the urban areas, and fewer in the towns and rural areas; Xhosa-speakers tend to come from largely unilingual homes. Perhaps the most significant finding is the emergence of the beginnings of a generational language shift from Afrikaans to English in the metropolitan area. Many respondents appear to speak English to their siblings and parents, but Afrikaans to their grandparents. And some parents appear to speak English to their children, while still speaking Afrikaans to each other. The possible demise of Afrikaans as a public language (cf Giliomee 2003) may therefore be dialectically linked to a shift to English in the private sphere of the family. Language preference figures confirm the hegemony of English in Greater Cape Town, and its growing influence in the rural areas – at the expense of both Afrikaans and isiXhosa. Attitudes towards isiXhosa amongst Afrikaans- and English-speakers are contradictory; results indicate the existence of both considerable antipathy towards isiXhosa, as well as the willingness to learn it. Xhosa-speakers themselves, meanwhile, make clear that they would prefer isiXhosa as LoLT and for assessment, alongside English in some cases. This positive attitude towards the home language and towards dual-medium teaching is supported by similar results obtained by the SBA/MSSA (2002) study (see 1.4).
5.3 Recommendations
98
Language policy implementation and language vitality in Western Cape primary schools
PRAESA – Occasional Papers No. 15
The recommendations that follow arise from all the studies cited in Chapter 2, as well as our own survey. Many of these recommendations can also be found in Webb (2002, particularly pp. 177–203), who provides a more wide-ranging critique of the LiEP, notes the current proclivity towards English in so-called black schooling, and who shows convincingly that ‘English proficiency in South Africa is generally not adequate for the purposes of formal learning’ (2002:187). Interested readers are also referred to Stroud’s twelve principles for educational language provisions in multilingual settings (2002: 53–70), the first (principle) of which relates to the need for community control or ownership of bilingual programmes (ibid: 53, original emphasis; see our recommendations 2–4 below). 1. Our main recommendation is that the provincial government be supported and, where necessary, pressurised to adopt the new (draft) Language Policy for Primary Schools in the Western Cape as soon as possible. The adoption and – crucially – the resourcing of the policy would enable most of the issues identified in this study to be addressed. These include the ever-present need for (1) language campaigns, literacy drives and community awareness programmes to affirm the identities of isiXhosa and Afrikaans speakers, to help shift the negative language attitudes towards Afrikaans and isiXhosa, and to establish these as public languages beyond the primary school; (2) curricular changes to facilitate home-language based teaching, learning and assessment, as well as the phasing in of third-language tuition, supported by appropriate learning materials and teacher training; (3) fostering a print environment for isiXhosa in particular, by training writers and illustrators and translators of books. Further recommendations arise directly out of the survey. 2. Include children’s views: Asking the children themselves about language use and attitudes towards use is clearly implied by the democratic impulse underlying school language policy. Large-scale quantitative measures such as language surveys should be undertaken and updated regularly, and inform education databases accordingly. These should be complemented by more qualitative measures such as language portfolios, including self-assessment schemes. 3. Think provincially, act locally: Arising out of the above, it is evident that language policy should take district-level and local particularities into account without losing the provincial vision of ‘producing’ multilingual citizens in an officially trilingual province. For example, the continued existence of apartheid-era features of many schools’ language composition, language choices (both LoLT and language subjects), language attitudes, and differential access to resources means that schools are at
99
different starting points for intervention. The divides identified in this report include those along the urban-rural axis, the ex-department axis, and the home-language axis. Implementing policy from above in a uniform manner across the province would, we submit, be a serious mistake. In short, change agents for language policy implementation need to think provincially and act locally. 4. Strengthen implementation agents: Schools should be supported in the formulation of appropriate school language policies that serve the interests of all language groups in a particular school. In view of the evident discrepancy between language policies and language practices in the schools almost a decade after the end of apartheid, it is crucial that policy implementation agents such as school governing bodies (SGBs) and Strategic Management Teams (SMTs) be enabled to integrate data on stakeholders’ language attitudes, amongst other things, with provincial language policy directives. In this regard provincial departments should take the lead in earmarking funding for training SGBs and SMTs, in conjunction with relevant non-governmental educational organizations and university education departments. 5. Update databases: Arising from the urban home-language data in particular, there is an immediate need for educational databases to be amended to allow for bilingual and multilingual home environments. At present the provincial education database makes space for only one home language per learner. Although providing for two or more home languages per learner would complicate administration initially, it would result in a more accurate and therefore more powerful tool to inform language policy implementation processes. 6. Research on language shift: More research is required to confirm the extent of the intra-generational language shift from Afrikaans to English in the metropolis, as identified in this study. By their very nature, surveys of the kind described here are likely to reflect little more than the dominant ideology. From a social transformation point of view, its findings should therefore be treated as no more than a starting point for the necessary work of awareness-raising and transforming practice. Perspectival data obtained from teachers nevertheless has the value of ascertaining language profiles and individual motivation as important variables in the teaching-learning enterprise, and must therefore be considered in policy choices. As we have seen, in the Western Cape the dominant ideology is evident in how the low status of isiXhosa in the public domain is reproduced in the schooling system and by prevailing attitudes in communities at large. The use of isiXhosa is limited mostly to local functions in communities whereas English and Afrikaans are used in the higher function domains like education, business, the media and so on. With progressive
(top-down) policies in place, transforming negative language attitudes by raising the status of isiXhosa at school and community level thus represents a major challenge. The policy emphasis on mother tongue-based bilingual education and third-language tuition represents real prospects for improved teaching and learning all round, for a more literate and productive workforce, and ultimately for contributing to the democratisation of society. As the process of integrating the various databases gathers momentum, and the policy implementation process becomes ever more complex, new ways will have to be found for interacting with and presenting the information. One such tool is language mapping, that is, the spatial arrangement of data on language phenomena in computerised (via Geographical Information Systems software) and paper forms. GIS have already been put to good use in the mapping of the urban areas in South Africa (see Williams & Van der Merwe 1996). In education, language maps could usefully act as a reference point for language planning activities such as language policy formulation, language provisioning (e.g. books), language maintenance programmes, and in determining the locus for deployment of teaching personnel with particular (language) proficiencies. Language attributes that could usefully be mapped at school, circuit, and district level onto a provincial education database would include children by home language(s), teachers by home language(s) and by language competence, schools by language(s) of learning and teaching, schools by language subjects offered, and so on. Clearly, great care will have to be taken by those with access to such sensitive information (e.g. children’s matric scores or teachers’ language proficiency) to use it responsibly, and never to the detriment of particular schools or groups of children or teachers. Yet opportunities for abuse should not deter provincial education planners and researchers from utilising language mapping for its real potential, as it stands to add a whole new dimension to informed language policy processes. Finally, it should go without saying (although it never does!) that any language policy implementation or delivery can only be as good as the information it is based on. This implies the need for ongoing, updated and targeted language surveys as one indispensable source of information for the unfolding policy process.
100
Language policy implementation and language vitality in Western Cape primary schools
PRAESA – Occasional Papers No. 15
101
References Adams, A. (2003). ‘What is the relationship between the language and the literacy backgrounds of Afrikaans-speaking children and their proficiency in English?’ Unpublished M.Phil dissertation, University of the Western Cape. Adegbija, E. (2000). ‘Language attitudes in West Africa.’ International Journal for the Sociology of Language 141:75–100. Alexander, N. (2000). ‘English unassailable but unattainable. The dilemma of language policy in South African education.’ Occasional Papers 3. Cape Town: PRAESA. Alexander, N. (2001a). ‘We are fiddling while the country’s schools are burning.’ Mail & Guardian, February 2–8:28–9. Bamgbose, A. (2000). Language and exclusion: The consequences of language policies in Africa. Hamburg: Lit. Bloch, C. (1998). ‘Literacy in the early years: teaching and learning in multilingual early childhood classrooms.’ International Journal of Early Years Education 7.1:39–59. Braam, D., Broeder, P., Extra, G., Mati, X., Plüddemann, P., Wababa, Z. (2000). ‘Language vitality and policy implementation: The Greater Cape Town primary schools survey.’ Paper presented at the Applied Language Studies and Services into the Millenium conference, University of Cape Town. Braam, D., Plüddemann, P., Wababa, Z. (2002). ‘Western Cape School Language Survey.’ Paper presented at the ALASA conference: The changing context of African languages, University of Natal. Broeder, P. & Extra, G. (1995). Minderheidsgroepen en minderheidstalen. VNG: Den Haag. Broeder, P., Extra, G., and Maartens, J. (2002). ‘Multilingualism in South Africa with a focus on KwaZulu-Natal and Metropolitan Durban.’ Occasional Papers 7. Cape Town: PRAESA. Cooper, R. (1989). Language planning and social change. Cambridge: Cambridge University Press. Crawford, A. (1996). ‘Fear and loathing in the classroom.’ Bua! 10.2:28–29. Darling-Hammond, L. (1990). ‘Instructional Policy Into Practice: “The Power of the Bottom Over the Top”’. Educational Evaluation and Policy Analysis, 12,3: pp. 233–41. De Klerk, G. (1995). ‘Slaves of English.’ In Heugh, K., Siegrühn, A & Plüddemann, P (eds.), Multilingual Education for South Africa. Johannesburg: Heinemann. 8–14. Department of Education (1997). Language-in-Education Policy. Pretoria: DoE. http://education.pwv.gov.za/Policies%20and%20Reports/ Policies/Language.htm
102
PRAESA – Occasional Papers No. 15
Desai, Z. (1999). Enabling policies, disabling practices. In Limage, L. (ed.),Comparative Perspectives on Language and Literacy. Dakar: UNESCO-BREDA, pp.175–84. Dirven, R. (1991). Language, cultural community and nation in Africa. Duisburg: LAUD (B219). Du Toit, C., Constable, P. & Kenyon, V. (1997). Curriculum 2005 discussion document. Saala Communique, June. Dyers, C. (2003). ‘Intervention and language attitudes: the effects of one development programme on the language attitudes of primary school teachers.’ Tydskrif vir Taalondderig/Journal for Language Teaching 37.1:60–73. Extra, G. & Maartens, J. (eds) (1998). Multilingualism in a Multicultural Context. Case Studies on South Africa and Western Europe. Tilburg: Tilburg University Press. Extra, G., Aarts, R., Van der Avoird, T., Broeder, P., & Yagmur, K. (2002). De andere talen van Nederland: thuis en op school. Bussum: Coutinho. Extra, G. & Yagmur, K. (eds) (forthcoming, 2004). Urban multilingualism in Europe. Immigrant minority languages at home and at school. Clevedon: Multilingual Matters. Fasold, R. (1984). The sociolinguistics of society. Oxford: Blackwell. Fishman, J. (1971). Language and nationalism. Rowley, Mass.: Newbury House. Giles, H., Bourhis, R.Y. & Taylor, D.M. (1977). ‘Towards a Theory of Language in Ethnic Group Relations.’ In Giles H. (ed.), Language, Ethnicity and Intergroup Relations. London: Academic Press. 307–48. Giliomee, H. (2003). ‘The rise and possible demise of Afrikaans as a public language.’ Occasional Papers no. 14. Cape Town: PRAESA. Gogolin, I. (1997). ‘The “monolingual habitus” as the common feature in teaching in the language of the majority in different countries.’ Per Linguam 13.2: 38–49. Granville, S., Hanks, H., and Joseph, M. et al. (1997). ‘English with or without guilt: A position paper on language in education policy for South Africa.’ Unpublished. Hartshorne, K. (1995). ‘Language policy in African education: a background to the future.’ In R. Mesthrie (ed.), Language and social history. Studies in South African sociolinguistics. Cape Town/Johannesburg: David Philip, 306–18. Heugh, K. (1995). ‘Disabling and enabling: implications of language policy trends in South Africa.’ In R. Mesthrie (ed.), Language and social history. Studies in South African sociolinguistics. Cape Town/ Johannesburg: David Philip, 329–50. Heugh, K. (1999). ‘Languages, development and reconstructing education in South Africa.’ International Journal of Educational Development 19:301–13. Language policy implementation and language vitality in Western Cape primary schools
103
Heugh, K. (2000). ‘The case against bilingual and multilingual education in South Africa.’ Occasional Papers 6. Cape Town: PRAESA. Heugh, K. (2003). Language policy and democracy in South Africa. The prospects of equality within a rights based policy and planning. Ph.D thesis, University of Stockholm. Stockholm: Centre for Research on Bilingualism. Heugh, K., Siegrühn, A. & Plüddemann, P. (eds) (1995). Multilingual education for South Africa. Johannesburg: Heinemann. Jansen, J. (2001). ‘Rethinking Education Policy Making in South Africa: Symbols of Change, Signals of Conflict’. In Kraak, A, and Young, M. (eds.), Education in Retrospect. Policy and Implementation Since 1990. Pretoria/London: Human Sciences Research Council & Institute of Education, University of London, pp. 41–57. Language Plan Task Group (LANGTAG) (1996). Towards a National Language Plan for South Africa. Overview, Recommendations and Executive Summary. Part I of the final LANGTAG Report. Pretoria: Department of Arts, Culture, Science and Technology. Maartens, J. (1998). ‘Multilingualism and language policy in South Africa.’ In Extra, G. & Maartens, J. (eds), Multilingualism in a multicultural context. Case studies on South Africa and Western Europe. Tilburg: Tilburg University Press. Studies in Multilingualism 10, 15–36. Makoni, S. (1998). ‘African languages as European scripts: The shaping of communal memory’. In Nuttall, S. &. Coetzee, C. (eds), Negotiating the Past: The Making of Memory in South Africa. Cape Town: Oxford University Press. Malherbe, E.G. (1943). The Bilingual School. Johannesburg: Central News Agency. McCormick, K. (1995). ‘Code-switching, code-mixing and convergence in Cape Town.’ In Mesthrie, R. (ed.), Language and Social History. Cape Town & Johannesburg: David Philip. Mesthrie, R. (ed.) (1995). Language and social history. Studies in South African sociolinguistics. Cape Town/Johannesburg: David Philip. National Centre for Curriculum Research and Development (2000). Language in the Classroom. Towards a framework for intervention. Pretoria: Department of Education. October, M. (2002). ‘Medium of instruction and its effect on matriculation examination results for 2000, in Western Cape Secondary Schools.’ Occasional Paper No.11. Cape Town: PRAESA. PanSALB (1999). Annual report June 1999. Pretoria: Pan South African Language Board. Pan South African Language Board (2001). Summary of the findings of: A Sociolinguistic survey on Language Use and Language Interaction in South Africa. Pretoria: Pansalb.
Phillipson, R. (1988). ‘Linguicism: Structures and ideologies in linguistic imperialism’. In Skutnabb-Kangas, T. & Cummins, J. (eds) Minority Education: From Shame to Struggle. Clevedon: Multilingual Matters. Plüddemann, P. (1999). ‘Multilingualism and education in South Africa: one year on.’ International Journal of Educational Research 3 (4), 327340. Plüddemann, P. (2003). ‘Majority as minority: The case of isiXhosa in the Western Cape province of South Africa.’ Unpublished conference paper, June. Plüddemann, P., Mati, X. & Mahlalela-Thusi, B. (2000). ‘Problems and Possibilities in Multilingual Classrooms in the Western Cape’. Occasional Papers 2. Cape Town: PRAESA. Plüddemann, P., Braam, D., Broeder, P., Extra, G., October, M., with Wababa, Z. (forthcoming). ‘Language Vitality and Language Policy: Urban and Rural/Town Primary Schools in the Western Cape’. Project for the Study of Alternative Education in South Africa (PRAESA) (2002). ‘Dual- and parallel-medium education in Western Cape schools’. Unpublished report to the WCED. Schlebusch, A. (1994). ‘Non-Racial Schooling in Selected Cape Town Schools: Language, Attitudes and Language Learning’. Unpublished M.Phil dissertation, University of Cape Town. Schools Development Unit (SDU) & PRAESA (2002). Language Research: Interim Report Executive Summary. Unpublished report for the Western Cape Education Department. Statistics South Africa (2003). Census in Brief. http://www.statssa.gov.za/ Steyn, J. (1992). ‘Die behoud van Afrikaans as ampstaal’. In Webb, V. (ed.), Afrikaans na apartheid. Pretoria: JL van Schaik, 201–26. Stigting vir die Bemagtiging deur Afrikaans (SBA)/Marketing Surveys & Statistical Analysis (MSSA) (2002). ‘Language attitude survey relating to education in the Western Cape 2002’. Final Report, quantitative research, August. Unpublished report for the Western Cape Education Department. Stroud, C. (2002). Towards a Policy for Bilingual Education in Developing Countries. Stockholm: Swedish International Development Cooperation Agency (SIDA) & Department for Democracy and Social Development, DESO Education Division. Van der Avoird, T., Extra, G. & Broeder, P. (2001). ‘Immigrant minority languages in the Netherlands’. In Extra, G. & Gorter, D. (eds), The other languages of Europe. Demographic, sociolinguistic and educational perspectives. Clevedon: Multilingual Matters. 215–42. Webb, V. (2002). Language in South Africa: The role of language in national transformation, reconstruction and development. Amsterdam/Philadelphia: John Benjamins.
104
Language policy implementation and language vitality in Western Cape primary schools
PRAESA – Occasional Papers No. 15
105
Webb, V. (ed.) (1995). Language in South Africa. An input into language planning for a post-apartheid South Africa. The Licca (SA) Report. Pretoria: University of Pretoria. Western Cape Education Department (2002). Language Policy for Primary Schools in the Western Cape. http://wced.wcape.gov.za/documents/ lang_policy/ Western Cape Education Department (n.d.). Language is for Learning. Language Development and Support. Cape Town: WCED. Working Group on Values in Education (2000). Values, Education and Democracy. Report. http://education.pwv.gov.za/Policies_Reports/ Reports_2000/Values.htm
Endnotes
106
Language policy implementation and language vitality in Western Cape primary schools
PRAESA – Occasional Papers No. 15
i
This paper is an edited version of the more detailed report on the survey (Plüddemann et al. forthcoming). ii The appellation of ‘so-called’ signals our attempt to problematise the politically controversial term ‘Bantu languages’. For a fuller discussion of the term, see 1.4, below. iii For a more comprehensive list of criticisms and possible remedies, see Webb 2002:177–183. iv Results of the 2001 population census may be found at www.statssa.gov.za v See our discussion of the PanSALB/Markdata survey, which reports that 35% of South Africans report two (or more) home languages. vi Termed language monopoly by Van der Avoird et al. (2001), exclusive use of a language can be calculated once the numbers of speakers by home language (HL) are established, and the numbers of bi- and multilingual homes are subtracted from this. vii For convenience’ sake we follow SBA/MSSA 2002 in their use of some of these terms. iix The towns listed here vary greatly in size, e.g. George municipality has 135 000 inhabitants while Swellendam has 28 000 (source: Statssa 2003). ix In the last decade or so of apartheid, schools for classified ‘blacks’ (Africans) fell under the Department of Education and Training (henceforth ex-DET schools) and its Bantustan equivalents; schools for classified ‘coloureds’ fell under the Department of Education and Culture, House of Representatives (henceforth ex-HoR schools); and schools for classified ‘whites’ fell under the House of Assembly. However, given the similarity in names between ex-HoR and ex-HoA, we decided to use the older term for schools formerly reserved for ‘whites’, namely Cape Education Department (exCED) schools. x For example, data provided by the Western Cape Education Department (WCED) on children’s home languages for the same 49 sample schools for 1999 was as follows: Afrikaans 38%, English 32%, isiXhosa 28%, other 3% (source: WCED EMIS unit). xi We deploy the term ‘unilingual’ to refer to the use of only one language. By contrast, ‘monolingual’ refers to proficiency in only one language. There is a precedent for the term ‘unilingual’ in South African research on bilingual education. In The Bilingual School, Malherbe (1943:35ff.) refers to schools that use only one language of learning and teaching as unilingual medium schools. xii See Chapter 3 for an explanation of these terms.
107
xiii As provided for in the 2002 (draft) Language Policy for Primary Schools in the Western Cape. xiv A point often made by Neville Alexander (personal communication), and hinted at by Adegbija (2000). xv PRAESA’s Language Mapping and Surveys unit has committed itself to educational language mapping, in the Western Cape initially. The paragraphs cited derive from an internal project proposal. For more information, contact Daryl Braam (
[email protected]), Michellé October (
[email protected]) or Peter Plüddemann (
[email protected]).
Appendices
108
Language policy implementation and language vitality in Western Cape primary schools
PRAESA – Occasional Papers No. 15
1. 2. 3. 4.
English version of the children’s questionnaire, page 110 Afrikaans version of the children’s questionnaire, page 112 IsiXhosa version of the children’s questionnaire, page 114 Urban vs. rural/town children: Comparative overview of main findings, page 116
109
PRIMARY SCHOOLS LANGUAGE SURVEY , WESTERN CAPE PROVINCE
Answer the questions below by colouring in the dots. Languages not listed can be written in the last four columns.
Afrikaans
English
10. What is your favourite TV programme?
O O O O O O O O O O O O O
O O O O O O O O O O O O O
O O O O O O O O O O O O O
O O O O O O O O O O O O O
O O O O O O O O O O O O O
O O O O O O O O O O O O O
O O O O O O O O O O O O O
O 17 O 18 O 19 O 20 O 21 O 22
11. [Grade 1 ONLY] In which language does your teacher speak to you?
O
O
O
O
O
O
O
3. In which Grade are you?
12. [Grade 1 ONLY] In which language would you like your teacher to speak to you? 13. Which language(s) do you learn at school?
O O
O O
O O
O O
O O
O O
O O
14. Which other language/s would you like to learn at school?
O
O
O
O
O
O
O
15. [Grade 7 ONLY] In which language are your content subjects (e.g. science, history) taught?
O
O
O
O
O
O
O
16. [Grade 7 ONLY] In which language would you like your content subjects to be taught?
O
O
O
O
O
O
O
17. [Grade 7 ONLY] In which language do you write your tests and exams for the content subjects?
O
O
O
O
O
O
O
20. Which language do you most like to speak?
O O O
O O O
O O O
O O O
O O O
O O O
O O O
21. Which language, if any, do you not like to speak?
O
O
O
O
O
O
O
© 2001 PRAESA, University of Cape Town, & Babylon, Universiteit Tilburg, Nederland
Fill in the form with a black or a blue pen. Please do not use a pencil. 1. What is your first name and surname?
7. Which languages are spoken in your home? 8. Which language(s) do you – understand? – speak? – read? – write? 9. In which language(s) do you speak to – your mother? – your father? – your brother(s) or sister(s)? – your grandparents? – with the shopkeeper or cashier? – with your best friend?
2. How old are you? O 5 O 6
O 7
O 8
O 9
O 10
O 11 O 12 O 13 O 14 O 15 O 16
O
Grade 1
O Grade
7
4. Gender:
O female
O male
5. In which country were you born?
– in church/ the mosque/the synagogue?
18. [Grade 7 ONLY] In which language would you like to write your exams for the content subjects? 6. What is the name of your school?
110
19. Which language do you speak best?
PRAESA – Occasional Papers No. 15
Xhosa
Language policy implementation and language vitality in Western Cape primary schools
111
UPHANDO NGOLWIMI: N TSHONA K OLONI, WIZIKOLO Z AMABANGA A PHANTSI
Phendula le mibuzo ingezantsi ngokwenza umbala kumachokoza. Iilwimi ezingabhalwanga apha zingabhalwa kwikolamu ezine zokugqibela.
iAfrikaans
Isi-ngesi
10. Ngeyiphi ingqubo kamabona kude oyithandayo?
O O O O O O O O O O O O O
O O O O O O O O O O O O O
O O O O O O O O O O O O O
O O O O O O O O O O O O O
O O O O O O O O O O O O O
O O O O O O O O O O O O O
O O O O O O O O O O O O O
O 17 O 18 O 19 O 20 O 21 O 22
11. [Ibakala 1kuphela] Utitshala wakho usebenzisa eziphi iilwimi xa ethetha nawe?
O
O
O
O
O
O
O
3. Ufunda kweliphi ibakala?
12. [Ibakala 1 kuphela] Zeziphi iilwimi ongathanda ukuba utitshala wakho azisebenzise xa ethetha nawe?
O Kwibakala 1
13. Zeziphi iilwimi ozifunda esikolweni?
O O
O O
O O
O O
O O
O O
O O
14. Zeziphi ezinye iilwimi ongathanda ukuzifunda esikolweni?
O
O
O
O
O
O
O
15. [Ibakala 7 kuphela] Loluphi ulwimi izifundo ezizi ‘content subjects’ (umz. ‘science, history’) ezifundiswa ngalo?
O
O
O
O
O
O
O
16. [Ibakala 7 kuphela] Loluphi ulwimi izifundo ezizi ‘content subjects’ ongathanda ukuba zifundiswe ngalo?
O
O
O
O
O
O
O
17. [Ibakala 7 kuphela] Loluphi ulwimi obhala ngalo iimviwo zakho kwii ‘content subjects’?
O
O
O
O
O
O
O
20. Loluphi onqwenela ukuluthetha kakuhle?
O O O
O O O
O O O
O O O
O O O
O O O
O O O
21. Loluphi ulwimi ongaluthandiyo okuluthetha?
O
O
O
O
O
O
O
© 2001 PRAESA, University of Cape Town, & Babylon, University of Tilburg, The Netherlands Zalisa le fomu ngepeni emnyama okanye eblowu. Nceda ungasebenzisi ipensile.
7. Zeziphi iilwimi ezisetyenziswa ekhaya? 8. Zeziphi iilwimi – oziqondayo? – ozithethayo? – ozifundayo? – ozibhalayo? 9. Ezi lwimi uzisebenzisa – nomama wakho?
1. Ungubani igama nefani?
– notata wakho? – noobhuti noosisi bakho? – oomawokhulu bakho? – nonovenkile okanye umthengisi?
2. Uneminyaka emingaphi? O 5 O 6
O 7
O 8
– nomhlobo wakho omthandayo? O 9
O 10
O 11 O 12 O 13 O 14 O 15 O 16
O Kwibakala 7
4. Isini: O Uyintombazana?
O Uyinkwenkwe?
5. Wazalelwa kweliphi ilizwe?
– eCaweni/eNkonzweni/kuBhedesho?
18. [Ibakala 7 kuphela] Loluphi ulwimi ongathanda ukubhala ngalo iimviwo zakho kwii ‘content subjects’? 6. Yintoni igama lesikolo sakho?
112
19. Loluphi ulwimi oluthetha kakuhle?
PRAESA – Occasional Papers No. 15
Isi-Xhosa
Language policy implementation and language vitality in Western Cape primary schools
113
T AALPEILING P RIMÊRE SKOLE, WE S-K AAPLAND © 2001 PRAESA, Universiteit Kaapstad, & Babylon, Universiteit Tilburg, Nederland
Beantwoord die vrae hieronder deur die kolletjies in te kleur. Tale wat nie genoem is nie kan in die laaste D vier kolomme ingevul word.
10. Wan watter TV program hou jy die meeste?
O O O O O O O O O O O O O
O O O O O O O O O O O O O
O O O O O O O O O O O O O
O O O O O O O O O O O O O
O O O O O O O O O O O O O
11. [GRAAD 1 ALLEENLIK] In watter taal (tale) praat jou onderwyser/es met jou?
O
O
O
O
O
O
O
13. Watter taal (tale) leer jy op skool?
O O
O O
O O
O O
O O
O O
O O
14. Watter ander taal (tale) sou jy graag op skool wou leer?
O
O
O
O
O
O
O
15. [Graad 7 alleenlik] In watter taal word jou inhoudsvakke (bv. Wetenskap, Geskiedenis) vir jou geleer?
O
O
O
O
O
O
O
16. [Graad 7 alleenlik] In watter taal sou jy graag onderrig in die inhoudsvakke wou ontvang?
O
O
O
O
O
O
O
17. [Graad 7 alleenlik] In watter taal skryf jy toetse en eksamens vir die inhoudsvakke?
O
O
O
O
O
O
O
20. Van watter taal hou jy die meeste om te praat?
O O O
O O O
O O O
O O O
O O O
O O O
O O O
21. Van watter taal, indien enige, hou jy nie?
O
O
O
O
O
O
O
– lees? – skryf? 9. Watter taal praat jy met – jou ma? – jou pa? – jou broer(s) en suster(s)? – jou oupa(s) en ouma(s)? – die kassier of winkelier?
2. Hoe oud is jy? O 5
O 6
O 7
– jou beste vriend of vriendin? O 8
O 9
O 10
O 11
O 12 O 13 O 14 O 15 O 16
O 17
O 18 O 19 O 20 O 21 O 22
3. In watter graad is jy? O Graad 1 O Graad 7 4. Geslag: O vroulik
O manlik
5. In watter land is jy gebore?
– in die kerk/ die moskee /die sinagoge?
12. [GRAAD 1 ALLEENLIK] In watter taal (tale) sou jy verkies dat jou onderwyser/es met jou praat?
18. [Graad 7 all.] In watter taal sou jy graag jou toetse en eksamens vir die inhoudsvakke wou skryf? 6. Wat is die naam van jou skool?
114
Xhosa
O O O O O O O O O O O O O
– verstaan?
– praat?
1. Wat is jou naam en van?
Engels
O O O O O O O O O O O O O
7. Watter taal (tale) word by julle tuis gebruik? 8. Watter tale kan jy
Vul die vorm in met ’n swart of blou pen. Geen potlood gebruik nie, sseblief.
Afrikaans
19. Watter taal praat jy die beste of vlotste?
PRAESA – Occasional Papers No. 15
Language policy implementation and language vitality in Western Cape primary schools
115
URBAN VS. RURAL/TOWN CHILDREN: COMP ARATIVE OVER VIEW OF MAIN FINDINGS URBAN SURVEY (a)
STATUS
Three major home languages, namely Afrikaans, English and isiXhosa, but fewer than expected smaller home languages;
(b) English has replaced Afrikaans as the most widely-used home language amongst primary school children in the metropolis, something that could indicate the beginnings of a language shift from Afrikaans; (c)
the ascendancy of isiXhosa over Afrikaans as a home language amongst younger (i.e. Grade 1) respondents;
(d)
major differences between the Grade 1 and Grade 7 cohorts. The explanation may lie in the greater language repertoire Grade 7 children enjoy on account of their schooling.
(a)
A very high incidence of Afrikaans-English bilingual homes (or language concurrence), particularly at Grade 7 level. The widespread presence of English in Afrikaans-speaking homes raises the question whether it is not more accurate to refer to an Afrikaans/English bilingual group (unexpected);
INDICATOR
Inventory of
RURAL/TOWN (a)
Three major home languages, namely Afrikaans, English and isiXhosa, and a few smaller home languages;
(b)
the majority of children come from Afrikaans-speaking homes;
(c)
isiXhosa has not (yet) eclipsed English as the second largest language in the province, despite the economically-driven inmigration of Xhosa-speakers from the Eastern Cape.
(a)
The majority of children come from unilingual Afrikaans-speaking homes, with a large Afrikaans exclusive-use value;
(b)
the existence of a fairly large unilingual Xhosa-speaking minority.
(a)
The numbers for language choice and home language use are similar for all three groups of children, i.e. that most children use Afrikaans;
(b)
an increase in the use of English in interactions with shopkeepers and best friends, in relation to family members.
(a)
Language proficiency figures largely reflect figures for homelanguage use;
(b)
there is only a slightly lower number of children who indicate that they can read and write in isiXhosa than those who indicate that they can understand and speak isiXhosa, i.e. that there is no significant drop-off from oral to written language proficiency;
(c)
where such a gap exists it is most likely to be found in ex-CED schools.
home languages
Language repertoire
SURVEY
(b) Xhosa-speakers come from mainly unilingual homes, i.e. isiXhosa has a high exclusive-use value in the home (expected); (c)
major differences between the Grade 1 and Grade 7 cohorts.
(a)
Widespread use of English in interactions and transactions with significant others;
(b)
interactions with family members tend to be mostly unilingual, despite the high incidence of bilingual homes;
(c)
major differences in language choice patterns between Grade 1 and Grade 7 respondents;
(d)
that many parents appear to speak to their children in English, even though they (still) converse with each other in Afrikaans;
(e)
that language choice in interaction with shopkeepers shows the commercial power of English at the expense of other languages among the Grade 7s; Grade 1s tend to use English to the same extent with shopkeepers as with family members. In the African townships most transactions of a commercial, interpersonal and religious nature are still conducted in isiXhosa.
(a)
Reported proficiency in speaking amongst our urban Grade 1 sample broadly matches home- language use;
(b)
an enormous impact of English on Afrikaans-speakers and Xhosa-speakers by Grade 7, measured by reported English proficiency levels for all three language groups;
(c)
reported literacy levels in the home language amongst the Grade 7 isiXhosa HL group did turn out to be low, particularly amongst those enrolled in ex-HoR schools;
(d)
a very low number of Afrikaans HL and English HL children reporting (third-language) proficiency in isiXhosa, denoting the current low status of isiXhosa in the curriculum.
Language choice
Language proficiency
... contd over
116
PRAESA – Occasional Papers No. 15
Language policy implementation and language vitality in Western Cape primary schools
117
URBAN VS. RURAL/TOWN CHILDREN: COMPARATIVE OVERVIEW OF MAIN FINDINGS: contd URBAN SURVEY
STATUS
INDICATOR
(a)
English has replaced Afrikaans as the dominant language among Grade 7 children in the Greater Cape Town area;
(b)
a preference for English amongst all three home language groups, particularly amongst English-HL and isiXhosa-HL speakers, suggesting that English acquires increasing status through schooling;
(c)
isiXhosa suffers a significant loss of vitality by the time children reach Grade 7, a function of its status as a mere transition to English;
(d)
some ambivalence towards Afrikaans, indicating its changing status in a multilingual society; • no particular preference for Afrikaans amongst ex-CED (‘white’) Afrikaans-dominant speakers, illustrating a loosening of the historical-cultural links between language and identity;
(e)
considerable antipathy towards Afrikaans amongst Xhosa-speakers and, to a lesser extent, among English-speakers, particularly at Grade 7 level,
(f)
some negative language attitudes towards isiXhosa amongst Afrikaans-HL and English-HL speakers, particularly at Grade 7 level – again pointing to the insidious influence of schooling and ultimately of a society in which most of the language practices and attitudes continue to reflect the apartheid era.
(a)
Apartheid-era language subject practices continue to apply, i.e. that Afrikaans- and Englishspeakers take Afrikaans and English as subjects, and Xhosa-speakers take isiXhosa, English, and Afrikaans; significant home-language deprivation endured by Grade 7 isiXhosa HL respondents in exHoR schools, where isiXhosa is mostly not offered; many English- and Afrikaans-speakers are surprisingly open to learning isiXhosa, particularly at Grade 7 level; little interest in learning other languages (with the possible exception of French), even amongst Grade 7 urban respondents.
Language subjects
(a)
Disjunctures exist between the LoLT and the home languages of many Grade 7 children amongst both isiXhosa HL and Afrikaans HL speakers;
(b)
in such cases of language mismatch many children, particularly the Xhosa-speakers, prefer to study through the medium of their HL;
Language of teaching and of assessment (Grade 7)
(c)
more than half of all Afrikaans-speaking children are being taught through the medium of English, and prefer to be assessed in English.
(b) (c) (d)
118
PRAESA – Occasional Papers No. 15
Language dominance and language preference
RURAL/TOWN
SURVEY
(a) (b)
Afrikaans is the dominant language by a considerable margin; attitudes towards Afrikaans do not correspond completely to proficiency in the language, i.e. there is substantial antipathy towards Afrikaans, even amongst those who speak Afrikaans;
(c) (d)
many Xhosa-speakers have a strong preference for English; considerable antipathy towards isiXhosa, both amongst non-Xhosaspeakers and Xhosa-speakers. The low status of isiXhosa in schooling and society underlies the negative attitudes towards the language.
(a)
Apartheid-era language subject practices still obtain, i.e. that Afrikaans- and English-speakers take mainly Afrikaans and English as subjects, and Xhosa-speakers take isiXhosa, English, and Afrikaans;
(b) there was little interest amongst English- and Afrikaans-speakers in learning isiXhosa or other African languages; (c)
there was considerable interest in learning foreign European languages.
(a)
Some discrepancies between the LoLT and the home languages of many Grade 7 children, for both the Afrikaans HL and isiXhosa HL groups; Predictably, many would prefer to study through the medium of their HL in order to sidestep the deleterious effects of the language mismatch
(b)
Language policy implementation and language vitality in Western Cape primary schools
119
Other publications in the series of PRAESA Occasional Papers 1. Bloch, C. 1998. ‘Literacy in the Early Years: Teaching and Learning in Multilingual Early Childhood Classrooms’. 2. Plüddemann, P., Mati, X. and Mahlalela-Thusi, B. 2000. ‘Problems and Possibilities in Multilingual Classrooms in the Western Cape’. 3. Alexander, N. 2000. English ‘Unassailable but Unattainable: The Dilemma of Language Policy in South African Education’. 4. Wolff, E.H. 2000. ‘Pre-school Child Multilingualism and its Educational Implications in the African Context’. 5. Vesely, R. 2000. ‘Multilingual Environments for Survival: The Impact of English on Xhosa-Speaking Students in Cape Town’. 6. Heugh, K. 2000. ‘The Case Against Bilingual and Multilingual Education in South Africa’. 7. Broeder, P., Extra, G. and Maartens, J. 2002. ‘Multilingualism in South Africa with a focus on KwaZulu-Natal and Metropolitan Durban’. 8. Bloch, C. 2002. ‘Concepts of Early Childhood Development, Literacy Learning and Materials Development in Multilingual Settings’. 9. Heugh, K. 2002. ‘Revisiting Bilingual Education in and for South Africa’. 10. Mahlalela, B. and Heugh, K. 2002. ‘Terminology and Schoolbooks in Southern African languages: Aren’t there any?’. 11. October, M. 2002. ‘Medium of Instruction and its Effect on Matriculation Examination Results for 2000, in Western Cape Secondary Schools’. 12. Perry, T. 2003. ‘Language Rights, Ethnic Politics: A Critique of the Pan South African Language Board’. 13. Alexander, N. 2003. ‘The African Renaissance and the Use of African Languages in Tertiary Education’. 14. Giliomee, H. 2003. ‘The Rise and Possible Demise of Afrikaans as a Public Language’.