arXiv:1303.2511v2 [physics.atm-clus] 5 Oct 2014
Large-scale first principles configuration interaction calculations of optical absorption in aluminum clusters Ravindra Shindea∗ and Alok Shuklab∗ Department of Physics, Indian Institute of Technology Bombay, Mumbai, Maharashtra 400076, INDIA. E-mail:
[email protected];
[email protected]
Phone: +91 (0)22 25764558. Fax: +91 (0)22 25767552
Abstract We report the linear optical absorption spectra of aluminum clusters Aln (n=2–5) involving valence transitions, computed using the large-scale all-electron configuration interaction (CI) methodology. Several low-lying isomers of each cluster were considered, and their geometries were optimized at the coupled-cluster singles doubles (CCSD) level of theory. With these optimized ground-state geometries, excited states of different clusters were computed using the multi-reference singles-doubles configuration-interaction (MRSDCI) approach, which includes electron correlation effects at a sophisticated level. These CI wave functions were used to compute the transition dipole matrix elements connecting the ground and various excited states of different clusters, and thus their photoabsorption spectra. The convergence of our ∗ To
whom correspondence should be addressed † Electronic Supplementary Information (ESI) available: A detailed information about wave functions of excited states contributing to various photoabsorption peaks is presented in the supplementary information (Table I through IX). See DOI: 10.1039/b000000x/ a Department of Physics, Indian Institute of Technology Bombay, Mumbai, Maharashtra 400076, India. Fax: +91 22 2576 7552; Tel: +91 22 2576 4558; E-mail:
[email protected] b Department of Physics, Indian Institute of Technology Bombay, Mumbai, Maharashtra 400076, India. Fax: +91 22 2576 7552; Tel: +91 22 2576 7576; E-mail:
[email protected]
1
results with respect to the basis sets, and the size of the CI expansion, was carefully examined. Our results were found to be significantly different as compared to those obtained using time-dependent density functional theory (TDDFT) [Deshpande et al. Phys. Rev. B, 2003, 68, 035428]. When compared to available experimental data for the isomers of Al2 and Al3 , our results are in very good agreement as far as important peak positions are concerned. The contribution of configurations to many body wavefunction of various excited states suggests that in most cases optical excitations involved are collective, and plasmonic in nature.
1. Introduction
Metal clusters are promising candidates in the era of nanotechnology. The reason behind growing interest in clusters lies in their interesting properties and a vast variety of potential technological applications. 1–5 Moreover, simple theoretical models can be exploited to describe their properties. Various jellium models have successfully described electronic structures of alkali metal clusters, because alkali metals have free valence electrons. 4 This beautifully explains the higher abundance of certain clusters. However, in case of aluminum clusters, the experimental results often provide conflicting evidence about the size at which the jellium model would work. 6,7 The theoretical explanation also depends on the valency of aluminum atoms considered. Since s–p orbital energy separation in aluminum atom is 4.99 eV, and it decreases with the cluster size, the valency should be changed from one to three. 8 Perturbed jellium model, which takes orbital anisotropy into account, has successfully explained the mass abundance of aluminum clusters. 9,10 Shell structure and s–p hybridization in anionic aluminum clusters were probed using photoelectron spectroscopy by Ganteför and Eberhardt, 11 and Li et al. 7 Evolution of electronic structure and other properties of aluminum clusters has been studied in many reports. 7–9,12–26 Structural properties of aluminum clusters were studied using density functional theory by Rao and Jena. 8 An all electron and model core potential study of various Al clusters was carried out by Martinez et al. 22 Upton performed chemisorption calculations on aluminum clusters and reported that Al6 is the smallest cluster that will absorb H2 . 9 DFT alongwith molecular dynamics were used
2
to study electronic and structural properties of aluminum clusters. 19 Among more recent works, Drebov and Ahlrichs 25 presented a very detailed and systematic study of geometrical structure and electronic properties of large Al clusters ranging from Al23 to Al34 , and their anions and cations. Alipour and Mohajeri 26 performed a comprehensive study of the electronic structure, ionization potential, and static and dynamic polarizabilities (at a fixed frequency) of clusters ranging from Al3 to Al31 . Although the photoabsorption in alkali metal clusters has been studied by many authors at various levels of theory, 4,27 however, very few theoretical calculations of the photoabsorption spectra in aluminum clusters exist. 28,29 As far experimental studies of optical absorption in aluminum clusters are concerned, several studies have been performed on Al2 30–33 and Al3 . 32,34–36 Nevertheless, to the best of our knowledge, no experimental measurements of optical properties of larger aluminum clusters have been performed. Conventional mass spectrometry only distinguishes clusters according to the masses. Hence, theoretical results can be coupled with the experimental measurements of optical absorption, to distinguish between different isomers of a cluster. This is important for clusters of increasing larger sizes for which several possible isomers exist. We have recently reported results of such calculation on small boron clusters. 37 In this paper, we present results of systematic calculations of linear optical absorption involving transitions among valence states in various low-lying isomers of small aluminum clusters using ab initio large-scale multi-reference singles doubles configuration interaction (MRSDCI) method. In our group, in the past we have successfully employed the MRSDCI approach to compute the photoabsorption spectra of a number of conjugated polymers, 38–41 and boron clusters. 37,42 Therefore, it is our intention in this work to test this approach on clusters made up of larger atoms, namely aluminum, and critically analyze its performance. Furthermore, the nature of optical excitations involved in absorption has also been investigated by analyzing the wave functions of the excited states. Upon comparing calculated optical absorption spectra of Al2 and Al3 , we find very good agreement with the available experimental data on important peaks. This suggests that the MRSDCI
3
approach is equally effective for Al clusters, as it was, say, for boron clusters. 37,42 For larger clusters, for which no experimental data is available, we compare our results with the time-dependent density functional theory (TDDFT) based calculations of Deshpande et al. 28 corresponding to the minimum energy configurations, and find significant differences. Remainder of the paper is organized as follows. Next section discusses theoretical and computational details of the calculations, followed by section 3, in which results are presented and discussed. Conclusions and future directions are presented in section 4. A detailed information about the nature of optical excitation, molecular orbitals of clusters, wave functions of excited states contributing to various photoabsorption peaks is presented in the supplementary information. 43
2. Theoretical and Computational Details
The geometry of various isomers were optimized using the size-consistent coupled-cluster singlesdoubles (CCSD) method, as implemented in the
GAUSSIAN
311++G(2d,2p) was used which was included in the
09 package. 44 A basis set of 6-
GAUSSIAN
09 package itself. This basis
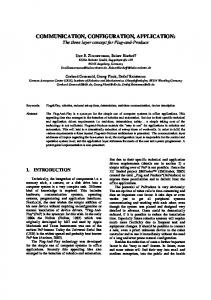
set is optimized for the ground state calculations. We repeated the optimization for singlet and triplet systems on even numbered electron systems to look for the true ground state geometry. Similarly, for odd numbered electron systems, doublet and quartet multiplicities were considered in the geometry optimization. To initiate the optimization, raw geometries, reported by Rao and Jena, based on density functional method were used. 8 Figure 1 shows the final optimized geometries of the isomers studied in this paper. Using these optimized geometries, correlated calculations were performed using multireference singles doubles configuration interaction (MRSDCI) method for both ground state and excited states. 45 This method considers a large number of singly- and doubly- substituted configurations from a large number of reference configurations, and, is well suited for both ground and excited states calculations. It takes into account the electron correlations which are inadequately represented in single reference ab initio methods. These ground- and excited-state wavefunctions are 4
further used to calculate the transition dipole moment matrix elements, which in turn, are utilized to compute linear optical absorption spectrum assuming a Lorentzian line shape. Various wave functions of the excited states contributing to the peaks in the spectrum obtained using a low-level CI calculations were analyzed, and even bigger MRSDCI calculations were performed by including more references, if needed. The criteria of choosing a reference configuration in the calculation was based upon the magnitude of the corresponding coefficients in the CI wave function of the excited states contributing to a peak in the spectrum. This process was repeated until the spectrum converges within acceptable tolerance and all the configurations which contribute to various excited states were included. The typical total number of configurations considered in the calculations of various isomers is given in Table 1. We have extensively used such approach in performing large-scale correlated calculations of linear optical absorption spectra of conjugated polymers, 38–41 and atomic clusters. 37,42 The CI method is computationally very expensive, mainly, because the number of determinants to be considered increases exponentially with the number of electrons, and the number of molecular orbitals. Calculations on bigger clusters are prohibitive under such circumstances, and are very time consuming even for the clusters considered here. Point group symmetries (D2h , and its subgroups) were taken into account, thereby making calculations for each symmetry subspace independent of each other. The core of the aluminum atom was frozen from excitations, keeping only three valence electrons active per atom. Also an upper limit on the number of virtual orbitals was imposed, to restrict very high energy excitations. The effect of these approximations on the computed photoabsorption spectra has been studied carefully, and is presented in the next section.
3. Results and Discussion
In this section, first we present a systematic study of the convergence of our results and various approximations used. In the latter part, we discuss the results of our calculations on various clusters. 3.1. Convergence of calculations. In this section we discuss the convergence of photoab-
sorption calculations with respect to the choice of the basis set, and the size of the active orbital 5
(a) Al2 , D∞h , 3 Πu
(b) Al2 , D∞h , 3 Σg
(f) Al4 , D2h , 3 B2g
′
(c) Al3 , D3h , 2 A1
(g) Al4 , D4h , 3 B3u
(d) Al3 , C2v , 4 A2
(h) Al5 , C2v , 2 A1
(e) Al3 , D∞h , 4 Σu
(i) Al5 , C4v , 2 A1
Figure 1. Geometry optimized structures of aluminum clusters with point group symmetry and the electronic ground state at the CCSD level. All numbers are in Å unit. space. 3.1.1 Choice of basis set In the literature several optimized basis sets are available for specific purposes, such as ground state optimization, excited state calculations etc. We have reported a systematic basis set dependence of photoabsorption of boron cluster. 37 Similarly, here we have checked the dependence of photoabsorption spectrum of aluminum dimer on basis sets used, 46,47 as shown in Fig. 2. The 6-311 type Gaussian contracted basis sets are known to be good for ground state calculations. The correlation consistent (CC) basis sets, namely, CC-polarized valence double-zeta and CC-polarized valence triple zeta (cc-pVTZ) give a good description of excited states of various systems. The latter is found to be more sophisticated in describing the high energy excitations, which were also confirmed using results of an independent TDDFT calculation. 48 Therefore, in this work, we have used the cc-pVTZ basis set for the optical absorption calculations.
6
CC-PVTZ CC-PVDZ 6-311++G** 6-311++G(2d,2p) 6-311++G(3df,3pd)
Intensity (arb. units)
800
600
400
200
0
0
2
4
6
8
10
E (eV)
Figure 2. Optical absorption in Al2 calculated using various Gaussian contracted basis sets. Orbitals upto -4 Ha frozen Orbitals upto -1 Ha frozen
Intensity (arb. units)
800
600
400
200
0
0
2
4
6
8
10
E (eV)
Figure 3. The effect of freezing the core orbitals of aluminum atoms on optical absorption spectrum of Al2 . It renders little effect on optical absorption spectrum, with significant reduction in the computational cost.
3.1.2 Orbital truncation scheme
With respect to the total number of orbitals N in the system, the computational time in configuration interaction calculations scales as ≈ N6 . Therefore, such calculations become intractable for moderately sized systems, such as those considered here. So, in order to make those calculations possible, the lowest lying molecular orbitals are constrained to be doubly occupied in all the configurations, implying that no virtual excitation can occur from those orbitals. It reduces the size of the CI Hamiltonian matrix drastically. In fact, this approach is recommended in quantum chemical calculations, because the basis sets used are not optimized to incorporate the correlations in core 7
electrons. 49 The effect of this approximation on the spectrum is as shown in Fig. 3. Since, calculations with all electrons in active orbitals were unfeasible, we have frozen occupied orbitals upto -4 Hartree of energy for the purpose of demonstration. The effect of freezing the core is negligibly small in the low energy regime, but shows disagreement in the higher energy range. However, for very high energy excitations, photodissociation may occur, hence absorption spectra at those energies will cease to have meaning. Thus, the advantage of freezing the core subdues this issue. Therefore, in all the calculations presented here, we have frozen the chemical core. 1000 All virtual orbitals active Cutoff 3.0 Ha Cutoff 1.5 Ha Cutoff 1.0 Ha Cutoff 0.8 Ha
Intensity (arb. units)
800
600
400
200
0
0
2
4
6 E (eV)
8
10
12
Figure 4. The effect of the number of active orbitals (Nact ) on the optical absorption spectrum of Al2 . Until Nact =46, the optical spectrum does not exhibit any significant change. It corresponds to 1.0 Hartree (≈ 27.2 eV) virtual orbital energy. Not only occupied, but high energy virtual (unoccupied) orbitals can also be removed from the calculations to make them tractable. In this case the high lying orbitals are constrained to be unoccupied in all the configurations. This move is justifiable, because it is unlikely that electrons would prefer partial filling of high energy orbitals in an attempt to avoid other electrons. However, this will only be applicable if the orbitals are sufficiently high in energy. Fig. 4 shows the effect of removing orbitals having more than the specified energy. From the figure it is clear that photoabsorption spectra exhibits no difference at all up to 1 Hartree cutoff on virtual orbitals. Below 0.8 Ha cutoff, the spectra start deviating from each other. Hence, we have ignored the virtual orbitals having energy more than 1 Ha.
8
3.1.3 Size of the CI expansion Table 1. The average number of total configurations (Ntotal ) involved in MRSDCI calculations, ground state (GS) energies (in Hartree) at the MRSDCI level, relative energies and correlation energies (in eV) of various isomers of aluminum clusters.
445716 326696
GS energy (Ha) -483.9138882 -483.9115660
Relative energy (eV) 0.00 0.06
Correlation energyc per atom(eV) 1.69 1.87
Equilateral triangular Isosceles triangular Linear
1917948 1786700 1627016
-725.9053663 -725.8748996 -725.8370397
0.00 0.83 1.85
2.38 2.36 2.16
Al4
Rhombus Square
3460368 1940116
-967.8665897 -967.8258673
0.00 1.11
1.82 1.80
Al5
Pentagonal Pyramidal
3569914 3825182
-1209.8114803 -1209.7836568
0.00 0.76
1.73 1.77
Cluster
Isomer
Ntotal
Al2
Linear-I Linear-II
Al3
In the multi-reference CI method, the size of the Hamiltonian matrix increases exponentially with the number of molecular orbitals in the system. Also, accurate correlated results can only be obtained if sufficient number of reference configurations are included in the calculations. In our calculations, we have included those configurations which are dominant in the wave functions of excited states for a given absorption peak. Also, for ground state calculations, we included configurations until the total energy converges within a predefined tolerance. Table 1 shows the average number of total configurations involved in the CI calculations of various isomers. For a given isomer, the average is calculated across different irreducible representations needed in these symmetry adapted calculations of the ground and various excited states. For the simplest cluster, the total configurations are about half a million and for the biggest cluster considered here, it is around four million for each symmetry subspace of Al5 . The superiority of our calculations can also be judged from the correlation energy defined here (cf. Table 1), which is the difference in the total energy of a system at the MRSDCI level and the Hartree-Fock level. The correlation energy c The
difference in Hartree-Fock energy and MRSDCI correlated energy of the ground state.
9
per atom seems to be quite high for all the clusters, making our calculations stand out among other electronic structure calculations, especially single reference DFT based calculations. 3.2. Calculated photoabsorption spectra of various clusters. In this section, we describe
the photoabsorption spectra of various isomers of the aluminum clusters studied. Plots of various molecular orbitals involved are presented in the Electronic Supporting Information (ESI).† 43 3.2.1 Al2 Aluminum dimer is the most widely studied cluster of aluminum, perhaps because the nature of its ground state was a matter of debate for a long time. For example, in an early emission based experiment Ginter et al. 30 concluded that ground state of Al2 was of symmetry 3 Σ− u , while in a low-temperature absorption based experiment Douglas et al. 31 deduced that the ground state of the system was of 1 Σ− g . In other words, even the spin multiplicity of the cluster was measured to be different in different experiments. Theoreticians, on the other hand, were unanimous in predicting the spin multiplicity of the ground state to be of triplet type, however, some predicted 3 Πu to be the 53,54 Perhaps, the reason behind ground state, 17,23,50–52 while others predicted it to be of 3 Σ− g type.
this ambiguity, was that states 3 Πu and 3 Σ− g are located extremely close to each other as discovered in several theoretical calculations. 17,23,50–52 However, it has now been confirmed experimentally by Cai et al. 33 and Fu et al. 55 that the Al2 (cf. Fig. 1(a)) has 3 Πu ground state, with the 3 Σ− g state being a metastable state located slightly above it. In our calculations, the bond length obtained using geometry optimization at CCSD level was 2.72 Å, with D∞h point group symmetry. This is in very good agreement with available data, such as Martinez et al. obtained 2.73 Å as dimer length using all electron calculations, 22 2.71 Å 20 and 2.75 Å 50 as bond lengths using DFT and configuration interaction methods, and 2.86 Å obtained using DFT with generalized gradient approximation. 8 The experimental bond length of aluminum dimer is 2.70 Å. 33 We also performed the geometry optimization for the metastable state 3 Σ− g mentioned above, and found the bond length to be 2.48 Å (cf. Fig. 1(a)). Using MRCI calculations 3 50 Bauschlicher et al. estimated that 3 Σ− g electronic state lies 0.02 eV above the Πu ground state.
10
Our calculations predict this difference to be about 0.06 eV. The many-particle wave function of Al2 for the 3 Πu ground state consists of two degenerate singly occupied molecular orbitals (to be denoted by H1 and H2 , henceforth), because it is a spin triplet system. Similarly, the configurations involving excitations from occupied molecular orbitals to the unoccupied orbitals, form excited state wave functions. The computed photoabsorption spectra of Al2 , as shown in Fig. 5, is characterized by weaker absorption at lower energies and couple of intense peaks at higher energies. The many-particle wave functions of excited states contributing to the peaks are presented in Table I of supporting information. 43 The spectrum starts with a small absorption peak (Ik ) at around 2 eV, characterized by H2 → L + 1 and light polarized along the direction of axis of the dimer. It is followed by a couple of small intensity peaks (IIk , III⊥ ), until a dominant absorption (IVk ) is seen at 5 eV. This is characterized by H1 → L + 3. Another dominant peak (VIII⊥ ) is observed at 8 eV having H − 2 → L as dominant configuration, with absorption due to light polarized perpendicular to the axis of the dimer. The optical absorption spectrum of metastable dimer in the 3 Σ− g state (cf. Fig. 5) is also characterized by small absorption peaks in the lower energy range. Also, all peaks of the spectrum appear blue-shifted as compared to that of stable isomer. The peak (Ik ) at 2.29 eV is characterized by H − 1 → L, while two major peaks at 5.17 eV (Vk ) and 8.13 eV (X⊥ ) are characterized by H − 1 → L configuration due to light polarized along the direction of axis of dimer and H − 1 → L + 1 due to transversely polarized absorption respectively. Douglas et al. 31 obtained the low-energy optical absorption in the cryogenic krypton matrix. The major peaks in this experimental absorption spectrum at 1.77 eV and 3.13 eV can be associated with our results of 1.96 eV and 3.17 eV respectively. Although, our calculation overestimates the location of the first peak by about 11%, the agreement between theory and experiment is excellent for the second peak, giving us confidence about the quality our calculations. Furthermore, the computed spectrum for the metastable state 3 Σ− g of Al2 (cf. Fig. 5) has no peaks close to those observed in the experiments, implies that measured optical absorption occurs in the 3 Πu state of the system, confirming that the ground state has 3 Πu symmetry.
11
Our spectrum differs from the one obtained with the time-dependent local density approximation (TDLDA) method 28 in both the intensity and the number of peaks. However, we agree with TDLDA 28 in predicting two major peaks at 5 eV (IVk ) and 8 eV (VIII⊥ ). Unlike our calculations, the number of peaks is much more in TDLDA results and the spectrum is almost continuous. Peaks located in our calculations at 3.2 eV (IIk ) and 6.3 eV (V⊥ ) are also observed in the TDLDA spectrum of the dimer, 28 except for the fact that in our calculations both the peaks are relatively minor, while the TDLDA calculation predicts the 6.3 eV peak to be fairly intense.
Figure 5. The linear optical absorption spectra of the global minimum Al2 isomer (3 Πu state, top panel) and metastable isomer (3 Σ− g state, bottom panel), calculated using the MRSDCI approach. The peaks corresponding to the light polarized along the molecular axis are labeled with the subscript k, while those polarized perpendicular to it are denoted by the subscript ⊥. For plotting the spectrum, a uniform linewidth of 0.1 eV was used.
12
3.2.2 Al3 Among the possible isomers of aluminum cluster Al3 , the equilateral triangular isomer is found to be the most stable. We have considered three isomers of Al3 , namely, equilateral triangle, isosceles triangle, and a linear chain. The most stable isomer has D3h point group symmetry, ′
and 2 A1 electronic state. The optimized bond length 2.57 Å, is in good agreement with reported theoretical values 2.61 Å, 8 2.62 Å, 9 2.56 Å, 22 2.54 Å 56 and 2.52 Å. 13,14 The doublet ground state is also confirmed with the results of magnetic deflection experiments. 16 The next isomer, which lies 0.83 eV higher in energy, is the isosceles triangular isomer. The optimized geometry has 2.59 Å, 2.59 Å and 2.99 Å as sides of triangle, with a quartet ground state (4 A2 ). Our results are in agreement with other theoretical results. 9,19,22 Linear Al3 isomer again with quartet multiplicity is the next low-lying isomer. The optimized bond length is 2.62 Å. This is in good agreement with few available reports. 13,19,22 Li et al. reported infrared optical absoption in Al3 in inert-gas matrices at low temperature. 36 Another experimental study of optical absorption in isosceles triangular isomer was performed by Fu et al. using jet cooled aluminum clusters. 32,35 The photoabsorption spectra of these isomers are presented in Fig. 6. The corresponding many body wave functions of excited states corresponding to various peaks are presented in Table III, IV and V of supporting information. 43 In the equilateral triangular isomer, most of the intensity is concentrated at higher energies. The same is true for the isosceles triangular isomer. However, the spectrum of isosceles triangular isomer appears slightly red shifted with respect to the equilateral counterpart. Along with this shift, there appears a split pair of peaks at 5.8 eV (VI and VII). This splitting of oscillator strengths is due to distortion accompanied by symmetry breaking. The absorption spectrum of linear isomer is altogether different with bulk of the oscillator strength carried by peaks in the range 4 – 5 eV, and, due to the polarization of light absorbed parallel to the axis of the trimer.
13
Figure 6. The linear optical absorption spectra of Al3 equilateral triangle isomer, isosceles isomer, and linear isomer calculated using the MRSDCI approach. The peaks corresponding to the light polarized along the molecular plane are labeled with the subscript k, while those polarized perpendicular to it are denoted by the subscript ⊥. All peaks in the spectrum of isosceles isomer correspond to the light polarized along the molecular plane. Rest of the information is same as given in the caption of Fig. 5
14
The optical absorption spectrum of equilateral triangular isomer consists of very feeble low energy peaks at 3.5 eV (Ik ), 5.6 eV (IIk ) and 5.8 eV (III⊥ ) characterized by H − 3 → L + 5, a double excitation H − 2 → L + 5; H − 1 → L + 5, and H − 3 → L + 2 respectively. The latter peak is due to the light polarized perpendicular to the plane of the isomer. It is followed by an intense peak (IVk ) at around 6.5 eV with dominant contribution from H → L + 6 and H → L + 4 configurations. A semi-major peak (VIk ) is observed at 7.5 eV characterized mainly due to double excitations. Two major peaks at 6.5 eV (IVk ) and 7.5 eV (VIk ) in the spectrum of Al3 equilateral isomer, obtained in our calculations are also found in the spectrum of TDLDA calculations, with the difference that the latter does not have a smaller intensity in TDLDA. 28 Other major peaks obtained by Deshpande et al. 28 in the spectrum of aluminum trimer are not observed, or have very small intensity in our results. As compared to the equilateral triangle spectra, the isosceles triangular isomer with quartet spin multiplicity, exhibits several small intensity peaks (cf. Fig. 6) in the low energy regime. The majority of contribution to peaks of this spectrum comes from in-plane polarized transitions, with negligible contribution from transverse polarized light. The spectrum starts with a feeble peak (Ik ) at 2.4 eV with contribution from doubly-excited configuration H → L + 1; H − 2 → L + 2. Although, no experimental absorption data is available for the doublet equilateral triangle isomer, Fu et al. 32,35 managed to measure the absorption of the isosceles triangle isomer, and observed this peak to be around 2.5 eV. Thus, this excellent agreement between the experiment and our theoretical calculations for isosceles triangle isomer with quartet spin multiplicity, further strengthens our belief in the quality of our calculations. One of the dominant contribution to the oscillator strength comes from two closely-lying peaks (VIk and VIIk ) at 5.8 eV. The wave functions of excited states corresponding to this peak show a strong mixing of doubly-excited configurations, such as H − 3 → L + 1; H − 2 → L and H − 2 → L + 1; H − 4 → L. The peak (VIIIk ) at 6.7 eV shows absorption mainly due to H → L + 10. Linear trimer of aluminum cluster also shows low activity in the low energy range. Very feeble
15
peaks are observed at 1.2 eV (Ik ) and 2.3 eV (IIk ), both characterized by H − 3 → H − 2. This configuration also contributes to the semi-major peak (IIIk ) at 4 eV along with H − 4 → H. Two closely lying peaks at 4.3 eV (IVk,⊥ ) and 4.6 eV (Vk ) carry the bulk of the oscillator strength. Major contribution to the former comes from H − 1 → L + 2 along with H − 3 → H − 2 being dominant in both the peaks. Again, as expected, the absorption due to light polarized along the trimer contributes substantially to the spectrum. It is obvious from the spectra presented above that the location of the most intense absorption is quite sensitive to the structure, and thus can be used to distinguish between the three isomers. 3.2.3 Al4
Figure 7. The linear optical absorption spectra of rhombus and square isomers of Al4 , calculated using the MRSDCI approach. Rest of the information is same as given in the caption of Fig. 6. Tetramer of aluminum cluster has many low lying isomers due to its flat potential energy curves. Among them, rhombus structure is the most stable with 3 B2g electronic ground state. Our opti16
mized bond length for rhombus structure is 2.50 Å and 63.8◦ as the acute angle. This is to be compared with corresponding reported values of 2.56 Å and 69.3◦ reported by Martinez et al., 22 2.51 Å and 56.5◦ computed by Jones, 20 2.55 Å and 67.6◦ obtained by Schultz et al. 14 We note that bond lengths are in good agreement but bond angles appear to vary a bit. The other isomer studied here is a square shaped tetramer with optimized bond length of 2.69 Å. The electronic ground state of this D4h symmetric cluster is 3 B3u . This optimized geometry is in accord with 2.69 Å reported by Martinez et al., 22 however, it is somewhat bigger than 2.57 Å calculated by Yang et al. 13 and 2.61 Å obtained by Jones. 19 For planar clusters, like rhombus and square shaped Al4 , two types of optical absorptions are possible: (a) planar – those polarized in the plane of the cluster, and (b) transverse – the ones polarized perpendicular to that plane. The many-particle wave functions of excited states contributing to the peaks are presented in Table VI and VII of supporting information. 43 The onset of optical absorption in rhombus isomer occurs at around 1 eV (I⊥ ) with transversely polarized absorption characterized by H1 → L + 1. It is followed by an in-plane polarized absorption peak (IIk ) at 2.3 eV with dominant contribution from H − 2 → H1. Several closely lying peaks are observed in a small energy range of 4.5 – 8 eV. Peaks split from each other are seen in this range confirming that after shell closure, in perturbed droplet model, Jahn Teller distortion causes symmetry breaking usually associated with split absorption peaks. The most intense peak (Vk ) is observed at 5.5 eV characterized by H − 3 → L + 4. The absorption spectrum of square shaped isomer begins with a couple of low in-plane polarized absorption peaks at 2.1 eV (Ik ) and 2.7 eV (IIk ) characterized by H − 1 → L and H2 → L + 1 respectively. The peak at 4.2 (IIIk ) and 4.9 eV (IVk ) have H − 2 → L and H1 → L + 2 as respective dominant configurations. A major peak (VIk ) at 5.85 eV is observed with absorption due to in-plane polarization having H − 2 → L + 2 and a double excitation H1 → L + 2; H − 2 → L + 2 as dominant configurations. These configurations also make dominant contribution to the peak (VIIk,⊥ ) at 6.5 eV. This peak along with one at 6.9 eV (VIIIk,⊥ ) are two equally and most intense peaks of the spectrum. The latter has additional contribution from the double excitation
17
H1 → L + 1; H − 2 → L. A shoulder peak (IXk ) is observed at 7.2 eV. The TDLDA spectrum 28 of aluminum rhombus tetramer differs from the one presented here. Peaks labeled III to XII in our calculated spectrum are also observed in the TDLDA results, 28 however, the relative intensities tend to disagree. For example, the strongest absorption peak of TDLDA calculations is located around 7.9 eV, while in our spectrum we obtain the second most intense peak at that location. The highest absorption peak (Vk ) in our calculations is at 5.5 eV, while TDLDA does report a strong peak at the same energy, 28 it is not the highest of the spectrum. Our calculations also reveal a strong structure-property relationship as far as the location of the most intense peak in the absorption spectra of the two isomers is considered, a feature which can be utilized in their optical detection. 3.2.4 Al5 The lowest lying pentagonal isomer of aluminum has C2v symmetry and has an electronic ground state of 2 A1 . The bond lengths are as shown in Fig. 1(h). These are slightly bigger than those obtained by Rao and Jena 8 and Yang et al. 13 using the DFT approach. Many other reports have confirmed that the planar pentagon is the most stable isomer of Al5 . The other optimized structure of pentamer is perfect pyramid with C4v symmetry and 2 A1 electronic ground state. This lies 0.76 eV above the global minimum structure. This is the only three dimensional structure studied in this paper for optical absorption. The optimized geometry is consistent with those reported earlier by Jones. 19 However, it should be noted that there exists many more similar or slightly distorted structure lying equally close the the global minimum. The many-particle wave functions of excited states contributing to the peaks are presented in Table VIII and IX of supporting information. 43 The optical absorption spectrum of pentagonal Al5 (Fig. 8) has few low energy peaks followed by major absorption (Vk ) at 4.4 eV. It has dominant contribution from H − 1 → L + 5 configuration. Pentagonal isomer shows more optical absorption in the high energy range, with peaks within regular intervals of energy. Few feeble peaks occur in the low energy range in the optical absorption of pyramidal isomer.
18
Figure 8. The linear optical absorption spectra of pentagonal and pyramidal Al5 , calculated using the MRSDCI approach. The peaks in the spectrum of pyramidal isomer corresponding to the light polarized along the Cartesian axes are labeled accordingly. Cartesian xy plane is assumed parallel to the base of the pyramid. Rest of the information is same as given in the caption of Fig. 6. The major absorption peak (Vx,y ) at 4.2 eV is slightly red-shifted as compared to the pentagonal counterpart. It is characterized by H − 3 → L + 2. A peak (Xx ) at 6 eV is seen in this absorption spectrum having dominant contribution from H → L + 13, which is missing in the spectrum of pentagon. These differences can lead to identification of isomers produced experimentally. In the range of spectrum studied in our calculations, the TDLDA calculated spectrum 28 of pentagonal isomer is found to be similar to the one presented here as far as the peak locations are concerned, albeit the intensity profile differs at places. A small peak at 2.4 eV (IIk ) is observed in both the spectra, followed by peaks at 3.9 eV (IIIk,⊥ ), 4.2 eV (IVk ) and 4.4 eV (Vk ). These three peaks are also observed in TDLDA results with a little bit of broadening. Again, the peak at 5.4 eV (VII⊥ ) matches with each other calculated from both the approaches. Peak found at 6.7
19
eV (IX⊥ ) is also observed in the TDLDA calculation. 28 Within the energy range studied here, the strongest peak position and intensity of this work is in good agreement with that of its TDLDA counterpart. 28
4. Conclusions and Outlook
In this study, we have presented large-scale all-electron correlated calculations of optical absorption spectra of several low-lying isomers of aluminum clusters Aln (n=2–5), involving valence transitions. The present study does not take into account Rydberg transitions, which are more of atomic properties, than molecular ones. Both ground and excited state calculations were performed at MRSDCI level, which take electron correlations into account at a sophisticated level. We have analyzed the nature of low-lying excited states. We see strong configuration mixing in various excited states indicating plasmonic nature of excitations as per the criterion suggested by Blanc et al. 57 Isomers of a given cluster show a distinct signature spectrum, indicating a strong structureproperty relationship, which is usually found in small metal clusters. Such structure-property relationship exists for photoelectron spectroscopy as well, therefore, the optical absorption spectroscopy can be used as an alternative probe of the structures of clusters, and can be employed in experiments to distinguish between different isomers of a cluster. The optical absorption spectra of few isomers of aluminum dimer and trimer are in very good agreement with the available experimental results. Owing to the sophistication of our calculations, our results can be used for benchmarking of the absorption spectra. Furthermore, our calculations demonstrate that the MRSDCI approach, within a first-principles formalism, can be used to perform sophisticated calculations of not just the ground state, but also of the excited states of metal clusters, in a numerically efficient manner. Moreover, by using more diffuse basis functions, one can also compute the Rydberg transitions, in case their description is warranted. Our results were found to be significantly different as compared to the TDLDA results, 28 for the clusters studied here. This disagreement could be resolved by future optical absorption experi20
ments performed on these clusters.
Acknowledgments
One of us (R.S.) would like to acknowledge the Council of Scientific and Industrial Research (CSIR), India, for research fellowship (09/087/(0600)2010-EMR-I). We also acknowledge CDAC, Pune for providing computational facility Param Yuva -II. .
References
(1) Alonso, J. A. Structure and Properties of Atomic Nanostructures; Imperial College Press: London, 2005. (2) Yoshiyuki Kawazoe, T. K.; Ohno, K. Clusters and Nanomaterials; Springer-Verlag: Berlin, 2002. (3) Jellinek, J. Theory of Atomic and Molecular Clusters – With a Glimpse at Experiments; Springer-Verlag: Berlin, 1999. (4) de Heer, W. A. Rev. Mod. Phys. 1993, 65, 611–676. (5) Bowlan, J.; Liang, A.; de Heer, W. A. Phys. Rev. Lett. 2011, 106, 043401. (6) de Heer, W. A.; Milani, P.; Chtelain, A. Phys. Rev. Lett. 1989, 63, 2834–2836. (7) Li, X.; Wu, H.; Wang, X.-B.; Wang, L.-S. Phys. Rev. Lett. 1998, 81, 1909–1912. (8) Rao, B. K.; Jena, P. J. Chem. Phys. 1999, 111, 1890–1904. (9) Upton, T. H. J. Chem. Phys. 1987, 86, 7054–7064. (10) Clemenger, K. Phys. Rev. B 1985, 32, 1359–1362. (11) Ganteför, G.; Eberhardt, W. Chem. Phys. Lett. 1994, 217, 600–604. (12) Ahlrichs, R.; D. Elliott, S. Phys. Chem. Chem. Phys. 1999, 1, 13–21. 21
(13) Yang, S. H.; Drabold, D. A.; Adams, J. B.; Sachdev, A. Phys. Rev. B 1993, 47, 1567–1576. (14) Schultz, N. E.; Staszewska, G.; Staszewski, P.; Truhlar, D. G. J. Phys. Chem. B 2004, 108, 4850–4861. (15) Cheng, H.-P.; Berry, R. S.; Whetten, R. L. Phys. Rev. B 1991, 43, 10647–10653. (16) Cox, D. M.; Trevor, D. J.; Whetten, R. L.; Rohlfing, E. A.; Kaldor, A. J. Chem. Phys. 1986, 84, 4651–4656. (17) Tse, J. S. J. Mol. Struct. (Theochem) 1988, 165, 21 – 35. (18) Tse, J. S. J. Chem. Phys. 1990, 92, 2488–2494. (19) Jones, R. O. J. Chem. Phys. 1993, 99, 1194–1206. (20) Jones, R. O. Phys. Rev. Lett. 1991, 67, 224–227. (21) Akola, J.; Häkkinen, H.; Manninen, M. Phys. Rev. B 1998, 58, 3601–3604. (22) Martinez, A.; Vela, A.; Salahub, D. R.; Calaminici, P.; Russo, N. J. Chem. Phys. 1994, 101, 10677–10685. (23) Fois, E.; Gamba, A.; Sironi, M. J. Mol. Struct. (Thochem) 1992, 261, 277 – 285. (24) Miller, S. R.; Schultz, N. E.; Truhlar, D. G.; Leopold, D. G. J. Chem. Phys. 2009, 130, 024304–1–024304–23. (25) Drebov, N.; Ahlrichs, R. J. Chem. Phys. 2010, 132, 164703. (26) Alipour, M.; Mohajeri, A. J. Phys. Chem. A 2010, 114, 12709–12715. (27) (a) Yannouleas, C.; Broglia, R. A.; Brack, M.; Bortignon, P. F. Phys. Rev. Lett. 1989, 63, 255–258; (b) Wang, C. R. C.; Pollack, S.; Cameron, D.; Kappes, M. M. J. Chem. Phys. 1990, 93, 3787–3801; (c) Selby, K.; Kresin, V.; Masui, J.; Vollmer, M.; de Heer, W. A.; Scheidemann, A.; Knight, W. D. Phys. Rev. B 1991, 43, 4565–4572; (d) Yannouleas, C.; 22
Broglia, R. A. Phys. Rev. A 1991, 44, 5793–5802; (e) Yannouleas, C.; Vigezzi, E.; Broglia, R. A. Phys. Rev. B 1993, 47, 9849–9861; (f) Pacheco, J. M.; Martins, J. L. J. Chem. Phys. 1997, 106, 6039–6044; (g) Yannouleas, C. Phys. Rev. B 1998, 58, 6748–6751; (h) Pal, G.; Pavlyukh, Y.; Hübner, W.; Schneider, H. C. Eur. Phys. J. B 2011, 79, 327–334. (28) Deshpande, M. D.; Kanhere, D. G.; Vasiliev, I.; Martin, R. M. Phys. Rev. B 2003, 68, 035428. (29) Xie, R.-H.; Bryant, G. W.; Zhao, J.; Kar, T.; Smith, V. H. Phys. Rev. B 2005, 71, 125422. (30) Ginter, D. S.; Ginter, M. L.; Innes, K. K. Astrophys. J. 1964, 139, 365. (31) Douglas, M. A.; Hauge, R. H.; Margrave, J. L. J. Phys. Chem. 1983, 87, 2945–2947. (32) Fu, Z.; Lemire, G. W.; Hamrick, Y. M.; Taylor, S.; Shui, J.; Morse, M. D. J. Chem. Phys. 1988, 88, 3524–3531. (33) Cai, M.; Dzugan, T.; Bondybey, V. Chem. Phys. Lett. 1989, 155, 430 – 436. (34) Villalta, P. W.; Leopold, D. G. J. Chem. Phys. 2009, 130, 024303–1–024303–19. (35) Fu, Z.; Russon, L. M.; Morse, M. D.; Armentrout, P. Int. J. Mass Spectrom. 2001, 204, 143 – 157. (36) Li, S.; Zee, R. V.; Weltner(Jr.), W. Chem. Phys. Lett. 1996, 262, 298 – 302. (37) Shinde, R.; Shukla, A. Nano LIFE 2012, 2, 1240004–1240024. (38) Sony, P.; Shukla, A. J. Chem. Phys. 2009, 131, 014302. (39) Shukla, A. Phys. Rev. B 2002, 65, 125204. (40) Sony, P.; Shukla, A. Phys. Rev. B 2005, 71, 165204. (41) Sony, P.; Shukla, A. Phys. Rev. B 2007, 75, 155208. (42) Sahu, S.; Shukla, A. Nanoscale Res. Lett. 2010, 5, 714–719. 23
(43) See ESI† for molecular orbital plots, and wave function analysis presented in Tables I through IX. (44) Frisch, M. J. et al. Gaussian 09 Revision A.02. Gaussian Inc. Wallingford CT 2009. (45) McMurchie, L. E.; Elbert, S. T.; Langhoff, S. R.; Davidson, E. R. MELD package from Indiana University. It has been modified by us to handle bigger systems. (46) Schuchardt, K. L.; Didier, B. T.; Elsethagen, T.; Sun, L.; Gurumoorthi, V.; Chase, J.; Li, J.; Windus, T. L. J. Chem. Inf. Model. 2007, 47, 1045–1052. (47) Feller, D. J. Comput. Chem. 1996, 17, 1571–1586. (48) Lehtonen, O.; Sundholm, D.; Send, R.; Johansson, M. P. J. Chem. Phys. 2009, 131, 024301. (49) Szabo, A.; Ostlund, N. Modern Quantum Chemistry : Introduction to Advanced Electronic Structure Theory; Dover Publications: New York, 1996. (50) Charles W. Bauschlicher, J.; Partridge, H.; Langhoff, S. R.; Taylor, P. R.; Walch, S. P. J. Chem. Phys. 1987, 86, 7007–7012. (51) Basch, H.; Stevens, W.; Krauss, M. Chem. Phys. Lett. 1984, 109, 212 – 216. (52) Sunil, K. K.; Jordan, K. D. J. Phys. Chem. 1988, 92, 2774–2781. (53) Leleyter, M.; Joyes, P. J. Phys. B: At. Mol. Phys. 1980, 13, 2165. (54) Upton, T. H. J. Phys. Chem. 1986, 90, 754–759. (55) Fu, Z.; Lemire, G. W.; Bishea, G. A.; Morse, M. D. J. Chem. Phys. 1990, 93, 8420–8441. (56) Baeck, K. K.; Bartlett, R. J. J. Chem. Phys. 1998, 109, 1334–1342. (57) Blanc, J.; Koutecký, V. B.; Broyer, M.; Chevaleyre, J.; Dugourd, P.; Koutecký, J.; Scheuch, C.; Wolf, J. P.; Wöste, L. J. Chem. Phys. 1992, 96, 1793–1809.
24
Supplementary material for Large-scale first principles configuration interaction calculations of optical absorption in aluminum clusters In this document, we present the plots of the most important molecular orbitals of the isomers of aluminum clusters considered in this work, and depicted in Fig. 1 of the paper. Furthermore, we also present their ground and excited state CI wave functions, energies, and oscillator strengths corresponding to various peaks in their photo-absorption spectra discussed in section III of the paper.
5. Molecular Orbitals of Aluminum Clusters
Figure 9. Molecular orbitals of aluminum dimer. H and L stands for HOMO and LUMO respectively, and H1 and H2 are singly occupied degenerate molecular orbitals. 25
Figure 10. Molecular orbitals of equilateral triangular aluminum trimer. H and L stands for HOMO and LUMO respectively. (H − 2, H − 3), (L, L + 1) and (L + 2, L + 3) are degenerate pairs.
Figure 11. Molecular orbitals of isosceles triangular aluminum trimer. H and L stands for HOMO and LUMO respectively, and H1 , H2 , and H3 are singly occupied molecular orbitals.
Figure 12. Molecular orbitals of linear aluminum trimer. H and L stands for HOMO and LUMO respectively, and H1, H2 , and H3 are singly occupied molecular orbitals.
Figure 13. Molecular orbitals of rhombus-shaped aluminum tetramer. H and L stands for HOMO and LUMO respectively, and H1 and H2 are singly occupied molecular orbitals. 26
Figure 14. Molecular orbitals of square-shaped aluminum tetramer. H and L stands for HOMO and LUMO respectively, and H1 and H2 are singly occupied molecular orbitals.
Figure 15. Molecular orbitals of pentagonal aluminum pentamer. H and L stands for HOMO and LUMO respectively.
Figure 16. Molecular orbitals of pyramidal aluminum pentamer. H and L stands for HOMO and LUMO respectively.
27
Table 2. Excitation energies (E) and many-particle wave functions of excited states corresponding to the peaks in the linear absorption spectrum of Al2 , along with the oscillator strength ( f12 ) of the transitions. Longitudinal and transverse polarization corresponds to the absorption due to light polarized along and perpendicular to the molecular axis respectively. In the wave function, the bracketed numbers are the CI coefficients of a given electronic configuration. Symbols H1 ,H2 denote SOMOs discussed earlier, and H, and L, denote HOMO and LUMO orbitals respectively. HF denotes the Hartree-Fock configuration. Peak GS1
E (eV)
I
1.96
3B
3g
II
3.17
3B
3g
III
4.47
3A
IV
4.99
3B
V
6.31
3A
g
0.2554
transverse
|H2 → L + 6i(0.4683) |H − 1 → L + 1i(0.3894) |H − 1 → L; H2 → L + 2i(0.3886)
VI
7.17
3A
g
0.1549
transverse
|H2 → L + 2; H − 1 → Li(0.4782) |H − 1 → L + 1i(0.4327) |H1 → L; H2 → L + 8i(0.3867)
VII
7.79
3A
g
1.2530
transverse
|H − 1 → H1 ; H2 → L + 3i(0.4833) |H1 → L + 7i(0.3917) |H1 → L; H2 → L + 8i(0.3791)
VIII
8.05
3B
1g
3.5391
transverse
8.10
3A
g
1.1418
transverse
|H − 2 → Li(0.5316) |H − 1 → L + 2i(0.3756) |H1 → L + 8i(0.3531) |H − 1 → H1 ; H2 → L + 3i(0.4788) |H2 → L + 6i(0.4095)
8.87
3B
1g
0.7044
transverse
8.95
3A
0.6872
transverse 28
IX
Symmetry 3B 2u
g
3g
g
f12
Polarization Wave Function |H11 , H21 i (0.9096) |H − 1 → H1 ; H2 → Li(0.1139) |H − 2 → L; H − 1 → L + 2i(0.0889)
0.1027 longitudinal |H2 → L + 1i(0.8120) |H − 1 → H1 i(0.3685) 0.1249 longitudinal |H − 1 → H1 i(0.6172) |H1 → L + 3i(0.4068) |H1 → L; H − 1 → Li(0.3190) 0.5149
transverse
|H2 → L + 4i(0.8313) |H2 → L + 6i(0.2024)
5.4531 longitudinal |H1 → L + 3i(0.7353) |H − 1 → H1 i(0.4104)
|H1 → L + 11i(0.5061) |H1 → L; H2 → L + 7i(0.4162) |H1 → L + 7i(0.4932) |H2 → L; H1 → L + 8i(0.4414) |H1 → L + 4; H − 1 → L + 1i(0.3262)
Table 3. Excitation energies (E) and many-particle wave functions of excited states corresponding to the peaks in the linear absorption spectrum of metastable Al2 , along with the oscillator strength ( f12 ) of the transitions. Longitudinal and transverse polarization corresponds to the absorption due to light polarized along and perpendicular to the molecular axis respectively. In the wave function, the bracketed numbers are the CI coefficients of a given electronic configuration. Symbols H1 ,H2 denote SOMOs discussed earlier, and H, and L, denote HOMO and LUMO orbitals respectively. HF denotes the Hartree-Fock configuration. Peak GS2
E (eV)
Symmetry 3B 3g
I
2.29
3A
u
II
3.26
3A
u
III
4.40
3B
2u,3u
0.0469
transverse
|H − 1 → L + 1i(0.5540) |H2 → L + 1; H − 1 → H1 i(0.4827)
IV
4.67
3B
2u,3u
0.1769
transverse
|H1 → L + 3i(0.5073) |H − 1 → L + 1i(0.5030)
V
5.17
VI
5.75
3B
2u,3u
0.1549
transverse
|H − 1 → H2 i(0.5354) |H − 1 → L + 1i(0.4847)
VII
6.24
3B
2u,3u
0.2361
transverse
|H − 1 → L + 1i(0.5856) |H − 1 → L; H − 1 → H1 i(0.3432)
VIII
6.79
3B
2u,3u
0.0659
transverse
|H1 → L; H2 → L + 5i(0.4766) |H1 → L; H − 1 → L + 2i(0.4333)
IX
7.73
X
8.13
3B
2u,3u
3.6959
transverse
|H − 1 → L + 1i(0.4767) |H2 → L + 4i(0.4052)
XI
8.49
3B
2u,3u
1.1382
transverse
|H1 → L; H − 1 → L + 2i(0.4727) |H − 2 → H1 i(0.3364)
3A
3A
u
u
f12
Polarization Wave Function |H11 , H21 i (0.8975) |H − 1 → L; H − 1 → Li(0.1418) |H − 1 → L; H1 → L + 1i(0.1146)
0.0283 longitudinal |H − 1 → Li(0.6598) |H1 → L + 1i(0.4276) |H2 → L + 1i(0.4276) 0.0350 longitudinal |H − 1 → Li(0.7659) |H1 → Li(0.3137)
5.8490 longitudinal |H − 1 → Li(0.7286) |H1 → L + 1i(0.3078)
0.5428 longitudinal |H − 1 → L + 3i(0.6484) |H1 → L + 1; H − 1 → Li(0.2333)
29
Table 4. Excitation energies (E) and many-particle wave functions of excited states corresponding to the peaks in the linear absorption spectrum of Al3 equilateral triangle isomer, along with the oscillator strength ( f12 ) of the transitions. In-plane and transverse polarization corresponds to the absorption due to light polarized in and perpendicular to the plane of the triangular isomer respectively. In the wave function, the bracketed numbers are the CI coefficients of a given electronic configuration. Symbols H and L, denote HOMO (singly occupied, in this case) and LUMO orbitals respectively. HF denotes the Hartree-Fock configuration. Peak GS3
E (eV)
Symmetry 2A 1
f12
Polarization
Wave Function |HFi (0.8373) |H − 2 → L + 5i(0.1329)
I
3.42
2B
2
0.0376
in-plane
3.54
2A
1
0.1080
in-plane
|H − 3 → L + 5i(0.2908) |H − 2 → L + 1i(0.2439) |H − 2 → L + 5i(0.3686) |H − 2 → Hi(0.3403)
II
5.61
2A
1
0.2565
in-plane
III
5.87
2B
1
0.3413
transverse
|H − 3 → L + 2i(0.2915) |H − 2 → Li(0.2842)
IV
6.53
2A
1
6.3289
in-plane
6.53
2B
2
5.7925
in-plane
|H → L + 6i(0.4044) |H − 3 → L + 1i(0.3965) |H − 2 → L + 5i(0.3158) |H → L + 4i(0.3842) |H − 3 → L + 5i(0.2834) |H − 4 → L + 1i(0.2256)
V
6.96
2B
1
0.4145
transverse
VI
7.50
2B
2
0.9430
in-plane
7.57
2A
1
0.8630
in-plane
30
|H − 2 → L + 5; H − 1 → L + 5i(0.4854) |H → L + 1; H − 1 → L + 1i(0.4476)
|H − 2 → Li(0.3140) |H − 3 → L + 2i(0.2626) |H − 2 → L + 1; H → L + 5i(0.3136) |H − 3 → L + 5i(0.2864) |H → L + 5; H − 3 → L + 1i(0.3838) |H − 3 → L + 1i(0.2651) |H − 2 → L + 5i(0.2590)
Table 5. Excitation energies (E) and many-particle wave functions of excited states corresponding to the peaks in the linear absorption spectrum of Al3 isosceles triangle isomer, along with the oscillator strength ( f12 ) of the transitions. In-plane and transverse polarization corresponds to the absorption due to light polarized in and perpendicular to the plane of the triangular isomer respectively. In the wave function, the bracketed numbers are the CI coefficients of a given electronic configuration. Symbols H1 , H2 and H3 denote SOMOs discussed earlier, H and L, denote HOMO and LUMO orbitals respectively. Peak GS4
E (eV)
Symmetry 4A 1
f12
I
2.37
4A
2
0.0358
in-plane
|H1 → L + 1; H3 → L + 2i(0.7066) |H − 1 → L + 1; H1 → Li(0.4052)
II
3.06
4B
1
0.0992
in-plane
|H3 → H2 ; H − 2 → Li(0.4691) |H − 1 → L + 1; H3 → H2i(0.4070)
III
3.45
4A
2
0.0967
in-plane
|H1 → L + 3i(0.5566) |H − 1 → L + 1; H1 → Li(0.5209)
IV
4.11
4B
1
0.3208
in-plane
|H1 → L + 4i(0.6038) |H3 → L + 1; H − 2 → Li(0.5272)
V
4.83
4A
2
0.2242
in-plane
|H1 → L + 1; H − 2 → L + 1i(0.5321) |H1 → L + 5i(0.2611)
VI
5.76
4A
2
5.0792
in-plane
5.85
4B
1
0.8553
in-plane
|H − 1 → L + 1; H3 → Li(0.3479) |H − 3 → L + 1; H1 → Li(0.2875) |H2 → L + 1; H1 → L + 3i(0.2800) |H3 → L + 1; H − 2 → Li(0.4081) |H − 1 → L; H3 → Li(0.2400)
5.95
4A
2
1.7094
in-plane
6.15
4B
1
0.7827
in-plane
6.68
4B
1
1.7774
in-plane
VII
VIII
Polarization Wave Function |H11 , H21 , H31 i (0.8670) |H − 1 → L + 10i(0.1213)
31
|H − 1 → L + 2i(0.3296) |H − 1 → L + 1; H3 → Li(0.3138) |H1 → L + 7i(0.7827) |H1 → L + 10i(0.4548) |H2 → L + 1; H1 → L + 6i(0.2705) |H1 → L + 6i(0.2447)
Table 6. Excitation energies (E) and many-particle wave functions of excited states corresponding to the peaks in the linear absorption spectrum of Al3 linear isomer, along with the oscillator strength ( f12 ) of the transitions. Longitudinal and transverse polarization corresponds to the absorption due to light polarized along and perpendicular to the axis of the linear isomer respectively. In the wave function, the bracketed numbers are the CI coefficients of a given electronic configuration. Symbols H1 , H2 and H3 denote SOMOs discussed earlier, H and L, denote HOMO and LUMO orbitals respectively. HF denotes the Hartree-Fock configuration. Peak GS5
E (eV)
I
1.24
4B
3g
II
2.25
4B
3g
III
4.01
4B
3g
IV
4.43
4B
3g
4.47
Symmetry 4A u
4B
1g,2g
4B
V
4.62
VI
5.29
VII
5.83
4B
3g
VIII
6.31
4B
3g
6.37
IX
6.89
4B
4B
3g
1g,2g
1g,2g
4B
3g
f12
Polarization Wave Function |H11 , H21 , H31 i (0.8010) |H − 3 → H1 ; H3 → Li(0.1913)
0.0317 longitudinal |H2 → L + 1i(0.6602) |H − 1 → H3 i(0.3636) 0.0489 longitudinal |H − 1 → H3 i(0.6856) |H − 2 → H1 i(0.3230) 0.9019 longitudinal |H − 2 → H1 i(0.5249) |H − 1 → H3 i(0.3471) 2.8593 longitudinal |H − 1 → H3 i(0.4070) |H − 1 → L + 4; H2 → L + 6i(0.2409) 0.0960 transverse |H2 → L + 2i(0.5402) |H − 1 → H3 ; H2 → L + 6i(0.3068) 5.1747 longitudinal |H − 1 → H3 i(0.4600) |H − 1 → L + 4; H2 → L + 6i(0.2862) 0.1070
transverse
|H2 → L + 5i(0.4951) |H − 1 → H3 ; H − 1 → L + 1i(0.3284) |H − 1 → L + 3i(0.3091)
0.1412 longitudinal |H − 1 → L + 2; H1 → Li(0.6637) |H − 2 → H1 i(0.2225) |H − 1 → H3 i(0.2073) 0.0459 longitudinal |H1 → L + 6; H3 → Li(0.5099) |H1 → L; H3 → L + 6i(0.2706) 0.0740 transverse |H − 1 → L + 3i(0.3989) |H − 1 → H2 ; H3 → L + 6i(0.2266) 0.1311 longitudinal |H − 5 → L + 6i(0.3920) |H1 → L + 4; H3 → L + 6i(0.3086) 32
Table 7. Excitation energies (E) and many-particle wave functions of excited states corresponding to the peaks in the linear absorption spectrum of Al4 rhombus isomer, along with the oscillator strength ( f12 ) of the transitions. In-plane and transverse polarization corresponds to the absorption due to light polarized in and perpendicular to the plane of the rhombus isomer respectively. In the wave function, the bracketed numbers are the CI coefficients of a given electronic configuration. Symbols H1 ,H2 denote SOMOs discussed earlier, and H, and L, denote HOMO and LUMO orbitals respectively. Peak GS6
E (eV)
Symmetry 3B 2g
f12
Polarization Wave Function |H11 , H21 i (0.8724) |H − 3 → L; H − 3 → Li(0.1050)
I
1.07
3B
1u
0.0247
transverse
II
2.31
3B
3u
0.3087
in-plane
|H − 2 → H1 i(0.7645) |H2 → L + 1i(0.3113)
III
4.67
3B
3u
0.5709
in-plane
|H − 2 → L; H − 1 → L + 3i(0.6036) |H − 1 → L + 3i(0.4213) |H1 → L + 7i(0.3113)
IV
4.88
3A
u
0.9622
in-plane
|H − 1 → L; H − 1 → L + 3i(0.6036) |H − 3 → Li(0.4699)
V
5.51
3B
3u
3.8316
in-plane
|H − 3 → L + 4i(0.7378) |H − 2 → H1 i(0.2161)
VI
5.84
3A
u
0.4900
in-plane
|H − 2 → L + 3i(0.3889) |H − 2 → L; H − 3 → Li(0.3758) |H − 3 → Li(0.3594) |H − 1 → L; H − 1 → L + 3i(0.3591)
VII
6.01
3B
1u
0.5332
transverse
VIII
6.20
3A
u
0.7477
in-plane
IX
6.51
3B
1u
0.2928
transverse
|H − 3 → L + 2i(0.7001) |H − 2 → H1 ; H − 1 → L + 2i(0.2232) |H − 2 → L; H − 3 → L + 2i(0.2070)
X
6.92
3B
1u
0.6053
transverse
|H − 3 → L + 2i(0.5144) |H − 2 → L; H − 3 → L + 2i(0.3549) |H − 2 → L + 5i(0.2676)
XI
7.31
3B
1u
0.4328
33 transverse
|H1 → L + 1i(0.8489) |H − 2 → L + 5i(0.1601)
|H2 → L + 7i(0.7268) |H − 3 → L + 2i(0.3050) |H − 2 → L + 3i(0.5195) |H − 2 → L; H − 3 → Li(0.4189)
|H − 2 → L + 5i(0.4033) |H − 3 → L; H − 1 → L + 1i(0.3787)
Table 8. Excitation energies (E) and many-particle wave functions of excited states corresponding to the peaks in the linear absorption spectrum of Al4 square isomer, along with the oscillator strength ( f12 ) of the transitions. In-plane and transverse polarization corresponds to the absorption due to light polarized in and perpendicular to the plane of the rhombus isomer respectively. In the wave function, the bracketed numbers are the CI coefficients of a given electronic configuration. Symbols H1 ,H2 denote SOMOs discussed earlier, and H, and L, denote HOMO and LUMO orbitals respectively. Peak GS7
E (eV)
Symmetry 3B 3u
I
2.08
3B
1g,2g
0.0278
in-plane
|H − 1 → Li(0.7191) |H − 1 → H1 ; H2 → L + 1i(0.2645) |H2 → L + 1i(0.2536) |H1 → Li(0.2443)
II
2.68
3B
1g,2g
0.0301
in-plane
|H2 → L + 1i(0.4757) |H − 1 → Li(0.4358) |H − 1 → H1 ; H2 → L + 1i(0.3608)
III
4.19
3B
1g,2g
0.3420
in-plane
|H − 2 → Li(0.5889) |H − 1 → L + 2i(0.4283) |H1 → Li(0.2329)
IV
4.92
3B
1g,2g
0.1131
in-plane
|H1 → L + 2i(0.5780) |H − 1 → L + 2i(0.4083) |H − 2 → Li(0.3198)
V
5.17
g
0.1238
transverse
3A
f12
Polarization Wave Function |H11 , H21 i(0.8525) |H1 → L; H − 2 → Li(0.0972)
|H − 2 → L; H1 → L + 1i(0.3693) |H − 2 → L; H1 → L + 1i(0.3692) |H − 2 → H1 ; H − 2 → Li(0.5193) |H − 1 → L + 2i(0.3915) |H − 2 → L + 2i(0.3335)
5.33
3B
1g,2g
0.2470
in-plane
VI
5.85
3B
1g,2g
1.2446
in-plane
|H − 2 → L + 2i(0.7184) |H − 1 → H1 ; H − 2 → L + 2i(0.2587) |H − 1 → L + 2i(0.2579)
VII
6.55
3B
1g,2g
3.7894
in-plane
g
0.2634
transverse
|H − 2 → L + 2i(0.5706) |H − 1 → H1 ; H − 2 → L + 2i(0.4089) |H − 1 → L + 2i(0.3325) |H1 → L + 1; H − 2 → Li(0.4375) |H1 → L + 1; H − 2 → Li(0.4375) |H − 2 → L + 3i(0.4183)
1g,2g
2.9702
in-plane 34
0.2483
transverse
6.58
VIII
6.87 6.93
3A
3B
3A
g
|H − 2 → L + 2i(0.5100) |H − 1 → L + 2i(0.3495) |H1 → L + 1; H − 2 → Li(0.3558) |H1 → L + 1; H − 2 → Li(0.3558)
Table 9. Excitation energies (E) and many-particle wave functions of excited states corresponding to the peaks in the linear absorption spectrum of Al5 pentagonal isomer, along with the oscillator strength ( f12 ) of the transitions. In-plane and transverse polarization corresponds to the absorption due to light polarized in and perpendicular to the plane of the pentagonal isomer respectively. In the wave function, the bracketed numbers are the CI coefficients of a given electronic configuration. Symbols H and L, denote HOMO and LUMO orbitals respectively. Peak GS8
E (eV)
Symmetry 2A 1
f12
Polarization Wave Function |(H − 2)1 i (0.8679) |H − 2 → L + 1; H → L + 2i(0.1045)
I
1.03
2B
2
0.0195
in-plane
|H − 1 → Li(0.8635) |H − 1 → L; H → L + 3i(0.0880)
II
2.38
2B
2
0.0219
in-plane
|H − 3 → H − 2i(0.8560) |H − 1 → L + 4i(0.1387)
III
3.90
2B
1
0.1042
transverse
2A
1
0.3362
in-plane
|H → L + 4i(0.8387) |H → L; H − 1 → L + 2i(0.1944) |H − 4 → Li(0.8140) |H − 2 → L + 9i(0.1841)
IV
4.16
2B
2
1.3144
in-plane
|H − 1 → L + 4i(0.7276) |H − 1 → L + 5i(0.4478)
V
4.42
2B
2
3.3339
in-plane
|H − 1 → L + 5i(0.7096) |H − 1 → L + 4i(0.4490) |H − 1 → L + 9i(0.1535)
VI
4.78
2A
1
1.0471
in-plane
|H − 2 → L + 9i(0.7992) |H − 2 → L; H → L + 6i(0.2058)
VII
5.46
2B
1
1.1014
transverse
VIII
6.37
2B
2
0.1270
in-plane
|H − 3 → Li(0.7632)
IX
6.73
2B
2
0.7104
in-plane
|H − 3 → Li(0.7370) |H → L + 1i(0.3698) |H − 1 → L; H → L + 3i(0.1225)
X
7.49
2A
1
0.3989
in-plane
|H → L + 3i(0.5087) |H − 2 → L + 16i(0.3508) |H → L; H − 1 → L + 1i(0.2937)
35
|H → L + 13i(0.8156) |H → L; H − 2 → Li(0.1708)
Table 10. Excitation energies (E) and many-particle wave functions of excited states corresponding to the peaks in the linear absorption spectrum of Al5 pyramid isomer, along with the oscillator strength ( f12 ) of the transitions. In the wave function, the bracketed numbers are the CI coefficients of a given electronic configuration. Symbols H and L, denote HOMO and LUMO orbitals respectively. Peak GS9
E (eV)
Symmetry 2A 1
f12
Polarization
I
1.72
2B
2
0.0046
y
1.75
2A
1
0.0521
z
II
2.21
2B
2
0.0296
y
|H − 3 → L + 1i(0.7170) |H − 2 → L + 2i(0.3402) |H − 3 → L + 2i(0.2290)
III
2.55
2A
1
0.0477
z
|H → L + 3i(0.5390) |H − 4 → H − 2i(0.1296)
IV
3.46
2B
2
0.0399
y
3.48
2A
1
0.0769
z
|H − 3 → L; H − 2 → L + 1i(0.6131) |H − 3 → L + 2i(0.4975) |H − 4 → H − 2i(0.7340) |H − 4 → Li(0.3735)
4.04
2B
1
0.6432
x
4.22
2B
2
3.0735
y
VI
4.74
2B
1
0.3474
x
|H → Li(0.7617) |H → L + 7i(0.2542)
VII
5.08
2A
1
0.5494
z
|H − 2 → L; H → L + 2i(0.5540) |H − 4 → Li(0.4833)
VIII
5.26
2A
1
0.3175
z
5.27
2B
1
0.1267
x
|H − 2 → L; H → L + 5i(0.6251) |H − 4 → Li(0.3902) |H − 6 → H − 2; H → L + 1i(0.6056) |H → Li(0.3242)
IX
5.56
2B
1
0.1384
x
|H → L + 11i(0.7819) |H → L + 13i(0.3051)
X
6.00
2B
1
1.0052
x
|H → L + 13i(0.8132) |H → L + 11i(0.1852)
V
Wave Function |(H − 2)1 i (0.8591) |H − 3 → L + 1; H − 3 → L + 1i(0.1138) |H − 3 → L + 1i(0.6849) |H − 2 → L + 1i(0.2887) |H → L + 3i(0.2887)
|H → L + 7i(0.5929) |H → L + 4i(0.4432) |H − 3 → L + 2i(0.8272) |H − 3 → L + 1i(0.1580)
36