The laser cladding process involves many processing parameters. ... In many
industrial applications, the surface is the determining factor in the life time of the ...
Journal of Lasers in Engineering, vol.6, pp. 161-187, 1997
LASER CLADDING PROCESS AND IMAGE PROCESSING F. MERIAUDEAU* F. TRUCHETET* D. GREVEY** and A.B. VANNES ***
* Laboratoire GERE - Université de Bourgogne- 12 rue de la Fonderie- 71200 Le Creusot - France. Tel : (33) 85-80-30-30, Fax : (33) 85-80-36-15, email:
[email protected] ** Laboratoire ThemoMécanique - Université de Bourgogne- 12 rue de la Fonderie- 71200 Le Creusot - France. Tel : (33) 85-80-30-30, Fax : (33) 85-80-36-15 *** CALFETMAT, MMP, Ecole Centrale de Lyon, BP 131, 69131 Ecully, France
ABSTRACT The laser cladding process involves many processing parameters. We present in this paper a low cost system based on two CCD cameras, a standard acquisition card and a Personal Computer which enables the operator to interact with the process and processing parameters. Geometrical information can be extracted such as the height or the width of the track. Moreover, one of the camera is used to carry out temperature measurements. In addition we present three different methods of measuring the speed of the particles in the powder spray.
INTRODUCTION
The laser cladding process, which consists in adding a melted powder to a substrate in order to improve or change the behaviour of the material against one or several surface agressions, involves a lot of parameters. In order to perform good deposition some parameters need to be controlled during the process. In the first part we will see how the operating parameters influence the shape of the tracks. We will give a short summary of what one can find in the literature and we will also present the results obtained with our experimental set-up. CCD cameras have already been used to obtain information during processes such as laser welding, laser cladding or drilling. We shall show that a very cheap system based on a standard frame grabber,two CCD cameras and a Personal Computer can be used to provide the operator with important information during the laser cladding process. In the second part of the paper, we show that one camera previously calibrated with a black body enables the surface temperature to be determined. Moreover, the surface temperature can be used, using Beer Lambert’s law, to detect variations in the powder mass feed rate. With such a system it is possible to detect a fluctuation of 2 to 3g/min in the mass flow rate. The other camera provides information related to the powder distribution. A simple algorithm applied to the data acquired from the CCD matrix camera enables very weak fluctuations within both gas flows (carrier or shroud gas) to be observed.
1
Journal of Lasers in Engineering, vol.6, pp. 161-187, 1997
As described in part four, this camera is also used to carry out geometrical measurements during the process. Geometrical parameters such as the height (build up), the width as well as the Half Height Width of the track are obtained in real time and enable the operator to obtain information related to the process parameters such as the speed of processing or the mass flow rate. As is known the speed of the particles is also a very important parameter. Indeed, this determines the irradiation time of the particles before reaching the surface, thus leading to different states of the powder, such as liquid or solid. If the particles are still solid, the irradiation time determines whether or not the particles have a uniform. In this part a special emphasis is placed on speed measurement. Indeed three different methods involving CCD cameras are presented measuring the speed of the particles. The accuracy of the different methods and the computation time required by those methods is discussed. In the last section the work is summarized and future developments discussed.
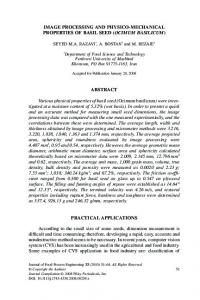
IMPORTANT PARAMETERS In many industrial applications, the surface is the determining factor in the life time of the component. In such cases, it is important to be able to improve the surface properties [1] to [4]. One of the many known solutions [5] to [8], is to deposit a specific alloy which has the requisite properties. This is termed cladding. The main problem with this technique is the number of parameters and their influence on thequality of the clad tracks. Many investigations have been devoted to establish which parameters need to be controlled during the process in order to improve the quality of the track. We cite here some articles, [9] to [12], from an exhaustive literature. It can be stated that the main parameters are the speed processing, the powder feed rate , the laser power and the beam diameter. Depending on the configuration adopted: predeposed powder, coaxially blown powder, laterally blown, the parameters do not have the same effect. Moreover, if for example a coaxially blown powder system is used, one must control the carrier gas flow and the shroud gas flow. Small variations in the powder flow rate result in large fluctuations in the geometry and the microstructure of the tracks produced. At slower processing speeds (see figure 3), the surface reaches a higher temperature, leading to a deeper penetration and thus a higher dilution and lower specific properties.
Judicious combination of the treatment parameters such as the laser power, the beam diameter, the processing speed and the powder feed rate enables the operator to control the process in order to obtain a dense cladding with a good metallurgical bond to the substrate. Variations in the parameters both lead to variations in the general shape of the tracks [13], [14], and also in the microstructure [15], [16].
2
Journal of Lasers in Engineering, vol.6, pp. 161-187, 1997
3
2,5
surface (mm2)
2
1,5
1
0,5
0 0
200
400
600
800
1000
1200
1400
Output Power (w)
figure 1: Variation of track section plotted against output power of the Nd:YAG laser
5
4,5
4
surface (mm2)
3,5
3
2,5
2
1,5
1
0,5
0 0
5
10
15
20
25
30
35
mass flow rate (g/min)
figure 2: Variation of track section plotted against powder flow rate
5
4,5
4
section (mm2)
3,5
3
2,5
2
1,5
1
0,5
0 0
0,5
1
1,5
2
2,5
3
3,5
4
4,5
5
processing speed (mm/s)
figure 3: Variation of track section plotted against processing speed
3
Journal of Lasers in Engineering, vol.6, pp. 161-187, 1997
In order to reduce fluctuations and improve the reliabilty of the product, many researchers have trying to find good and reliable sensors. During the last few years many sensors have been tried but, the high cost of such equipment, the lack of real time or on line control has led manufacturies to seek other solutions.
Some information in the literature shows how to control the laser power using an integrating sphere [9]. The powder feed rate can be controlled during the process using various methods: Grunenwalds and al [17] proposed a powder delivery system characterized by high flexibility and accuracy, Steen [18], [19], [20] and others [21], [22] used optical methods. High speed CCD camera are sometimes used and spectroscopy are required in the case of a plasma creation. Thus ways have been developed in order to control the mass feed rate, surface temperature, laser power and other pertinent parameters, involved in the laser cladding process over the past few years. However the price of this kind of sensors is still too high. We shall see below that the use of two CCD matrix cameras and some image processing tools is sufficient to detect variations of the main parameters.
TEMPERATURE MEASUREMENTS
In 1901 Max Planck developed an equation which describes a relationship between the intensity of electromagnetic radiation and its wavelength for any surface temperature. Planck's equation forms the basis for works done the field of radiometry. Max Planck's equation describes a continuum of radiation wavelengths (Fig. 4). Due to the temperature range in laser cladding our region of interest lies between 0.7 and 15 µm, the part of the electromagnetic spectrum in which most
Spectric energetic radiance (W/m2/sr/µ µ m)
radiometric surface temperature measurements are made.
1000000
T=3000K
100000
T=1800K 10000
T=1200K 1000
T=800K
100
T=500K 10
T=300K 1 0.1 0
1
2
3
4
5
6
7
8
9
10
11
12
13
Wavelength (µ µm)
Figure 4: Graphical representation of Planck’s law
4
Journal of Lasers in Engineering, vol.6, pp. 161-187, 1997
As we have shown earlier in references [24], [25], the surface temperature is a very important parameter which needs to be controlled. In order to provide contactless temperature measurement various radiometers can be used [26], but the use of a CCD camera enables the operator to get an average temperature as does a radiometer but it also provides temperature information for some precise areas. The calibration of the temperature measurement system was described in our references [28], [27]. The principle is to use the luminance emitted by the component and applying Planck’s law to be able to calculate the temperature[29], [30]. Since we do not require absolute measurements, errors made on the emissivity do not detract the efficiency of our system [31]. During cladding the camera scans the melt pool and provides an indication of the temperature. The surface temperature shows if a temperature high enough in order to melt all the particles has been reached. This is very important when different powders with different fusion temperatures are mixed since unmelted particles can initiate cracks in the clad leading to poor mechanical properties.
Real time surface temperature measurements are performed using a simple algorithm based on the stastitical momentum conservation [32] (Wen’s algorithm) which detects the two gaussians (cold and hot area) provided by the histogram(see figure 5).
Ml =
1 l f ( x, y)] [ ∑ ∑ N i j
(1)
Ml is the momentum of order l, N the number of pixels, and f(x,y) the grey level intensity of the pixel based on x=i and y=j.
If Pi is the proportion of pixels with the grey level intensity i (Pi=ni/N), one can write the four first momentums of the image: M0=1
(2)
i = 255
M1 =
∑P *i
(3)
i
i=0 i = 255
M2 =
∑ P *i
2
(4)
3
(5)
i
i=0 i = 255
M3 =
∑P *i i
i=0
A binarized image has only two populations Z1 and Z2. If one notes q1 (respectively q2) the pixel proportion of grey level Z1 (respectively Z2); if one looks at the statistical momentum conservation; the system which needs to be solved is:
M0 M1 M2 M3
= q 1 z 10 + q 2 z 02 = q 1 z 11 + q 2 z 12 = q 1 z 12 + q 2 z 22 = q 1 z 13 + q 2 z 32
(6)
After having found the linear system from the above non linear equations (6). The new system which has to be solved can be written:
5
Journal of Lasers in Engineering, vol.6, pp. 161-187, 1997
M 0 C 0 + M 1C1 = − M 2
(7)
M 1C 0 + M 2 C 1 = − M 3 C0 and C1 being known, one can evaluate the solutions Z1 and Z2 from the following equation
Z 2 + C1 Z + C 0 = 0
(8)
When Z1 and Z2 are found, it is very simple to calculate q1 and q2 from the two first equations of the system 6. Thus knowing q1 and q2, Wen’s threshold is obtained when the repartition function is equal to q1. As soon as wen’s threshold has been figured out, the average grey level (corresponding to the temperature due to the linear relation of the temperature and the grey level in our system [26], [27]) is provided by the usual relation: 255
∑G
G=
* Nb i
i i = Wen ' threshold 255
∑ Nb
(9) i
i = Wen ' threshold
where: Gi is the grey level i Nbi is the number of pixels having level value i
3000
Histogram of the image 2500
Number of Pixels
2000
1500
1000 Wien's Threshold 500
0 0
10 20 30 40 50 60 70 80 90 100 110 120 130 140 150 160 170 180 190 200 210 220 230 240 250 Grey level intensity
Figure 5. Temperature histogram
As said before, the melt pool temperature is very important, because it tells to the operator if the melting temperature of all powder components has been reached. Moreover due to the fact that our CCD camera is placed at 45° (see figure 9) above the scene we are also able to detect variations in the processing parameters. Indeed, an increase in the mass feed rate lead to a decrease in the transmitted energy. In addition to this the track has a higher build up, thus a weaker area orientated to the camera.
6
Journal of Lasers in Engineering, vol.6, pp. 161-187, 1997
As one can see on the graphics displayed below our system enables us to detect very weak variations in the mass flow rate (2 to 3 g/min (see figure 6). The authors would like to say here, that the results presented on the temperatures require an average on 3 images (120ms) This is due to the movements within the melt pool and the presence of bursting bubbles (see figures 7 and 8) during the process which lead to wide temperature variations. Thus in order to make some good comparisons, it is required to average over 3 images to smooth the temperature variations due to the different movements. 200
190
180
grey level intensity
170
160
150
140
130
120
110
100 7
9
11
13
15
17
19
21
mass feed rate (g/min)
Figure 6: Variation of the grey level intensity (temperature) versus the mass feed rate.
Bursting bubbles
Figures 7 and 8: visualisation of the melt pool.The lap between the two images is 40 ms. One can easily see the temperature difference due to pool movements and bursting bubbles.
7
Journal of Lasers in Engineering, vol.6, pp. 161-187, 1997
temperature measurements Shape measurements (grazing angle) 45 °
figure 9: Set up of the experiment
POWDER SUPPLY
We use another CCD camera in order to check other different parameters. Using a coaxial delivery system [8], [10] we have to cope with variations occuring in the carrier gas flow or with the shroud gas flow. Once one has set an adequat carrier gas flow, fluctuations in the shroud gas flow induce large variations in the powder spray geometry and modify strongly the process results. In order to help the operator to set up correctly the shroud gas flow, we developed a short acquisition system. For this, we take some acquisition of the powder spray geometry using a CCD camera which is placed in front of the cladding nozzle. Experimentally, the substrate is located at 18 mm underneath the nozzle to insure a good quality coating [8]. On the acquired images, we realize an average in order to remove some points which are not reprensative of the distribution (this is done in order to perform this task automaticaly).The averaged image of the cross section is thresheld so that the width of the powder spray can be measured automatically. Some of the results obtained are displayed on the figure 12, as one can see the technics enable us to get very accurate information relative in this case to the shroud gas flow.
8
Journal of Lasers in Engineering, vol.6, pp. 161-187, 1997
250
Not representative and very hard to do not to take into account in an automatic processing
grey Level Intensity
200
150
100
50
0 0
50
100
150
200
250
300
350
length (pixels)
Figure 10: Transversal cross section of the powder beam of a single image 180
160
140
grey level intensity
120
threshold
100
80
60
40
20
width of the powder spray
0 0
50
100
150
200
250
300
length (pixels)
Figure 11: Transversal cross section of an average of three images
500 450
width of the powder beam(pixels)
400 350
3
1
300 250 200 150 100
2
50 0 2
3
4
5
6
7
8
9
10
gaz flow rate (l/min)
Figure 12: Variations of the width powder beam versus the shroud gas flow the correct value corresponds to image 2
9
Journal of Lasers in Engineering, vol.6, pp. 161-187, 1997
SHAPE MEASUREMENTS CCD cameras have found many applications in the field of measuring the geometrical characteristics of an object, and reveal sometimes paramount information which are not accessible by another meaning. Indeed, as we have shown through the aforedisplayed curves 1 to 3, we have a changement in the track section when variations in the parameters occur. Moreover, in order to be more accurate we display below on the figure 13 the variations of the height of the tracks versus the variations of the important parameters such as the processing speed.
In order to control these parameters during the process, the CCD camera is placed at a grazing angle. Thus the camera can see the formation of the tracks in real time. Using these acquisitions we are able to detect variations of the height and of the width of the track. Those parameters are provided by the use of an edge detector [34] (Roberts) and an algorithm which is able to find the width of the tracks (the wider part) and knowing the width one can find the height. The algorithm can also easily measures the Half Height Width (figure 14-15) as well as the cross section of the track and consequently we determine the process efficiency.
As shown on the results (see figure 11) the system is able to detect very small in the processing speed. 1,6
1,4 Results found by postmortem metallurgical analysis
1,2
Height (mm)
1 Série1 Série2 Série3 Série4
0,8 Found by image processing 0,6
0,4
0,2
0 0
0,02
0,04
0,06
0,08
0,1
0,12
0,14
0,16
0,18
0,2
processing speed (m/min)
Figure 13. Variation track height provided by the CCD camera versus the processing speed
10
Journal of Lasers in Engineering, vol.6, pp. 161-187, 1997
width
height
figures 14 and 15: image acquired at a grazing angle. Results after application of an edge detector
Due to the fact that an ambiguity may exist on which parameter varies, we add another sensor to check the mass feed rate. The sensor is an optical sensor (photovoltaïc cell) to which a laser beam going through the powder stream is directed. Using an electronic amplification and a serial liaison (RS 232) between the sensor and a Personal Computer we are able to record the mass feed rate variations.
SPEED OF THE PARTICLES The speed of the particles is a very important parameter involved in the process. It defines the interaction time of the particles with the laser beam before reaching the substrate surface. If one looks at the heat equation which can be applied herein to an homogeneous, isotropic and limited medium; assuming that no heat sources and no well of heat within the particle exist, one can write the equation as follow:
∆T −
1 ∂T 1 dk + gradT → = 0 α ∂t k dT
(
)
(10)
where:
∆T is the temperature Laplacian α is the thermal diffusivity (m2.s-1)
k is the thermal conductivity (W.m-1.K-1)
Assuming that the thermal conductivity does not vary with temperature, Huetz [35] has solved the heat equation for a sphere and has given the solution for a fast increase of the temperature at a point M’ situated at a distance r from the point source M (r = diameter of the particle). The temperature can be written:
T( r ,t ) =
k (αt )
3 2
e
− r2 4 αt
(11)
After differenciation, the time when the temperature is maximal at the point M’ will be:
11
Journal of Lasers in Engineering, vol.6, pp. 161-187, 1997
tM =
r2 6.α
(12)
Thus, knowing the speed of the particle we are able to know if the particles have an homogeneous temperature when they reach the surface. This parameter is important in order to prevent the apparition of cracks due to the non-melted particles.
As one can see on the table I, the required time for the particles to reach an homogeneous temperature while reaching the surface is around the tenth of the milliseconde. As we shall see above, the irradiation time in our experimental set-up is greater than this value, leading to a good quality track.
Stellite 6
r = 60µm
1.58.10-4 s
r = 80 µm
2.81.10-4 s
Table 1: Required time in order to get an homogeneous
temperature within the particle
Sometimes with an output laser power important enough, the particles can reach the fusion temperature before reaching the surface. The fact is very important, indeed in the paper [36] we can note that when the powder has reached the fusion temperature, the relative required energy in order to assure a good quality coating (strong metallurgical bond) is weaker than for non melted particles during the flight.
Thus if one looks at the energy transfer, the internal energy variation within a powder grain can be written as:
∆Q i = m(C p . ∆T + δ. ∆Η f )
(13)
with: m: mass of the particle (kg) Cp: Specific heat (kg.m-3)
∆Η f : Fusion enthalpy (J.kg-1) δ : step function
= 1 if T>Tf = 0 if T