Lateralization of a moving auditory image: Interrelation of interaural time and intensity differences Jacob A. Altman,a) Olga V. Variaguina, and Nikolay I. Nikitin Laboratory of Hearing Physiology, I. P. Pavlov Institute of Physiology, Russian Academy of Sciences, Nab. Makarova 6, 199034, Saint Petersburg, Russia
Elena A. Radionovab) Laboratory of Functional Asymmetry of the Human Brain, I. M. Sechenov Institute of Comparative Physiology and Biochemistry, Russian Academy of Sciences, M. Torez Prospect 44, 194223, Saint Petersburg, Russia
~Received 10 November 1996; revised 3 August 1998; accepted 28 August 1998! Lateralization of moving fused auditory images ~FAIs! was studied under dichotic stimulation, with FAI movement from the right and left ears to midline. The movement was produced by the gradual change of interaural time delay ~from 6630 to 0 ms! in a binaurally presented click train in which a constant interaural intensity difference ~IID! between 613 dB was also imposed. The task of the subjects was to show with her/his finger the point on the head surface where the FAI trajectory’s ending or starting points were perceived. With IID change within 613 dB, the FAI movement trajectory shifted toward the ear receiving the more intense stimulus. The length of the movement trajectory shortened with IID increase. Functions relating the value of perceived lateral position ~Y! of the movement trajectory’s ending and starting points to IID value ~X! were nearly linear: Y 5AX1B. These functions differed in their characteristics whether the movement was to the right versus to the left of midline. They also differed from analogous functions for stationary FAI. At IID50 the FAI movement trajectory’s endpoint was shifted from midline in the direction of movement. Equivalence ratio for IID and ITD were estimated to be 51 and 29 ms/dB respectively for the trajectory’s starting and ending points. The IID factor could be several times as effective in moving FAI lateralization as the ITD factor. © 1999 Acoustical Society of America. @S0001-4966~98!02612-5# PACS numbers: 43.66.Pn, 43.66.Qp, 43.66.Rq @RHD#
INTRODUCTION
Perception by humans of sound source motion is one of the most important features of sound source localization in space. However, up to the end of the 1960’s there were only a few studies concerning perception of the sound source motion ~Altman, 1968; Harris, 1972; a detailed historical review can be found in the comprehensive work by Perrott and Strybel, 1997!. Starting in the late 1960’s the number of publications connected with different aspects of perception of sound source motion increased nearly four times ~Perrott and Strybel, 1997, Fig. 1!. As follows from the above review, investigation of such a peculiar form of motion as autokinesis practically ceased beginning from the middle of the 1970’s. Relatively few studies have been performed under real, free-field sound source motion ~e.g., Perrott and Musicant, 1977, 1981; Mateeff and Hohnsbein, 1988!, because of the serious methodical difficulties in such investigations. The greatest number of works were carried out using simulation of sound source motion—either with dichotic stimulation or with the help of a set of loudspeakers switched on successively. Just these two methodical approaches resulted in an increase in the number of works on perception of auditory image movement. It should be mentioned that simulation of a!
Electronic mail:
[email protected] Electronic mail:
[email protected]
b!
366
J. Acoust. Soc. Am. 105 (1), January 1999
sound source motion in different planes with the help of a set of loudspeakers or with dichotic stimulation has been widely used during recent years both for creating virtual acoustical reality and for analysis of special features of this reality perception ~Wenzel, 1992; McKinley et al., 1994!. Results of investigations of sound source motion perception are considered in detail in a number of reviews in recently published books on hearing ~Grantham, 1995, 1997; Perrott and Strybel, 1997; Saberi and Hafter, 1997!. Briefly, it can be noted that up to present a number of important characteristics is described concerning perception of the auditory image movement under dichotic stimulation with ITD and IID changing in time. In particular, limit conditions are established for forming movement of the auditory image ~Blauert, 1972; Altman and Romanov, 1988; Grantham and Wightman, 1978!; differential thresholds and subjective scales are measured for velocity perception of the auditory image movement ~Altman and Romanov, 1988!; characteristics of binaural release from masking for moving auditory image are also described ~Altman et al., 1982!. To extend our knowledge about perception of moving sound sources, further systematic study is necessary concerning perception of different ~not yet investigated! parameters of moving sound sources. In particular, there are possible competitive relations between two main factors underlying moving sound source localization in the horizontal plane, namely between interaural differences in time and intensity.
0001-4966/99/105(1)/366/11/$15.00
© 1999 Acoustical Society of America
366
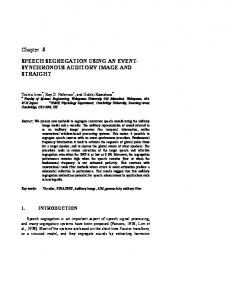
FIG. 1. Acoustic characteristics of the signals presented to the right and left ears. ~a! Click waveform; ~b! frequency spectra of the clicks.
FIG. 2. Schematic representation of sound signals producing a sensation of fused auditory image ~FAI! movement from left to right ~a!, from right to left ~b!, and of a stationary sound ~c!.
B. Sound signals
It is known that changes of interaural time or intensity differences during binaural presentation of the sound signal through head earphones result in auditory image movement over a certain trajectory ~Altman and Viskov, 1977; Altman and Romanov, 1988!. However, it still remains unknown how this illusion of sound source movement produced by one of the above factors ~e.g., by interaural time differences, ITD, changing in time! can be influenced by the other localization factor ~by interaural intensity differences, IID!. In a number of earlier works ~Harris, 1960; Hafter and Carrier, 1972; Yost and Hafter, 1987! it was shown that the spatial position of a stationary auditory image ~lateralized by some value of ITD! could be changed by introducing an IID. Therefore a specific goal of the present work was to study the influence of IIDs on the trajectory of auditory image movement produced by changing ITDs. It seemed that estimation of this characteristic of directional hearing would be of importance also for such significant problems as masking in the process of sound source movement, localization of multiple sound sources, as well as for further possibilities in forming acoustical virtual reality.
I. METHODS A. Subjects
The work was performed on ten subjects ~six women and four men! with normal hearing and with small differences in threshold values for both ears. Nine of the subjects were aged 23–29 and one subject ~male! was aged 42. 367
J. Acoust. Soc. Am., Vol. 105, No. 1, January 1999
Sound signals were binaurally presented click trains which produced in listeners a sensation of a moving or stationary fused auditory image ~FAI!, depending on whether the interaural time delay was changing or constant. A twochannel generator of rectangular impulses was employed which allowed changing the value and sign of delay between the two channels of stimulation. Each impulse duration was 100 ms, and the click train duration was equal to 2 s. The click repetition rate was 25/s. Such a frequency was quite comfortable for listeners and enough to form in them a sensation of auditory image movement ~Altman, 1981!. For acoustical stimulation two dynamic earphones ~TDS-5, Russia! with identical characteristics were used. Their characteristics ~Fig. 1! were measured with Bru¨el & Kjaer apparatus ~condensor microphone 4131!. Maximal intensity of the acoustical click trains, when measured monaurally, was about 60 dB above threshold. Signal intensity at the right and left ears was controlled separately ~with attenuators graded in nepers! within 62 Np and converted to decibels (1 Np58.67 dB). Click intensity was expressed in dB SPL as equivalent to the intensity of a 1-kHz tone signal of the same peak amplitude. The amplitude characteristics of the acoustic stimulation channels were linear within the range of 80 dB. To produce a sensation of auditory image movement, the ITD between two channels was gradually decreased throughout signal presentation, as shown in Fig. 2. The initial interaural time delay was 630 ms; with equal intensities of stimulation at both ears, this should produce an auditory image located near the leading ear. The final delay was equal to Altman et al.: Moving auditory image
367
zero. Thus at the moment of signal cessation the auditory image should be located at the subject’s midline. The sign of the initial delay determined the direction of auditory image movement, either from left to right or vice versa. As shown by direct measurements, the mean trajectory length at IID 50 was equal to 69 deg; thus with signal duration of 2 s the mean value of FAI movement velocity was 34.5 deg/s; at higher IID values it could be even lower depending on the direction of FAI movement. With synchronous stimulation of the right and left ears ~when only one ITD was employed, namely equal to zero over the whole time of stimulus presentation! the sound signal was perceived as stationary and the auditory image was lateralized near midline. C. Experimental conditions and procedure
The study was performed with two different instructions to the subjects: in the first part of the experiments ~performed on ten subjects! the task was to estimate the position of the ending point of the FAI movement trajectory; in the second part of the experiments five of these subjects had to estimate position of the trajectory’s starting point. Other conditions were the same in all the experimental sessions. The measurements were performed in a quiet soundattenuated room. On the subject’s head a tape graded in centimeters and going from one ear to the other was fixed, its zero mark coinciding with the head midline. The tape position corresponded to the path through which FAI moved. In seven subjects the tape was fixed in the vertical ~frontal! plane passing through the two ears. In three subjects the tape was fixed at the back of the head in the horizontal plane, with zero mark also at the midline. The average length of the arc going from one ear to the other in the frontal plane was 35.0 cm ~from 33 to 36 cm in seven subjects!; the length of the arc going around the back of the head was 31.0 cm ~when averaged over three subjects!. The subjects were instructed to listen attentively to the sound, with his/her eyes closed, and to show with a finger ~after stimulus cessation! the point on the head where the end or the start of the auditory image movement was perceived. The subject was free to show any point on the head where he/she perceived movement cessation or starting. The distance from these points to the head midline was measured in centimeters and converted to degrees, with the assumption that the length of the arc from one ear to the other was equal to 180 deg. Eight of ten subjects responded by pointing to a position of FAI on the tape itself, at any IID values used. In two others, at high IID values ~of 613 and 617.3 dB! the indicated points deviated from the tape for 1–5 cm; in these cases, to measure the point position in relation to midline, an arc ~whose center corresponded to the ear canal opening! was traced from the indicated point to the tape and thus the indicated point was projected to the tape. When stimulated with the click train which produced sensation of unmoving auditory image, the subject showed the place of its location; the distance between the unmoving FAI and the head midline was also expressed in centimeters and degrees. As it was established by repeated readings from the tape measure, in the great majority of cases ~when the point indicated by the subject lay on the tape! accuracy of the response measure did 368
J. Acoust. Soc. Am., Vol. 105, No. 1, January 1999
not exceed 0.5 cm ~of about 2.5–3 deg!, i.e., half of the minimal division on the tape; in other cases this value could achieve about 5–10 deg. Prior to the experiments the subjects were trained on estimating both the direction of auditory image movement, and its starting and ending location. A short training period was sufficient for all the subjects to estimate with confidence the end and start of trajectory of the auditory image movement as well as the position of the stationary FAI. Reliability of the pointing response was different in different subjects: some responded immediately after the first ~of three! stimulus presentations and did not change their estimates, whereas others moved their finger back and forth over a certain distance ~of about 1–3 cm! before giving their final response. This difference also manifested itself in different values of standard deviation of the mean estimates obtained in different subjects, as described in Sec. II. Each session began with threshold measurements at the right and left ears separately with a stationary click train of 2-s duration as stimulus. The method of limits was used. Thresholds were measured with the step of 1.7 dB in the near-threshold intensity range. A signal intensity producing a 0.5 detection probability was used as the threshold. Threshold measurement took about 4–6 min and was not tiring for the listener. Then, under conditions of simultaneous binaural stimulation and eyes closed, the subject was asked to perform by himself/herself the task of centering the stationary auditory image, i.e., to place the auditory image at the head midline by varying sound signal intensity at one of the ears ~at the left one! by controlling an attenuator. The initial level of the sound at this ear was about 40 dB above threshold. Signal intensity at the other ear ~the right one! remained constant ~about 40 dB above threshold!; this intensity level was loud enough and quite comfortable for the subject at the same time. The signal intensity set by the subject at the left attenuator was evaluated. The centering procedure took about 1–2 min ~a single adjustment was done!. Subsequently the main part of the experiment started: the estimation of the perceived starting or ending points of FAI movement trajectory. These experiments included four series with interaural intensity differences under conditions of FAI movement from right to left and from left to right. The series differed in the direction of FAI movement ~from right to left or from left to right! and in the side ~either the left or the right! at which sound intensity was varied. Each signal was presented three times with an interval of about 0.5 s. Immediately following the stimulus, the subject pointed to the starting or ending points of the FAI movement trajectory. When wanted, the signal was repeated. Before each signal presentation the subject was notified about it. Measurements were begun with signals of equal intensities at the right and left ears ~about 40 dB SL! with one of the FAI movement directions. Next, the intensity at one of the ears was first reduced from 40 dB SL ~in 4.3-dB steps! and then increased from 40 dB SL ~in 4.3-dB steps!, resulting in eight levels of IID within the range 617.3 dB. The series was ended with a final presentation of the signal of equal intensities ~40 dB SL! at two ears. Thus during the whole series ten IIDs were presented in succession, each repeated three times ~or more Altman et al.: Moving auditory image
368
in some cases!. Duration of such experimental series was about 4–6 min. Then, after a short pause ~of about 0.5–1 min, when the subject was offered a rest! the next series of measurements was performed, differing from the former only in direction of FAI movement. These two series were followed by two analogous series in which ~also at two different directions of FAI movement! signal intensity was varied at the other ear. The session was ended by repeating the procedure of centering a stationary auditory image. Duration of the session as a whole was 30–40 min with no fatigue of the subjects. This procedure was repeated five or six times with each subject, the replications being completed on different days. The above procedure was used in the experiments for estimation of both the ending and starting points of FAI movement trajectory. In addition, three of the subjects took part in control experiments in which the position of the earphones was changed ~from the left ear to the right one and vice versa!; results of these experiments did not differ from those described above. The procedure for control experiments with stationary auditory images was the same. It included two series with interaural intensity differences at the left and right ears. Two such replications were performed on each subject. D. Data processing
Results were averaged for each subject separately. Perceived positions of the FAI movement trajectory’s ending or starting point ~in degrees! at different IID values were estimated. Functions were constructed that were functions relating perceived position of the end ~or of the start! of the trajectory to IID value. Results obtained with IID variation at the left and right ears were combined taking into consideration that IID increase at one ear and IID reduction at the other resulted in practically the same values of perceived lateral position of the end ~and of the start! of FAI trajectory. Thus each point on the graphs related to FAI movement was the mean of 10 or 12 measurements for each of the subjects, except for the point at IID50, which was the mean of 20 or 24 measurements on each subject. For each subject, the perceived lateral position of the FAI at stimulus offset or onset was plotted as a function of IID, and the data fitted by a linear function: Y 5AX1B, where Y ~the perceived lateral position of the offset or onset in degrees! is expressed as a function of X, the stimulus IID. The best-fitting straight lines were obtained using a linear least-squares criterion. In this equation, B represents the perceived lateral position when IID50 ~the intercept!, and A represents the rate at which the perceived lateral position changes with IID ~the slope of the function!. II. RESULTS A. Thresholds
Hearing thresholds were similar in all subjects: in nine of ten persons ~measurements on 18 ears! threshold values varied from 23 to 27 dB SPL; in the tenth subject thresholds 369
J. Acoust. Soc. Am., Vol. 105, No. 1, January 1999
were lower ~19.5 dB SPL for both ears!. The thresholds of the oldest subject practically did not differ from the younger ones. In all the subjects threshold variability was extremely low in different experimental sessions. Difference in threshold values for the left and right ears was also rather low in all the subjects: mean threshold values differed by 0.17–0.87 dB. The average of this difference was 0.37 dB ~with the lower threshold for the right ear!. As can be calculated from results presented below ~Table II! this difference corresponded to an average change of stationary FAI position by 1.1 and 1.5 deg ~for the left and right sides, respectively!;1 for moving FAI this change did not exceed 1.2 deg. Since these values were lower than possible error of measurements they are not reflected on the graphs below. B. Centering of stationary FAIs
Experiments with centering stationary FAI ~ten subjects! showed that in all subjects, stimulation of one of the ears was somewhat more effective in FAI centering than stimulation of the other ear. This difference was 0.3–4.2 dB. On the average, perceived position of FAI at midline in the centering experiment was achieved when left ear stimulation was slightly more intense ~by an average of 0.78 dB!; i.e., the right ear was slightly more effective ~with threshold difference of the right and left ears taken into account!. C. Perception of moving FAIs
For IIDs within 613 dB the FAI movement trajectory ~from left to right or from right to left! in seven subjects was located in the vertical ~frontal! plane passing through the two ears, whereas in three others the auditory image moved in the horizontal plane around the back of the head. For IID exceeding 13 dB, trajectories moving in the vertical plane could deviate in the direction of the horizontal plane ~although to a different extent in different subjects!; for IID5617.3 dB trajectories often proved distorted, therefore these data will not be discussed further. The FAI movement sensation was reported by all subjects at all IID values used in this work. The subjects did not notice any changes of signal duration at different IIDs. When asked, half of the subjects perceived a velocity decrease with an IID increase, although in all cases a shortening of the path covered by the moving FAI was observed. With an IID increase, FAI movement trajectories were shifted toward the more intense sound. This shift value, when averaged, proved practically identical in cases when the stimulus intensity was increased at one ear and in cases when it was reduced at the other ear. Thus within the working range of intensities the FAI movement trajectory shift did not depend on summed loudness of the sound signal. Therefore it proved possible to average ~for each direction of FAI movement! the data obtained in the experimental series with stimulus intensity variation at the right and left ears. An example of FAI movement trajectory shift based on interaural intensity differences is shown in Fig. 3. It can be seen that with no interaural intensity differences (IID50) FAI movement trajectories are placed asymmetrically in relation to midline for both directions of movement: the trajecAltman et al.: Moving auditory image
369
FIG. 3. Positions of trajectories of FAI movement ~arrows! at different values of interaural intensity differences ~IID, dB!. Here and in all other cases positive values of IID mean that right ear stimulation is more intense than the left one, negative values correspond to more intense stimulation at the left ear. Mean data of subject N ~Figs. 4–6, white squares!.
tory endpoints are not at midline ~although at the moment of movement cessation ITD50), but are shifted in the direction of movement. It can be seen also that for both directions of FAI movement, an intensity increase at the right ear ~or a decrease at the left! results in a shift of the trajectory to the right and shortening of the trajectory length. In contrast, an intensity decrease on the right ~or an increase on the left!, i.e., IID change from 0 to 213 dB, produces a trajectory shift to the left with a less pronounced change of the trajectory’s length. D. Lateralization of moving trajectory endpoints
To reveal the specificity of the movement effect, the results obtained for moving FAI were compared to those for the stationary one. For this purpose the experiments with estimation of the ending point of FAI movement trajectory were analyzed first. It was just the ending point which corresponded to ITD50 as was the case also for the stationary FAI. In this part of the study ten subjects were investigated. These data are presented in Figs. 4–6 and in Tables I–III. It was established that dependence of the trajectory’s perceived ending point positions on IID value could be described by two lines ~functions of the type Y 5AX1B) fitted to the subject’s judgements on the left and right sides, respectively ~Figs. 4, 5!. Since the above functions were of different steepness at positive and negative IIDs, their A and B values were estimated separately for 1IID and 2IID conditions. However, B values were rather close for 1IIDs and 2IIDs ~the means differed by 1.3 and 1.5 deg, Table I! and therefore they were combined. Characteristics of perceived positions of the end of FAI movement trajectory following interaural intensity differences were rather different in different subjects ~Figs. 4, 5!, both in curve slopes and in positions of the central point on these curves ~corresponding to IID50) in relation to midline. However, with left–right FAI movement, the perceived position of the endpoint was farther to the right of the midline than to the left of it ~Fig. 4!. With movement in the opposite direction ~Fig. 5! lateralization of the trajectory’s endpoint was greater to the left than to the right of midline. It was also found that at IID50 the perceived position of the trajectory’s endpoint ~B value! in most cases was shifted in the direction of movement: to the right in Fig. 4 and to the left in Fig. 5 ~see also Table I!. B values, when 370
J. Acoust. Soc. Am., Vol. 105, No. 1, January 1999
FIG. 4. Perceived position of the endpoint of FAI movement trajectory with FAI movement from left to right, depending on interaural intensity differences. Mean data for ten subjects ~shown by different symbols! approximated by the straight line. On the abscissa: interaural intensity difference, IID, dB; positive values correspond to more intense stimulation at the right ear, negative values to that at the left ear. On the ordinate: perceived position of FAI movement trajectory endpoint in relation to midline, in degrees; positive values correspond to right-side position, negative values to the leftside position.
averaged for the left and right branches of the curves of Figs. 4–5, were 17.1 deg for rightward direction of FAI movement and 23.5 deg for the leftward direction. The difference in these B values was significant (t53.911, p,0.01). Both values differed significantly also from the mean B value ~12.5 deg! obtained for stationary stimuli ~Fig. 6!: for movement from right to left t52.667 (p,0.05) and for movement in the opposite direction ~from left to right! t52.137 (0.01, p,0.05). Besides, in comparison with a stationary stimulus ~Fig. 6! for moving stimuli ~Figs. 4–5! greater absolute values of IID were required to cause the trajectory’s endpoint to be lateralized at midline: Observing where the functions intersect the horizontal line ~0 deg! in Figs. 4–5 indicates that on the average a 24.2 dB IID was required for left-to-right FAI movement ~Fig. 4!, and a 12.1 dB IID was required for movement in the opposite direction ~Fig. 5!; corresponding values for a stationary stimulus ~Fig. 6! were about 21 dB. In general, lateralization of the endpoint of the moving FAI was greatest when the direction of the IID factor was consistent with the direction of movement, suggesting that the effects of IID and ITD were summed, i.e., IID and ITD influences were coincident. When the direction of the IID did not coincide with FAI movement direction ~i.e., with competitive relations of IID and ITD factors!, the lateralization of Altman et al.: Moving auditory image
370
FIG. 5. Perceived position of the endpoint of FAI movement trajectory with FAI movement from right to left, depending on interaural intensity differences. Mean data for ten subjects ~shown by different symbols! approximated by the straight line. Designations as in Fig. 4.
trajectory’s end point proved usually significantly lower ~Figs. 4–5!. Of 20 cases presented in Figs. 4–5, only two exceptions to this rule were observed ~Fig. 4, filled circles; Fig. 5, asterisks!. The slope of the functions investigated ~Figs. 4–5! determined by coefficient A in equation Y 5AX1B, reflects the effectiveness of the IID factor in lateralization of the end point of FAI movement trajectory: It shows the value ~in degrees! for which the trajectory’s end point is shifted following IID change for a certain value ~in decibels!. Coefficient A values are presented in Table II. For comparison, analogous values are presented for the stationary FAI ~see also Fig. 6!. The difference in A values ~Table II! evidences different effectiveness of IIDs on both sides of midline; this points to a certain asymmetry in organization of the lateralization process. As can be seen from Figs. 4, 5, and Table II, with FAI movement the slope of the functions was greater when the direction of trajectory shift produced by IID coincided with the direction of FAI movement. Thus it proved characteristic that: ~i! functions relating perceived ending point positions to IID, depended on movement direction; ~ii! their slope ~represented by the coefficient A! was different on the right and on the left of midline; ~iii! at IID50 the trajectory’s end ~when ITD50 ms) was often shifted to the right or to the left of midline, i.e., the value B as a rule was not equal to zero; and ~iv! maximal shift values of the trajectory’s ending points ~at IID5613 dB) depended on the FAI movement direction and on the side ~the right or the left one! where these points of trajectory were. 371
J. Acoust. Soc. Am., Vol. 105, No. 1, January 1999
FIG. 6. Perceived position of the unmoving FAI with constant ITD ~0 ms! throughout the click train. Mean data for ten subjects ~shown by different symbols! approximated by straight line. Dots on the scheme at the top mean conventionally different positions of unmoving FAI. Designations as in Fig. 4.
E. Lateralization of moving trajectory start points
The position of the starting point was also described as a linear function of IID value. The mean starting location is presented on Fig. 7. At IID50 dB, the mean values of the trajectory’s starting position ~at ITD5630 ms) were equal to 261 deg when FAI moved from left to right and to 166 deg with movement in the opposite direction; the difference between absolute values of these two means was not significant (t50.495, p.0.5). In Fig. 7~a! the functions for the starting and ending point positions are practically equal in slope only when the influence of the IID factor is opposite in its direction to the direction of FAI movement ~i.e., within the IID range from 0 to 213 dB!. In case of coincident action of IID and ITD factors @within the IID range from 0 to 113 dB in Fig. 7~a!, and to 213 dB in Fig. 7~b!# the slopes of both functions become different: the mean values of coefficient A for the ending and starting points @Fig. 7~a! and ~b! combined# were equal, respectively, to 3.3 and 5.6 deg/dB. The data of Fig. 7 show a shortening of the trajectory’s length ~defined as the difference between perceived positions of the starting and ending points! with IID increase, due to the greater steepness of the functions obtained for the starting point position as compared to the corresponding functions for the ending point. At IID50 the mean trajectory length was about 68 deg @Fig. 7~a!# and 70 deg @Fig. 7~b!# with a mean of about 69 Altman et al.: Moving auditory image
371
TABLE I. B values ~intercepts!, in degrees, for moving ~arrows! and for stationary FAI ~cross! to the left ~L! and to the right ~R! of midline. The data for the trajectory’s endpoint, ten subjects.a B value ~deg! b ← L R
a → minimal maximal mean averagedb s.d.
L
R
24.1 23.8 7.8
23.1 20.7 6.5
223.5 9.4 22.7
7.1 8.6
23.5 8.6
224.3 5.5 24.2
c 1 L
R
23.6 9.7 3.0
24.5 10.0 1.9 2.5 4.9
Notes: B value in the equation Y 5AX1B for the experimental data ~Figs. 4–5! corresponds to the perceived position of FAI movement trajectory’s endpoint and of stationary FAI at IID50. Minimal and maximal values are the limits of coefficient B observed in the experiments. L, R correspond to left and right branches of the functions. Arrows show directions of FAI movement ~from left to right and from right to left!, the cross corresponds to stationary FAI. b L and R values are combined. a
deg. At IID5113 dB @in Fig. 7~a!# the mean trajectory length was about 27 deg, differing significantly from that at IID50 dB (p,0.01). In the other case @Fig. 7~b!, at 213 dB# changes of the trajectory length manifested themselves only as a tendency, being statistically not significant.2 With the above mean trajectory lengths of about 69 and 27 deg and constant signal duration of 2 s, calculated values of perceived movement velocity were 34.5 and and 13.5 deg/s for IID equal to 0 and 113 deg, respectively. With IID increase velocity decrease was actually reported by half of all subjects. Other subjects could not identify a certain change in sensation ~at extreme IID values! with change in movement velocity. Subjects differed to a certain extent in their accuracy of estimation of FAI movement position, both of its starting and ending points. ~Accuracy of estimation was measured by standard deviation of the mean estimate.! Accuracy of estimation of the starting point position ~at ITD5630 ms) was rather low: At IID50 dB standard deviation of the mean estimate varied between 5 and 18 deg for different subjects. Meanwhile when judging trajectory endpoint position near the head midline ~at equal intensities of stimulation at both ears and ITD50, when the error was usually minimal!, variability of estimates characterized by standard deviation varied between 2.3–9 deg and thus was about twice as low as variability of responses with determination of the starting
point position. With increasing distance from midline following IID increase, variability of estimates usually became higher and in some cases reached 20 deg for endpoint estimates and 47 deg for estimation of the trajectory’s starting point. As showed our supplementary experiments ~reported in the Appendix! the higher accuracy of endpoint judgement than of start point judgement resulted not from the temporal position of the judged point ~start or end!, but rather from the fact that positions near midline are judged more accurately than those more lateral, whether they are start points or endpoints. F. Equivalence ratios for IID and ITD
To evaluate equivalence ratio ~E! for IID and ITD factors ~in ms/dB! under conditions of FAI movement, positions of the trajectory ending and starting points ~in degrees! were converted to equivalent values of interaural time delay ~in microseconds!, assuming that ~a! FAI shift for 69 deg ~the mean value of the trajectory’s length at IID50, as it was described above! corresponded to change of interaural time delay ~DITD! for 630 ms ~ITD change throughout the signal duration!, and ~b! both parameters ~IID and ITD! were linearly interconnected ~Blauert, 1974!. Thus the FAI shift for 1 deg was equivalent to an ITD of about 9.1 ms ~630 ms/69 deg; see also Blauert, 1974; Yost and Hafter, 1987!. For the
TABLE II. Coefficient A ~deg/dB! for moving ~arrows! and for stationary FAI ~cross! to the left ~L! and to the right ~R! of midline. The data for the trajectory’s endpoint, ten subjects.a A-value ~deg/dB! a →
b ←
L
R b
L
c 1 R b
L
R
minimal maximal
0.6 3.3
1.3 5.6
2.6 4.7
0.9 4.9
1.6 5.6
1.7 5.9
mean s.d.
1.7 0.78
3.3 1.40
3.2 0.77
2.0 1.17
3.0 1.28
4.0 1.39
Notes: Coefficient A in equation Y 5AX1B determines the slope of the straight lines, as in Figs. 4–7. Minimal and maximal values are the limits of coefficient A observed in the experiments. b Trajectory’s endpoint does not go to the left side ~Fig. 4 filled triangles, filled squares! and to the right side ~Fig. 5, filled triangles!. a
372
J. Acoust. Soc. Am., Vol. 105, No. 1, January 1999
Altman et al.: Moving auditory image
372
TABLE III. Equivalence ratio, in ms/dB, for coincident and competitive relations of IID and ITD factors for moving FAI, at the movement trajectory length of 67 deg and FAI movement velocity of 34.5 deg/s.a
a
Equivalence ratio, E ~ms/dB!
IID and ITD interrelation
Starting point
Ending point
Coincident Competitive
51 13
29 17
Notes: E-values are calculated from the data of Fig. 6 as E5A(DITD/l). The data for both directions of FAI movement are combined. Other details are in the text.
trajectory length of 69 deg, values of equivalence ratio ~in ms/dB! were calculated by multiplying values of coefficient A ~deg/dB! by 9.1 ms/deg. Results of these calculations for trajectory’s length of 69 deg are presented in Table III, the data for both directions of FAI movement being combined, separately for coincident and competitive effects of IID and ITD. Table III shows that E values varied considerably ~within 13–51 ms/dB!, depending on FAI perceived position ~starting versus ending points! as well as on IID and ITD interrelation ~coincident versus competitive!. With changing trajectory’s length following IID change ~Fig. 7! the values of the equivalence ratio changed: e.g., at IID5113 dB, E values were 2.6 times higher than presented in Table III. In general, in our experiments, the equivalence ratio for dynamic ITD and static IID factor could be described as E 5A(DITD/l). As to equivalence ratio for the stationary signal, we as-
FIG. 7. Perceived positions of the starting and ending points of FAI movement trajectories depending on interaural intensity differences at different directions ~a, b! of FAI movement. Function for the starting point presents mean data for five subjects. Function for the ending point is constructed from the mean B and A values for ten subjects presented in Tables I, II. Other designations as in Fig. 4. 373
J. Acoust. Soc. Am., Vol. 105, No. 1, January 1999
sumed ~in accordance with Blauert, 1974, Fig. 87! that at ITD5630 ms the FAI shift amounted to 72 deg, and thus 1-deg shift was equivalent to ITD58.75 ms ~630 ms/72 deg!. Multiplying the value 8.75 ms/deg by coefficient A ~deg/dB! gives an equivalence ratio of about 26 ms/dB to the left of midline and about 36 ms/dB to the right of it. These values are near to those in literature described for stationary signals ~more often near 20–30 ms/dB according to different authors; Yost and Hafter, 1997; Saberi and Hafter, 1997!; they are lower than E values for moving FAI with coincident effects of IID and ITD factors and higher than E values for moving FAI with competitive effects of both factors. III. DISCUSSION
As was shown, FAI movement trajectory shifted toward the ear receiving the more intense sound. The following aspects of moving auditory image lateralization will be considered: inertial property of the auditory system under moving FAI lateralization, functional asymmetry of the phenomena observed, and relative effectiveness of IID and ITD in lateralization of moving FAIs. A. Inertial property
Inertia manifestation under conditions of coincident interaction of the main factors ~IID, ITD! of sound source localization could be expected based on earlier works on lateralization and localization of moving auditory images ~sound sources!. Altman and Viskov ~1977! and Altman and Romanov ~1988!, using dichotially presented click trains as stimuli, showed that to produce sensation of movement, a certain time interval ~not longer than 100–150 ms! is needed between subsequent clicks in the train. This means that there is an inertia process which prolongates ~within the time period of about 100–150 ms! the excitation state produced by each click in the train and thus secures a possibility of summation of subsequent excitations following subsequent clicks. The latter process seems necessary for sensation of uninterrupted movement. Perrott and Musicant ~1977, 1981! and Mateeff and Hohnsbein ~1988! working under free field conditions found that with a moving source, the locus of a perceived signal was shifted in the direction of motion. This conclusion is confirmed by the data of the present work for FAI movement trajectory’s endpoint at IID50, in spite of the difference in experimental conditions in our work and especially in the above works by Perrott and Musicant ~dichotic versus free-field stimulus presentation; signal onset near the ear versus near midline; click versus 0.5 kHz tone signal; signal duration of 2.0 s vs 50–300 ms!. As shown, in most of our subjects at IID50, the end of FAI movement trajectory ~at ITD50 as well! was perceived as lateralized to the right of midline ~by a 7.1 deg average! with FAI movement from left to right, and as lateralized to the left ~by a 3.5 deg average! with FAI movement in the opposite direction ~Table I; the difference being statistically significant!. Thus with FAI movement, the position of the trajectory’s end ~as estimated by subjects! does not coincide with the head midline in spite of the fact that at this moment there are no interaural differences in stimulation (ITD50, IID50). It is typical that perceived shift of the movement Altman et al.: Moving auditory image
373
trajectory’s end goes in the direction of FAI movement; this allows one to think about inertia of the physiological mechanisms underlying the processing of FAI movement and/or connected with forming an estimate and making a decision about FAI movement trajectory position. In this connection it seems of interest that all subjects pointed with great accuracy to the position of the head midline; i.e., they oriented themselves quite well within the inner coordinate system determined by the body scheme.
B. Asymmetry
It was shown that trajectories of FAI movement differed in their characteristics depending on the side ~the right or the left! where the movement occurred and on direction of FAI movement ~Figs. 3–7, Tables I, II!. These data evidence different significance of the right and left regions of subjective acoustical space in sound source localization. The data of earlier investigations performed on patients with functional deficit of the right or left hemispheres ~Altman et al., 1979, 1987! pointed to a certain specialization of the right hemisphere in relation to directional hearing. Results of the present work evidence that in healthy subjects the factor of either hemisphere involvement in moving FAI lateralization is even more distinctive. As described above, the functions relating the value of perceived position of FAI movement trajectory’s starting and ending points to IID, although rather different in different subjects ~e.g., Figs. 4–5!, were similar to each other in general tendency ~Fig. 7!. The slope of these functions ~characterized by coefficient A in equation Y 5AX1B), was different at the right- and left-sided positions of the trajectory’s starting and ending points in relation to midline ~Figs. 4–7, Table II!, and depended on coincidence or noncoincidence of the direction of trajectory shift produced by IID with direction of FAI movement. With one direction of FAI movement @Fig. 7~a!# the movement trajectory’s length also proved different to the right and to the left of midline. To reveal more distinctly the difference between the right and left hemisphere involvement in lateralization of moving FAI, the data of Fig. 7 were presented in another way, with a different axis system ~Fig. 8!. Figure 8 shows that at both directions of FAI movement the rightward shift of the trajectory starting and ending points exceeds the leftward shift. For the starting point @Fig. 8~a!# the most difference between the rightward and leftward shifts is observed for the right branches of the functions which corresponds to coincident relations between ITD and IID. Meanwhile, for the ending point @Fig. 8~b!# the most difference corresponds to competitive relations between ITD and IID ~the left branches of the functions!. These data directly show to hemispheric asymmetry, with a certain prevalence of the rightside mechanisms of moving FAI lateralization in comparison with the left-side mechanisms. Thus values of the term B ~intercept!, coefficient A ~slope!, and trajectory length evidence functional asymmetry of processes connected with lateralization of moving auditory image. 374
J. Acoust. Soc. Am., Vol. 105, No. 1, January 1999
FIG. 8. Perceived positions of the starting and ending points ~a, b, respectively! of FAI movement trajectories depending on interaural intensity differences. The data are replotted from Fig. 7. On the abscissa: IID, in dB, favoring the side from which the trajectory moved ~on the left from zero; this corresponds to competitive relation of IID and ITD! and IID, in dB, favoring the side toward which the trajectory moved ~on the right from zero; this corresponds to coincident relation of IID and ITD!. On the ordinate: perceived positions ~in degrees relative to midline! of the starting and ending points on the side toward which the trajectory moved ~above zero! and on the side from which the trajectory moved ~below zero!. Arrows near the curves show movement direction (R→L or L→R).
C. Relative effectiveness of IID and ITD in lateralization of moving FAIs
To evaluate comparative effectiveness of IID and ITD factors in lateralization of moving FAI ~under conditions when ITD was gradually changed throughout the stimulus presentation and IID was constant! the number of differential thresholds ~DTs, for IID and ITD! was calculated which was covered by IID and ITD values necessary for 1-deg lateralization of moving FAI. For the ending point ~Figs. 4–7, Table II!, when ITD50, a FAI shift of 1 deg corresponded to an IID change of about 0.31 dB on the average, with coincident relation of IID and ITD factors ~with both directions of FAI movement combined!. Assuming that the differential threshold for IID, with a click series as stimulus, is about 1.5 dB ~Blauert, 1974! we determine ~for coincident relation of IID and ITD factors! that 0.31/1.550.21; i.e., an IID equal to 0.21 DTs is needed for 1-deg lateralization of a moving FAI at ITD50. As to ITD factor, to shift the trajectory’s endpoint by 1 deg at IID50, an ITD change of 9.1 ms was needed on the average ~as stated above!. Taking the differential threshold for ITD as 11 ms ~Blauert, 1974! it can be found that 9.1 ms includes 0.83 DTs (9.1/1150.83). In comparison with IID indices this value is about four times higher: 0.83/0.21 '4.0. Thus using this method to quantify relative effectiveness, the IID is about four times more effective in lateralization of the moving FAI ~at the ending point of movement! than ITD. FAI lateralization at its starting point ~when Altman et al.: Moving auditory image
374
ITD5630 ms) shows even a greater effectiveness of the IID factor since the function relating FAI lateralization to IID value is about 1.7 times steeper for the starting point as compared to the ending point ~Fig. 7, coincident relations of IID and ITD factors!.
TABLE AI. Variability of estimation of perceived positions of trajectory starting and ending points ~measured by standard deviation, s.d., of the mean estimate, in degrees! at different ITD values.a Variability of estimation, s.d. in degrees
ACKNOWLEDGMENTS
The authors are grateful to Dr. G. L. Gerstein for his kind help with English language. Many thanks also to E. Josef and L. Zakharova for technical assistance throughout the work. We are also grateful to Dr. D. W. Grantham for critical remarks and editorial suggestions. APPENDIX: INFLUENCE OF THE TRAJECTORY’S STARTING POINT POSITION
Some results were obtained also with a different starting position, namely with FAI movement from midline to the right and left ears. Two subjects ~A, Figs. 4–6, white triangles, and V, Figs. 4–6, filled squares! were employed ~six experiments on each, with the standard procedure described in Sec. I!. Results for both subjects were rather near, and are shown in Fig. A1 for one of them. Of interest is the tendency for certain changes of the trajectory length @Fig. A1~a!, ~b!# which differ from those presented in Fig. 7 and are due to a greater steepness of the function for the ending point than for the starting one @unlike the data in Fig. 7~a!#. The feature common to that in Fig. 7 is that the function’s steepness increase ~when observed! is connected with that trajectory’s
Starting point Ending point a
near midline (ITD50 ms)
near the ears (ITD56630 ms)
3.3 3.7
9.1 10.0
Notes: Mean data for two subjects. Results obtained with different starting positions ~at ITD50, 1630, and 2630 ms! and IID50 are presented. The data for two sides of FAI movement ~to the left and to the right of midline! are combined. Each figure for ITD50 ms is the mean of 48 measurements; each figure for ITD56630 ms is the mean of 24 measurements.
characteristic @starting point as in Fig. 7~a! and ending point as in Fig. A1# which corresponds to ITD5630 ms. Accuracy of estimation ~as measured by standard deviation of the mean estimate! of the starting point position in this experiment ~at ITD50 ms) was high and near that obtained in the same subjects for the ending point with FAI movement from the ear to midline ~when ITD50 ms as well!: Mean values of standard deviation in both cases did not exceed 4 deg at IID50 dB and did not depend on movement direction or on the side ~to the left or to the right of midline! where the movement took place. It proved that ITD56630 ms ~positions near either of the ears! both for the starting and ending points resulted in nearly the same decrease in accuracy ~increase in s.d.! of the estimate. Table AI allows one to compare results for the starting and ending points at different positions of starting points of FAI movement trajectories ~at 0 and 6630 ms!. Comparing these results with those by Perrott and Musicant obtained under free field stimulation and sound source onset at midline ~1977, Fig. 2, Table II! it can be concluded, in agreement with the data by these authors, that it is position in relation to midline which determines the accuracy of estimation of perceived position of the moving FAI, both of its starting and ending points. 1
The calculation was based on estimates from the data of Table II,c indicating that average slopes of the functions relating perceived lateral positions of the unmoved FAI to IID ranged from 3.0 to 4.0 deg/dB. 2 It should be noticed that trajectory length was measured also in special experiments when subjects had to estimate both the ending and starting points; results obtained in these experiments were similar to those presented in Fig. 7.
FIG. A1. Perceived positions of starting and ending points of FAI movement trajectories with changed positions of both the starting point ~near the midline, at ITD50 ms) and of the ending point ~a: near the right ear at ITD51630 ms, b: near the left ear at ITD52630 ms), depending on interaural intensity differences. Mean data for subject A ~Figs. 4–6, white triangles!. Each point on the graphs are the means of 24 measurements ~at IID50) and of 12 measurements ~at other IID values!. Designations as in Fig. 4. 375
J. Acoust. Soc. Am., Vol. 105, No. 1, January 1999
Altman, J. A. ~1968!. ‘‘Are there neurons detecting direction of sound source motion?’’ Exp. Neurol. 22, 13–25. Altman, J. A. ~1981!. ‘‘Psychophysical and neurophysiological data on the sound source motion perception,’’ in Neural Mechanisms of Hearing, edited by J. Syka and Br. Masterton ~Plenum, New York!, pp. 289–299. Altman, J. A., and Romanov, V. P. ~1988!. ‘‘Psychophysical characteristics of the auditory image movement perception during dichotic stimulation,’’ J. Int. Neurosci. 38, 369–379. Altman, J. A., and Viskov, O. V. ~1977!. ‘‘Discrimination of perceived movement velocity for fused auditory image in dichotic stimulation,’’ J. Acoust. Soc. Am. 61, 816–819. Altman, J. A., Balonov, L. Ya., and Deglin, V. L. ~1979!. ‘‘Effects of unilateral suppression of the brain hemisphere function in man on directional hearing,’’ Neuropsychologia 17, 295–301. Altman, J. A., Rosenblum, A. S., and Lvova, V. G. ~1987!. ‘‘Lateralization Altman et al.: Moving auditory image
375
of a moving auditory image in patients with focal damages in brain hemispheres,’’ Neuropsychologia 25, 435–442. Altman, J. A., Romanov, V. P., and Shakhshayev, S. A. ~1982!. ‘‘Special features of binaural release from masking for a moving auditory image,’’ Human Physiology 8, 537–541 ~translation from Russian, Plenum Press!. Blauert, J. ~1972!. ‘‘On the lag of lateralization caused by interaural time and intensity differences,’’ Audiology 11, 265–270. Blauert, J. ~1974!. Rau¨mliches Ho¨ren ~Hirzel Verlag, Stuttgart!. Grantham, D. W. ~1995!. ‘‘Spatial hearing and related phenomena,’’ in Hearing ~Academic, New York!, Chap. 9, pp. 297–346. Grantham, D. W. ~1997!. ‘‘Auditory motion perception: Snapshots revisited,’’ in Binaural and Spatial Hearing in Real and Virtual Environments ~Elbaum, Hillsdale, NJ!, Chap. 15, pp. 295–313. Grantham, D. W., and Wightman, F. L. ~1978!. ‘‘Detectability of varying interaural temporal differences,’’ J. Acoust. Soc. Am. 63, 511–523. Hafter, E. R., and Carrier, S. C. ~1972!. ‘‘Binaural interaction in low frequency stimuli: The inability to trade time and intensity completely,’’ J. Acoust. Soc. Am. 51, 1852–1862. Harris, G. G. ~1960!. ‘‘Binaural interactions of impulsive stimuli and pure tones,’’ J. Acoust. Soc. Am. 32, 685–692. Harris, J. D. ~1972!. ‘‘A florilegium of experiments on directional hearing,’’ Acta Oto-Laryngol. Suppl. 208, 1–26.
376
J. Acoust. Soc. Am., Vol. 105, No. 1, January 1999
Mateeff, S., and Hohnbein, J. ~1988!. ‘‘Dynamic auditory localization: Perceived position of a moving sound source,’’ Acta Physiol. Pharmacol. Bulg. 14, 32–38. McKinley, R. L., Erickson, M. A., and D’Angelo, W. R. ~1994!. ‘‘3dimensional auditory displays: Development, applications, and performance,’’ Aviat., Space Environ. Med. 65, ~5 Suppl.!, A31–A38. Perrott, D. R., and Musicant, A. D. ~1977!. ‘‘Minimum auditory movement angle: Binaural localization of moving sound sources,’’ J. Acoust. Soc. Am. 62, 1463–1466. Perrott, D. R., and Musicant, A. D. ~1981!. ‘‘Dynamic minimum audible angle: Binaural spatial acuity with moving sound sources,’’ J. Aud. Res. 21, 287–295. Perrott, D. R., and Strybel, T. Z. ~1997!. ‘‘Some observations regarding motion without direction,’’ in Binaural and Spatial Hearing in Real and Virtual Environments ~Erlbaum, Hillsdale, NJ!, Chap. 14, pp. 275–294. Saberi, K., and Hafter, E. R. ~1997!. ‘‘Experiments in auditory motion discrimination,’’ in Binaural and Spatial Hearing in Real and Virtual Environments ~Erlbaum, Hillsdale, NJ!, Chap. 16, pp. 315–327. Wenzel, E. M. ~1992!. ‘‘Localization in virtual acoustic displays,’’ Presence 1, 80–106. Yost, W. A., and Hafter, E. R. ~1987!. ‘‘Lateralization,’’ in Directional Hearing, edited by W. A. Yost and G. Gourevich ~Springer-Verlag, New York!, pp. 49–84.
Altman et al.: Moving auditory image
376