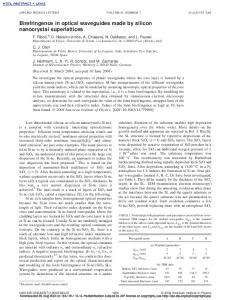
E. C. Levy and M. Horowitz
Vol. 23, No. 8 / August 2006 / J. Opt. Soc. Am. B
1531
Layer-peeling algorithm for reconstructing the birefringence in optical emulators Etgar C. Levy and Moshe Horowitz Department of Electrical Engineering, Technion–Israel Institute of Technology, Haifa 32000 Israel Received October 7, 2005; revised February 14, 2006; accepted March 13, 2006; posted March 16, 2006 (Doc. ID 65252) We present a new theoretical method, based on a layer-peeling algorithm, for extracting the spatial distribution of the birefringence parameters of an optical emulator. The method enables one to extract the spatial dependence of both the refractive index difference and the orientation angle of the birefringence axes. The layerpeeling algorithm is designed to minimize the accumulated error, and it enables one to accurately reconstruct the birefringence parameters even when a strong noise is added to the input data. © 2006 Optical Society of America OCIS codes: 060.2420, 290.3200.
1. INTRODUCTION Polarization mode dispersion (PMD) may limit the performance of high-data-rate long-distance optical communication systems.1–5 The effect is caused by intrinsic birefringence in fibers, due to a small deviation of the fiber profile from circular symmetry, inner defects, and outer stress and bends in the fiber. One of the main difficulties that may prevent the elimination of PMD is the time dependence of the effect due to changes in environmental conditions such as temperature. Fiber emulators are an important tool for studying PMD and for improving the performance of optical communication systems.6–9 Similar devices are also used to compensate PMD.10,11 The emulator is built from several short sections of polarization-maintaining (PM) fibers and elements that change the polarization between the different fiber sections. The connection between the fiber elements is often performed using rotatable connectors. The performance of emulators as well as the study of PMD, based on using optical emulators, can be improved if emulators can be fully characterized. The local beat-length distribution in a birefringent fiber is often measured using optical frequency-domain reflectometry or optical time-domain reflectometry techniques.12–17 However, such techniques give the local beat length of the fiber but not the orientation angle of the birefringence axes. The orientation of the birefringence axes can be measured using the technique described in Ref. 18. However, such a technique can be used to characterize only a single uniform fiber. Layer-peeling algorithms were previously used to extract the spatial distribution of the optical parameters of transmission systems and fiber gratings.19,20 A layer-peeling algorithm for analyzing the birefringence in fiber Bragg gratings was demonstrated in Refs. 21 and 22. However, this algorithm is suitable for extracting the birefringence only in a short system, with a few centimeters length, since the frequency dependence of the state of polarization (SOP) is neglected. In Ref. 23 a layer-peeling algorithm is used for designing a PMD compensator. The Jones matrix of the 0740-3224/06/081531-9/$15.00
compensator should be approximately equal to the inverse of the transmission Jones matrix of the optical chain that should be compensated. The compensator is made from several identical stages. The phase shifts of each stage are designed to obtain the required transmission Jones matrix. Since the birefringence parameters of a system cannot be uniquely extracted from the transmission response, this method cannot be used to find the spatial distribution of the birefringence in an unknown system. In this paper we will theoretically demonstrate a new method, to our knowledge, that enables one to extract the local birefringence and its orientation in an emulator system built from several sections of uniformly distributed birefringent fibers. The frequency dependence of the SOP of the wave reflected from the connections between the birefringent fibers is analyzed using a layer-peeling algorithm. The layer-peeling algorithm was designed to minimize the accumulated error, and therefore it could overcome a significant noise added to the input data. The technique, described in this paper, may be also important to analyze distributed sensors that are based on measuring the local birefringence of fibers. The manuscript is organized as follows. In Section 2 we describe the input data and the assumptions that are needed for our algorithm and suggest an optical system that can measure the data. In Section 3 we describe the mathematical background needed for the layer-peeling algorithm. In Section 4 we show how to reconstruct the birefringence parameters for a single uniform fiber and then derive the layer-peeling algorithm in Section 5. The results of the layer-peeling algorithm implemented over simulated emulators are given in Section 6.
2. INPUT DATA AND ASSUMPTIONS REQUIRED BY THE LAYERPEELING ALGORITHM A schematic description of an emulator that can be analyzed using the method described in this paper is shown © 2006 Optical Society of America
1532
J. Opt. Soc. Am. B / Vol. 23, No. 8 / August 2006
in Fig. 1. The emulator is built from several PM fiber sections connected to each other by rotatable connectors. A similar emulator was described in Ref. 9. We assume that the backreflected signal is mainly formed owing to discrete backreflections in the system, caused by the connections between the different fiber sections. We neglect the reflection from the fiber sections located between the connectors. This neglect can be justified, since the measurement technique required for our algorithm should have a high spatial resolution of the order of 500 m. Such a resolution can be obtained using techniques such as optical frequency-domain reflectometry.24,25 The level of the Rayleigh backscattered signal measured, using optical low-coherence reflectometry, with a spatial resolution of 32 m was about −117 dB weaker than the power of the forward-propagating light.26 Assuming a measurement with a spatial resolution of about 500 m, as used in our simulation, the Rayleigh backscattering should be approximately −105 dB weaker than the power of the incident light. The reflection from a typical FC/APC connector is about −65 dB weaker than the power of the incident light. Therefore the reflections from the connectors between the fiber sections are significantly stronger than the Rayleigh backscattering in the fiber as also measured in Refs. 27 and 28. In the case when the fibers in the emulator are connected using splices, the low level of the expected Rayleigh backscattering might also enable one to measure the reflections from the splices. The input data for our layer-peeling algorithm are the r backreflected frequency-dependent signals Ax,i 共兲 and
Fig. 1. Schematic description of the system analyzed in this paper. The system is a PMD emulator built from several PM fibers connected together using rotatable connectors. We assume that the backreflected signal is mainly formed by the connectors between the PM fibers.
E. C. Levy and M. Horowitz r Ay,i 共兲, polarized along the x and the y axes, respectively, that are returned from each of the connectors i = 1 . . . N, where is the angular frequency. Such data can be obtained by a direct expansion of measurement techniques, based on optical frequency-domain reflectometry.24,25 A tunable continuous-wave signal or a broadband source is sent along one axis, x, with an amplitude Eix共兲. The interference of the backreflected signal and a reference signal, after passing equal variable polarizers, is measured. The length of the reference arm of the interferometer is set to be similar to the location of the connector i. The reflections from the other connectors cause a highfrequency modulation of the interference signal in the frequency domain. Therefore, such signals can be filtered in the time domain, or they may be averaged owing to the limited spectral resolution of the spectral measurement. The backreflected signals from all the connectors are obtained by our changing the length of the reference arm according to the estimated locations of the connector. The length of the reference path of the interferometer can be changed by our switching between several fibers with different lengths in the reference arm. To find the SOP of the frequency-dependent backreflected signal, we need to repeat the measurement of the interference signal after it passes through a circular polarizer and through a linear polarizer rotated at angles 0° and 45° with respect to the x axis.29 A schematic description of an optical system that can be used to measure the required data, needed for our algorithm, is shown in Fig. 2. Since the reference path of the interferometer can be changed by our switching between several fibers with different lengths in the reference arm, the coherence length should be of the order of tens of centimeters. Therefore, when the measurement is performed using a tunable laser, the linewidth of the laser should be of the order of hundreds of megahertz. Since the SOP of the backreflected light should not be changed during the measurement, the birefringence should be fixed in order that the relative changes, ␦共⌬n兲 / ⌬n, will be smaller than LB / L, where LB = / ⌬n is the beat length and L is the total length of the emulator. According to Ref. 30 the relative birefringence temperature dependence of a conventional PM fiber is 0.0012 1 / K. In the case where LB = 3.1 mm and the total length is L = 100 m, the tempera-
Fig. 2. Schematic description of the proposed experimental setup. The device under test (DUT) is built from several PM fibers as described in Fig. 1. A broadband source is sent into the DUT and into a reference arm. An input polarizer is used for setting the input SOP. The backreflected signal from the DUT and a reference signal are interfered after passing two equal variable polarizers. Reflections from different connectors cause a modulation of the interference spectrum at a different periodicity. By repeating the measurement using a circular polarizer and a linear polarizer rotated at 0° and 45° with respect to the x axis, one can extract the frequency dependence of the backreflected SOP obtained from each of the connectors.
E. C. Levy and M. Horowitz
Vol. 23, No. 8 / August 2006 / J. Opt. Soc. Am. B
ture should be stabilized to about 10−3 K. Such a thermal stability can be obtained by one’s passively stabilizing the system. The measurement technique, described above, ensures that reflections from different connectors can be separated. The need to separate reflections from different connectors can be intuitively understood by one’s considering the reflected signal in the time domain. The relative delay between the two polarization components of the wave, reflected from the i connector, contains the information on the birefringence of the fiber connected between the i − 1 and the i connectors. However, if a different connector adds a reflection with a time delay of the order of the delay caused by the birefringence, it becomes impossible to separate a delay caused by a reflection from a different location and a delay caused by the birefringence. Therefore, we require there be a time separation between the reflections from different connectors.
In this section we will define the mathematical framework used in this paper. We will neglect in our analysis polarization-dependent loss and will assume fibers with a linear birefringence. Using Jones formalism, we define the SOP of a forward- or a backward-propagating wave by the normalized Jones vector: A共z, 兲 ⬅ A =
冉
Ax共z, 兲 Ay共z, 兲
冊
,
where x and y are two perpendicular axes. The propagation of the SOP, A, in a linear birefringent fiber with a local refractive index difference (RID), ⌬n = ns − nf, and local principal axes, rotated in an orientation angle with respect to the reference axes, is given in a differential form1,2:
冉
Ax共z, 兲
z Ay共z, 兲
冊
=i
冋
⌬n cos共2兲 2c
sin共2兲
sin共2兲 − cos共2兲
册冉 冊 Ax共z, 兲
Ay共z, 兲
, 共1兲
where is the angular frequency and c is the speed of light. The SOP evolves as it propagates along the fiber. After propagating through a uniform birefringent fiber with a length L, the output SOP Ao共兲 = A共z = L , 兲 becomes Ao共兲 = R−1共兲 · D共⌬兲 · R共兲 · Ai ⬅ MAi共兲,
共2兲
where A 共兲 is the SOP at the input of the fiber, ⌬ = ⌬nL / c is the time delay between light waves propagating along the two principal axes, i
R共兲 =
D共⌬兲 =
冋
冋
cos
sin
− sin
cos
册
,
exp共i⌬/2兲
0
0
exp共− i⌬/2兲
M = R−1共兲 · D共⌬兲 · R共兲,
form fiber section. Assuming that the backwardpropagating wave is reflected from the fiber end and that the reflection does not depend on the polarization, the backreflected SOP at the input of the fiber is given by31,32 Ar共兲 = Mt · M · Ai共兲.
共4兲
By substituting the propagation matrix, we obtain Ar共兲 = R−1共兲 · D2共⌬兲 · R共兲 · Ai共兲.
册
, 共3兲
where R共兲, D共⌬兲, and M are the rotation matrix, the delay matrix, and the total propagation matrix of the uni-
共5兲
It is also possible to write Eq. (1) by using the Stokes formalism,1
S共z, 兲 z
= W ⫻ S共z, 兲,
共6兲
where S is the Stokes representation of the SOP and W is the birefringence vector that represents the local birefringence, W共z, 兲 = ⌬n共z兲/c · 共cos关2共z兲兴,sin关2共z兲兴,0兲t .
3. MATHEMATICAL FRAMEWORK
1533
共7兲
The backreflection of a SOP is represented on the Poincaré sphere by a mirror symmetry with respect to the equator.15 Hence, the backreflected SOP, for a uniformly distributed fiber, described by Eq. (4), is equal to15 ˆ i共兲, Sˆr共兲 = R−1 · R−2 · R · Mr · S
共8兲
ˆ r共兲 are the Stokes representations of where Sˆi共兲 and S the input and the output SOPs, Ai共兲 and Ar共兲, respectively. The rotation matrices, R and R, and the mirror symmetry matrix, Mr, are defined by
冤
cos共2兲
冤
1
R共2兲 = − sin共2兲
0
0 ,
0
0
1
0
R 共 兲 = 0
cos共兲
0
sin共兲
冤
冥
sin共2兲 cos共2兲
0
冥
− sin共兲 , cos共兲
1
0
0
Mr = 0
1
0
0
0
−1
冥
,
and the rotation angle 共兲 is equal to
共兲 = 兩W共兲兩L =
⌬n c
L.
共9兲
Equation (8) is obtained using the commutative relations MrR = R−1Mr and MrR = RMr. The propagation of the SOP described in Eq. (6) shows that, along a uniformly distributed birefringence section, the SOP on the Poincaré sphere, S共z , 兲, rotates as a function of the location, z, around a vector W共兲 with a rotation angle 共兲. Therefore, after passing through a birefringent section, the final SOP will be different for each frequency even when the input SOP does not depend on the frequency.
1534
J. Opt. Soc. Am. B / Vol. 23, No. 8 / August 2006
E. C. Levy and M. Horowitz
4. RECONSTRUCTION OF THE BIREFRINGENCE PARAMETERS OF A UNIFORMLY DISTRIBUTED BIREFRINGENT FIBER In this section we demonstrate a new method, to our knowledge, for accurately extracting the birefringence parameters of a uniformly distributed birefringent fiber. The method presented in this section is robust and is not strongly affected by noise added to the input data. The reconstruction method will be the basis for our layer-peeling algorithm described in Section 5. We define the normalized birefringence vector: ˆ = W/兩W兩 = „cos共2兲,sin共2兲,0…t , W
共10兲
where is the orientation angle of the birefringence axes, defined in Section 3. In Eq. (10) we limit our analysis to linear birefringence fibers, and hence we assume that W共3兲 = 0. The derivative of the rotation angle, , with respect to the angular frequency , is denoted by ⬘共兲 = ⌬n / cL. For a uniform birefringent fiber section, the frequency dependence of the connection between the input and the output ˆ and SOPs defines the normalized birefringence vector W the derivative of the rotation angle ⬘共兲, as described beˆ gives the orilow. The normalized birefringence vector W entation angle , and the derivative of the rotation angle ⬘共兲 gives the RID, ⌬n, assuming that the section length L is approximately known. Using Eq. (6), we find that for a uniform birefringent ˆ 共z , 兲 does not depend fiber section the scalar product W · S on the location z for each angular frequency, . Therefore, ˆ =S ˆ o共 兲 · W ˆ , Sˆi共兲 · W
ˆ = 0, 关Sˆr共j兲 − Sˆi共j兲兴 · W
dSˆ共j兲 =
ˆ r共 兲 − Sˆi共 兲 S j j 兩Sˆr共j兲 − Sˆi共j兲兩
ˆ by A. Extracting the Normalized Birefringence Vector W Using a Least-Mean-Squares Algorithm In this subsection we will show how to extract the norˆ from the backreflected malized birefringence vector W
共13兲
,
j = 1 . . . n,
共14兲
ˆ 共 兲 and denote the vector components dS j = 共dSj,1 , dSj,2 , dSj,3兲t. Since the normalized birefringence ˆ vector has only two nontrivial components, W = 共W1 , W2 , 0兲t = „cos共2兲 , sin共2兲 , 0…t, we have n equations with only two unknown variables W1 , W2: dSj,1W1 + dSj,2W2 = 0,
j = 1 . . . n,
with the constraint W12 + W22 = 1. Using a least-mean-squares algorithm, we minimize the n 共dSj,1W1 + dSj,2W2兲2 and oberror function, f共W1 , W2兲 = 兺j=1 tain ±R W1 =
W2 =
冑共P + 兲2 + R2 ⫿共P + 兲
冑共P + 兲2 + R2
,
共15兲
,
where n
P=
兺 共dS
j,1兲
2
,
j=1
共12兲
where Sˆr = Sˆr共兲 is the Stokes representation of backreflected SOP Ar共兲. Extracting the birefringence vector, W, for a uniform fiber section is based on the rotation of Stokes vector ˆ as a function of the angular frequency S共z , 兲 around W . Since the connection given in Eq. (12) does not depend on the frequency, the extraction of the birefringence parameters can be performed using many different measured SOPs, each obtained in a different frequency. Therefore, by using methods such as a least-meansquares algorithm, it is possible to extract the birefrinˆ that fulfills Eq. (12), as described in Subgence vector W section 4.A. Such a method is robust and is insensitive to noise added to the input data.
j = 1 . . . n.
We define the vector dSˆ共j兲 as
共11兲
ˆ o共兲 is the Stokes representation of the output where S SOP. Since the reflection is represented on the Poincaré sphere by a symmetry SxOy with respect to the equator15 and W lies on the equator, we obtain ˆ =S ˆ r共 兲 · W ˆ , Sˆi共兲 · W
SOP obtained in different frequencies. Since layer-peeling algorithms are sensitive to accumulated errors, the extraction of the RID with a low error is essential. Assuming that the input SOP, Si共j兲, and the backreflected SOP, Sr共j兲, are given at n different angular frequencies j, j = 1 . . . n, Eq. (12) can be written for each frequency:
n
Q=
兺 共dS
j,2兲
2
,
j=1
n
R=
兺 共dS
j,1dSj,2兲,
j=1
± =
− 共P + Q兲 ± 冑共P − Q兲2 + 4R2 2
.
共16兲
The sign of the parameter can be found by the constraint that the error function f共W1 , W2兲 will have a miniˆ . Each mum value. Equations (15) have two solutions ±W solution gives a different sign for the RID, ⌬n. However, the extracted birefringence vector W, as defined in Eq. (7), ˆ has no physiis unique. Therefore changing the sign of W cal meaning, since it only corresponds to a different definition of the principal axes (switching between the x and the y axes) while the birefringence orientation remains the same.
E. C. Levy and M. Horowitz
Vol. 23, No. 8 / August 2006 / J. Opt. Soc. Am. B
ˆ by using a leastExtracting the birefringence vector W mean-squares algorithm gives a robust method to reconstruct the birefringence parameters in the presence of noise one-added to the input data. It also enables one to validate the assumption of a uniformly distributed fiber section by requiring that the error function be small enough. The extracted birefringence vector is directly used to find the orientation of the birefringence axes by using Eq. (10). The normalized birefringence vector will also be used to extract the RID as described in Subsection 4.B.
1535
parameter—the RID, ⌬n. To accurately extract this parameter, we define the error function g共⌬n兲: n
g共⌬n兲 =
兺 兩Sˆ
r,e
共j兲 − Sˆr共j兲兩2 .
共18兲
j=1
The RID, ⌬n, will be extracted by minimizing the error function, g共⌬n兲. According to Appendix A, the dependence of the error function on the RID is given by n
g共⌬n兲 =
兺 l 共⌬x 2 j
2 j
+ ⌬yj2兲,
共19兲
j=1
B. Extracting the Refractive Index Difference, ⌬n Equation (9) indicated that the RID, ⌬n, for a single fiber section, can be extracted by a linear fit of the rotation angle, 共兲, with respect to the frequency , assuming that the section length L is approximately known. After ˆ , is extracted, as the normalized birefringence vector, W described in Subsection 4.A, the rotation angle, 共兲 can be found from the input and the backreflected SOPs, Sˆi共兲 and Sˆr共兲, by defining the vectors V: ˆ 兴·W ˆ +S ˆ i共兲, Vi共兲 = − 关Sˆi共兲 · W ˆ 兴·W ˆ +S ˆ r共兲. Vr共兲 = − 关Sˆr共兲 · W 2
The angle 共兲 is defined as the angle between the vectors Vi共兲 and Vr共兲, assuming that the rotation of the ˆ toward the vector V 共兲 vector Vi共兲 around the vector W r is performed counterclockwise. The angle 2共兲 is equal to the modulus of the rotation angle 共兲 divided by 2. After computing the angle 2共兲 and unwrapping the result, one can extract the RID, ⌬n, by using a linear fit to Eq. (9). The unwrapping of the rotation angle 2共兲 can be performed only when the frequency resolution of the input data is sufficient. The minimum frequency resolution required to accurately calculate the RID is given by d ⬍
c 2L⌬n
共17兲
or ␦ ⬍ 2 / 4⌬nL, where L is the section length. The condition given in expression (17) ensures that the rotation angle difference between two adjacent frequencies is less than . Therefore, both the sign and the magnitude of the rotation angle can be accurately extracted. Although the reconstruction of the RID, ⌬n, by a linear fit to the rotation angle, 共兲, will give accurate results for a single fiber section, it may cause a significant error in the layer-peeling algorithm, described in Section 5. To minimize the accumulated error in a layer-peeling algorithm, it is important to minimize the error between the ˆ r,e共兲, and the measured SOP, S ˆ r共兲, extracted SOP, S rather than the error in the RID. The extracted backreflected SOP, Sˆr,e共兲, is calculated from the extracted birefringence parameters by using Eq. (8). Assuming the input SOP, Sˆi共兲 = „S1i 共兲 , S2i 共兲 , S3i 共兲…t, is known and the ˆ = 共W , W , 0兲t normalized birefringence vector, W 1 2 = „cos共2兲 , sin共2兲 , 0…t, is accurately calculated, the exˆ r,e共兲, is a function of only a single tracted SOP, S
where ˆ · Sˆi共 兲兩, lj2 = 1 − 兩W j ⌬xj2 = 兩cos共2j⌬nL/c兲 − cos关2共j兲兴兩2 , ⌬yj2 = 兩sin共2j⌬nL/c兲 − sin关2共j兲兴兩2 . To perform the fitting, we need to find the magnitude of the trigonometric functions of the rotation angle, cos关2共j兲兴 and sin关2共j兲兴, from the input and the output SOPs. Using Eq. (A2) in Appendix A we obtain
冉
cos关2共j兲兴 sin关2共j兲兴
冊
= 共LTL兲−1LT关Sˆr共j兲 − KMrSˆi共j兲兴, 共20兲
where both L = L共j兲 and K are given in Eqs. (A3) and (A4) of the appendix. The RID is then extracted by our minimizing the error function g共⌬n兲, given in Eq. (19). We note that we extract both trigonometric functions cos关2共j兲兴 and sin关2共j兲兴 and not use the trigonometric connection between the functions, since a different noise may be added to the two functions.
5. LAYER-PEELING ALGORITHM In the previous section we have shown that when the input and the backreflected SOPs of a single uniformly distributed birefringent section are given it is possible to accurately extract the birefringence parameters of the section. A PMD emulator may be implemented by using N different uniformly distributed birefringent sections connected by rotatable connectors.9 Since the input and the backreflected polarization components are known only at the input end of the fiber, the SOP should be propagated along the fiber, in order to use the method for extracting the birefringence parameters, described in the previous section. Owing to causality of the system, the SOP in the input of the ith fiber section can be calculated from the input SOP of the emulator by using only the parameters of the fiber sections j = 1 , . . . , i − 1, where i = 1 denotes the fiber section that is connected to the input end of the emulator. The propagation of the fields is the basis for our layer-peeling algorithm. In Section 2 we have discussed the assumptions of our layer-peeling algorithm. The main assumptions were that backreflections are obtained only from the connections between the different fiber sections and that the measurement technique of the backreflected SOP can separate the reflections obtained from different connectors. We also
1536
J. Opt. Soc. Am. B / Vol. 23, No. 8 / August 2006
E. C. Levy and M. Horowitz
need to assume that multiple reflections can be neglected. These assumptions are almost always obeyed, since the reflections from the connectors are low, of the order of −60 dB weaker than the intensity of the forwardpropagating signal. The propagation of the backreflected SOP Air from the ith connector is calculated using Eq. (4): Air = 共Mi · Mi−1 · . . . · M1兲t共Mi · Mi−1 · . . . · M1兲 · Ai , 共21兲 where Mi is the propagation matrix of the ith section. To use the extraction method, described in the previous section, we need to obtain from Eq. (21) an equation similar to Eq. (5). Using Eqs. (3), we obtain ˜ r = R−1 · D2 · R · A ˜ i, A i i i i i
共22兲
i ˜ r = 共M ˜ t 兲−1 · Ar , A ˜ i=M ˜ ˜ where A i−1 · Ai and Mi is the propai i−1 i i gation matrix given by
˜ = M · ... · M , M i i 1
共23兲
˜ = I is the identity matrix. where M 0 Equation (22) is similar to Eq. (5), and therefore we can extract the birefringence parameters of the ith section, ⌬ni, and i, as described in Section 4. The extracted parameters of the ith section are then used to calculate the ˜ from the matrix M ˜ matrix M i i−1 by using Eq. (23). We will discuss the frequency resolution and the bandwidth that are needed for our layer-peeling algorithm. The first resolution criterion results from the requirement to accurately unwrap the rotation angle 2共兲. Expression (17) gives
␦ ⬍ /4⌬nLmax , 2
共24兲
where ␦ is the wavelength resolution and Lmax is the longest section length. For example, for Lmax = 10 m, = 1550 nm, and ⌬n = 5 ⫻ 10−4, as used in our simulated emulator in Section 6, the wavelength resolution, ␦, should be smaller than 0.12 nm. The minimum bandwidth that is required to measure the SOP results from the fitting algorithm of the RID, described in Section 4. The RID is obtained by our fitting the trigonometric functions cos共2兲 and sin共2兲 to trigonometric functions calculated using RID, in order to minimize the error function g共⌬n兲. To obtain accurate results in the presence of noise added to the input data, we need the overall rotation angle difference, 共max兲 − 共min兲, to be greater than an angle ⌬min. Therefore we require that ⌬ ⬎ 2⌬min/4⌬nLmin ,
共25兲
where Lmin is the shortest section length. The magnitude of ⌬min depends on the signal-to-noise (S/N) ratio in the input data. In our simulation, as described in Section 6, we have found out that, for the S/N ratio of 13 dB, ⌬min is approximately equal to 4. Assuming that Lmin = 4.6 m, = 1550 nm, ⌬n = 5 ⫻ 10−4, and ⌬min = 4, as in our simulated emulator, the wavelength bandwidth ⌬ should be greater than 1.05 nm. The minimum resolution and the minimum bandwidth, given in expressions (24) and (25), enable one theoretically to extract the birefringence parameters from only a
few measurements. However, as explained in Section 6, when noise is added to the input data, an increase in the number of measurements will result in a better accuracy in the reconstruction. Therefore, in the presence of noise, the resolution and the bandwidth should be better than the theoretical limits. Theoretically, a single broadband measurement of the frequency dependence of the backreflected SOP can be used to find the reflections from all the interfaces between the different fibers in the emulator. Assuming that the transfer function of the spectrum measurement is a Gaussian function with a full width at half-maximum (FWHM) of ␦, the maximum emulator length that can be measured using low-coherence interferometry is equal to zmax = 2 ln共2兲02 / n␦.25 Assuming a measurement with a high-frequency resolution of 0.001 nm, the maximum emulator length that can be interrogated is only about 100 cm. In a more practical system, the frequency resolution is significantly lower, and the system will be able to measure the reflection only from a single or several connectors that are located at a distance close to that of the length of the reference arm of the interferometer. The reflections from the other connectors will be averaged to zero. For example, assuming a spectrum analyzer with a Gaussian transfer function with a FWHM of ␦, the backreflection from a connector located at a distance z + L, where L is the length of the reference arm of the interferometer, is attenuated by a factor
冋 冉 冊册
h共z兲 = exp −
1
n␦z
ln 2
202
2
.
Assuming that ␦ = 0.01 nm, the backreflection from a distance difference z = 50 cm is equal to 8.6⫻ 10−16. Therefore, the effect of a connector located at this distance on the measurement is negligible. To measure the reflection from all the connectors, the measurement should be repeated for several different lengths of the reference arm, as explained in Section 2.
6. SIMULATION RESULTS We demonstrate our method to analyze two emulators that are built from several sections of PM fibers with unknown orientation angles and RIDs. We first demonstrate our algorithm to extract the birefringence parameters of a PMD emulator with rotatable connectors located between PM fibers with the same RID. The PM fibers are rotated at different angles. The emulator parameters were the same as used in Ref. 9. The emulator is built from 15 sections of PM fibers with lengths 5.1, 6.8, 8.6, 7.4, 6.3, 6.7, 10.0, 8.6, 5.4, 7.2, 6.9, 7.1, 6.1, 7.4, and 4.6 m. Each fiber section had a beat length of 3.1 mm 共⌬n = 5 ⫻ 10−4兲. The relative angles between the sections were chosen arbitrarily. In our simulation, we assumed that the central wavelength is equal to = 1550 nm, the bandwidth is equal to ⌬ = 3 nm, and the spectral resolution is equal to ␦ = 0.01 nm. Figure 3 shows the simulated backreflected SOP from the first, the second, and the 15th sections. The figure shows that the time-dependent reflection function becomes more complicated as the wave propagates through a longer distance in the emulator. Therefore,
E. C. Levy and M. Horowitz
Vol. 23, No. 8 / August 2006 / J. Opt. Soc. Am. B
1537
structed. Since noise was added to the input data, the resolution and the bandwidth used in our example were better than the theoretical limits, given in expressions (24) and (25), that were equal to 0.12 and 1.05 nm, respectively. Using the theoretical limits, the errors in the extracted parameters ⌬n and were 1.5% and 10%, respectively. With a resolution of 0.01 nm and a bandwidth of 3 nm, the errors in the extracted parameters ⌬n and were reduced to 0.5% and 1%, respectively. We also checked our layer-peeling algorithm for analyzing an emulator built from fiber sections with the same length but with a different beat length and a different rotation angle for each of the fiber sections. A Gaussian noise of −13 dB STD with respect to the peak of the back reflected signal amplitude was added to the input results. The bandwidth and the resolution were the same as in the former example. Figures 6 and 7 show the results of the layer-peeling algorithm. The figures show again that both the birefringence angle and the RID could be accurately reconstructed. Although theoretically the error function g共⌬n兲, defined in Eq. (19), should be minimized to obtain the most accurate results, we have found that it is sufficient to mini-
Fig. 3. Backreflected SOP formed by a reflection from the (a) first connector, (b) second connector, and (c) 15th connector of an emulator as a function of time after a wave passes through a polarizer aligned along the x (solid curve) and the y (dashed curve) axes. Each fiber section in the emulator had a RID of ⌬n = 5 ⫻ 10−4. The first, second, and the 15th connectors are located 5.1, 11.9, and 104.2 m from the input end of the emulator, respectively. The SOP was sampled with a bandwidth of 3 nm and a resolution of 0.01 nm.
there is a need to propagate the fields in order to extract the birefringence parameters. We note that, since we neglect polarization-dependent loss in the emulator, the attenuation in the fibers and the loss in the connectors do not change the backreflected SOP. Therefore, the effect of losses in the emulator on the calculations can be avoided by our normalizing the backreflected wave intensity. To demonstrate the stability of our algorithm against noise, we added to each backreflected signal a white Gaussian noise with a −13 dB standard deviation (STD) with respect to the peak of the backreflected signal. Figures 4 and 5 show the results of the layer-peeling algorithm that are compared with the original parameters of the fiber chain. The figures show that both the birefringence angle and the RID could be accurately recon-
Fig. 4. Comparison between the RID, ⌬n, reconstructed using a layer-peeling algorithm (dashed black line) and the original RID (solid gray line) for a PMD emulator with a total length of 104.2 m built from 15 PM fibers with the same RID and with different lengths, as used in Ref. 9. The reflection spectrum was sampled with a bandwidth of 3 nm and a resolution of 0.01 nm. Noise with a STD of −13 dB with respect to the peak of the backreflected signal amplitude was added to the input data. The error in the extracted ⌬n is less than 0.5%.
Fig. 5. Absolute value of the orientation angle, 兩兩, reconstructed using a layer-peeling algorithm (dashed black curve) compared with the original 兩兩 (solid gray curve) for a PMD emulator analyzed in Fig. 4. The reflection spectrum was sampled with a bandwidth of 3 nm and a resolution of 0.01 nm. Noise with a STD of −13 dB with respect to the peak of the backreflected signal amplitude was added to the input data. The error in the extracted angle 兩兩 is less than 1%.
1538
J. Opt. Soc. Am. B / Vol. 23, No. 8 / August 2006
Fig. 6. Comparison between the RID, ⌬n, reconstructed using a layer-peeling algorithm (dashed black curve) and the original RID (solid gray curve) for a PMD emulator with a total length of 104.2 m built from 15 PM fibers rotated at different angles. The reflection spectrum was sampled with a bandwidth of 3 nm and a resolution of 0.01 nm. Noise with a STD of −13 dB with respect to the peak of the backreflected signal amplitude was added to the input data. The error in the extracted ⌬n is less than 0.5%.
E. C. Levy and M. Horowitz
the previous iterations of the algorithm. The algorithm was designed to minimize the accumulated error, and therefore it could overcome a significant noise added to the input data. A description of a system that can be used to measure the input data required by the algorithm, as well as an analyze of the bandwidth and the resolution that are required from such a system, was given. The method, described in this paper, may be important to analyze PMD emulators and PMD compensators as well as to analyze distributed sensors that are based on measuring the local birefringence in fibers.
APPENDIX A: REFRACTIVE-INDEXDIFFERENCE ERROR FUNCTION G„⌬N… In this appendix we calculate the dependence of the error n 兩 Sˆr,e共j兲 − Sˆr共j兲兩2 on the RID. Given function g共⌬n兲 = 兺j=1 i the initial SOP, Sˆ 共j兲, and the normalized birefringence ˆ , it is possible to extract the calculated SOP, vector, W ˆSr,e共 兲, as a function of the RID, ⌬n, by using Eq. (8), j Sˆr,e共j兲 = L
冉
cos共2j⌬nL/c兲 sin共2j⌬nL/c兲
冊
+ KMrSˆi共j兲,
共A1兲
ˆ r共 兲 as a function of the rotation and the measured SOP S j angle 共j兲, Fig. 7. Absolute value of the orientation angle, 兩兩, reconstructed using a layer-peeling algorithm (dashed black curve) compared with the original 兩兩 (solid gray curve) for a PMD emulator analyzed in Fig. 6. The reflection spectrum was sampled with a bandwidth of 3 nm and a resolution of 0.01 nm. Noise with a STD of −13 dB with respect to the peak of the backreflected signal amplitude was added to the input data. The error in the extracted angle 兩兩 is less than 1%.
ˆ r共 兲 = L S j
sin关2j共j兲兴
冊
+ KMrSˆi共j兲,
冤
W22S1i − W1W2S2i
W2S3i
i 2 i L = − W 1W 2S 1 + W 1S 2
−
冤
− W1Si2
S3i
W2S1i
W12
W 1W 2 W22
K = W 1W 2
共A2兲
0
0
−
0
W1S2i
冥
共A3兲
,
冥
共A4兲
0 . 0
By substituting Eqs. (A1) and (A2) into Eq. (18), we obtain
7. CONCLUSIONS We have demonstrated a new method, based on a layerpeeling algorithm, that enables us to extract, for the first time to our knowledge, the RID and the orientation angle in an emulator built from several sections of uniformly distributed birefringent fibers. The frequency dependence of the SOP of the wave reflected from the connections between the birefringent fibers is analyzed using a layerpeeling algorithm. The layer-peeling algorithm is an iterative algorithm that is based on the causality of the interrogated system. The birefringence parameters along the emulator are extracted by propagating the input fields, using the birefringence parameters extracted in
cos关2j共j兲兴
where the matrices L = L共j兲 and K = K共j兲 are equal to
n 2 gcos共⌬n兲 = 兺j=1 lj ⌬xj2
mize one of the error functions: or n 2 lj ⌬yj2. Such a minimization reduces signifigsin共⌬n兲 = 兺j=1 cantly the required computation time without significantly reducing the accuracy of the calculations, compared with minimizing the accurate error function, given in Eq. (19). An initial guess for the fitting algorithm was taken by a linear fitting of the rotation angle and extracting the RID from it as explained in Subsection 4.B.
冉
n
g共⌬n兲 =
兺 j=1
冏冉 L
cos共2j⌬nL/c兲 − cos关2j共j兲兴 sin共2j⌬nL/c兲 − sin关2j共j兲兴
冊冏
2
.
Using Eq. (A3) and the relations for the components of the 2 2 2 2 2 2 ˆ · Sˆi共 兲兩 + L21 + L31 = L12 + L22 + L32 = 1 − 兩W matrix L , L11 j and L11L22 + L21L22 + L31L32 = 0, we obtain n
g共⌬n兲 =
兺 l 共⌬x 2 j
j=1
where
2 j
+ ⌬yj2兲,
E. C. Levy and M. Horowitz
Vol. 23, No. 8 / August 2006 / J. Opt. Soc. Am. B
ˆ · Sˆi共 兲兩, lj2 = 1 − 兩W j ⌬xj2 = 兩cos共2j⌬nL/c兲 − cos关2共j兲兴兩2 ,
15.
⌬yj2 = 兩sin共2j⌬nL/c兲 − sin关2共j兲兴兩2 . This work was supported by the Israel Science Foundation of the Israeli Academy of Sciences. The authors may be reached by e-mail as follows: Etgar Levy, etgarlevy @gmail.com; Moshe Horowitz,
[email protected].
REFERENCES 1.
2.
3. 4.
5. 6.
7.
8.
9.
10.
11.
12.
13. 14.
P. K. A. Wai and C. R. Menyuk, “Polarization mode dispersion, decorrelation and diffusion in optical fibers with randomly varying birefringence,” J. Lightwave Technol. 14, 148–157 (1996). D. Marcuse, C. R. Menyuk, and P. K. A. Wai, “Application of the Manakov–PMD equation to studies of signal propagation in optical fibers with randomly varying birefringence,” J. Lightwave Technol. 15, 1735–1746 (1997). G. Foschini and C. D. Poole, “Statistical theory of polarization dispersion in single mode fibers,” J. Lightwave Technol. 9, 1439–1456 (1991). P. Ciprut, B. Gisin, N. Gisin, R. Passy, J. Von der Weid, F. Prieto, and C. Zimmer, “Second-order polarization mode dispersion: impact on analog and digital transmissions,” J. Lightwave Technol. 16, 757–771 (1998). G. Foschini, R. Jopson, L. Nelson, and H. Kogelnik, “The statistics of PMD-induced chromatic fiber dispersion,” J. Lightwave Technol. 17, 1560–1565 (1999). C. H. Prola, J. A. Pereira da Silva, A. O. Dal Forno, R. Passy, J. P. von der Weid, and N. Gisin, “PMD emulators and signal distortion in 2.48-Gb/s IM-DD lightwave systems,” IEEE Photon. Technol. Lett. 9, 842–844 (1997). A. O. Dal Forno, A. Paradisi, R. Passy, and J. P. von der Weid, “Experimental and theoretical modeling of polarization-mode dispersion in single-mode fibers,” IEEE Photon. Technol. Lett. 12, 296–298 (2000). I. T. Lima, R. Khosravani, P. Ebrahimi, E. Ibragimov, C. R. Menyuk, and A. E. Willner, “Comparison of polarization mode dispersion emulators,” J. Lightwave Technol. 19, 1872–1881 (2001). R. Khosravani, T. Lima, P. Ebrahimi, E. Ibragimov, A. E. Willner, and C. R. Menyuk, “Time and frequency domain characteristics of polarization-mode dispersion emulators,” IEEE Photon. Technol. Lett. 13, 127–129 (2001). R. Noé, D. Sandel, M. Yoshida-Dierolf, S. Hinz, V. Mirvoda, A. Schöpflin, C. Glingener, E. Gottwald, C. Scheerer, G. Fischer, T. Weyrauch, and W. Haase, “Polarization mode dispersion compensation at 10, 20, and 40 Gb/ s with various optical equalizers,” J. Lightwave Technol. 17, 1602–1615 (1999). H. Bülow, “PMD mitigation techniques and their effectiveness in installed fiber,” in Optical Fiber Communications Conference (OFC), Vol. 37 of OSA Trends in Optics and Photonics Series (Optical Society of America, 2000), pp. 110–112. F. Corsi, A. Galtarossa, and L. Palmieri, “Beat length characterization based on backscattering analysis in randomly perturbed single-mode fibers,” J. Lightwave Technol. 17, 1172–1178 (1999). A. Galtarossa, L. Palmieri, M. Schiano, and T. Tambosso, “Measurements of beat length and perturbation length in long single-mode fibers,” Opt. Lett. 25, 364–386 (2000). A. Galtarossa, L. Palmieri, A. Pizzinat, M. Sachiano, and T.
16.
17.
18.
19. 20.
21.
22. 23.
24. 25. 26.
27.
28.
29. 30.
31.
32.
1539
Tambosso, “Measurements of local beat length and differential group delay in installed single-mode fibers,” J. Lightwave Technol. 18, 1389–1394 (2000). B. Huttner, J. Reecht, N. Gisin, R. Passy, and J. P. von der Weid, “Local birefringence measurements in single-mode fibers with coherent optical Frequency-domain reflectometry,” IEEE Photon. Technol. Lett. 10, 1458–1460 (1998). M. Wegmuller, M. Legre, and N. Gisin, “Analysis of the polarization evolution in a ribbon cable using highresolution coherent OFDR,” IEEE Photon. Technol. Lett. 13, 145–147 (2001). M. Wegmuller, M. Legre, and N. Gisin, “Distributed beatlength measurement in single-mode fibers with optical frequency-domain reflectometry,” IEEE Photon. Technol. Lett. 20, 828–835 (2002). M. Yoshida, T. Miyamoto, N. Zou, K. Nakamura, and H. Ito, “Novel PMD measurement method based on OFDR using a frequency-shifted feedback fiber laser,” Opt. Express 9, 207–211 (2001). A. M. Bruckstein, B. C. Levy, and T. Kailath, “Differential methods in inverse scattering,” SIAM J. Appl. Math. 45, 312–335 (1985). A. Rosenthal and M. Horowitz, “Inverse scattering algorithm for reconstructing strongly reflecting fiber Bragg gratings,” IEEE J. Quantum Electron. 39, 1018–1026 (2003). D. Sandel, R. Noe, G. Heise, and B. Borchert, “Optical network analysis and longitudinal structure characterization of fiber Bragg grating,” J. Lightwave Technol. 116, 2435–2442 (1998). O. H. Waagaard and J. Skaar, “Synthesis of birefringent reflective grating,” J. Opt. Soc. Am. A 21, 1207–1220 (2004). D. Sandel, V. Mirvoda, S. Bhandare, F. Wust, and R. No, “Some enabling techniques for polarization mode dispersion compensation,” J. Lightwave Technol. 21, 1198–1210 (2003). J. E. Román, M. Y. Frankel, and R. D. Esman, “Spectral characterization of fiber gratings with high resolution,” Opt. Lett. 23, 939–941 (1998). S. Keren and M. Horowitz, “Interrogation of fiber gratings by use of low-coherence spectral interferometry of noiselike pulses,” Opt. Lett. 26, 328–330 (2001). W. V. Sorin and D. M. Baney, “Measurement of Rayleigh backscattering at 1.55 m with 32 m spatial resolution,” in Instruments and Photonics Laboratory, Tech. Rpt. HPL91-180 (Hewlett-Packard Laboratories, 1991). R. Passy, N. Gisin, and J. P. Von der Weid, “Highsensitivity-coherent optical frequency-domain reflectometry for characterization of fiber-optic network components,” IEEE Photon. Technol. Lett. 7, 667–669 (1995). K. Tsuji, K. Shimizu, T. Horiguchi, and Y. Koyamada, “Coherent optical frequency domain reflectometry for a long single-mode optical fiber using a coherent lightwave source and an external phase modulator,” IEEE Photon. Technol. Lett. 7, 804–806 (1995). E. Hecht, “Polarization,” in Optics (Addison Wesley Longman, 1998), pp. 319–376. C. L. Zhao, X. Yang, C. Lu, W. Jin, and M. S. Demokan, “Temperature-insensitive interferometer using a highly birefringent photonic crystal fiber loop mirror,” IEEE Photon. Technol. Lett. 16, 2535–2537 (2004). E. Brinkmeyer, “Forward–backward transmission in birefringent single-mode fibers: interpretation of polarization-sensitive measurements,” Opt. Lett. 6, 575–577 (1981). Y. Zhao, B. Wang, and Q. Tang, “Jones matrix for roundtrip wave propagation in nonreciprocal media,” Appl. Opt. 31, 4471–4473 (1992).