This paper was presented at AADEBUG’93, the first international workshop on Automated and Algorithmic Debugging. It may be found in: Peter Fritzson, editor, Automated and Algorithmic Debugging, pp. 117–134, LNCS 749, Springer-Verlag, 1993
Lazy Algorithmic Debugging: Ideas for Practical Implementation Henrik Nilsson and Peter Fritzson Programming Environments Laboratory Department of Computer and Information Science Linköping University, S-581 83 Linköping, Sweden E-mail:
[email protected],
[email protected]
Abstract. Lazy functional languages have non-strict semantics and are purely declarative, i.e. they support the notion of referential transparency and are devoid of side effects. Traditional debugging techniques are, however, not suited for lazy functional languages since computations generally do not take place in the order one might expect. Since algorithmic debugging allows the user to concentrate on the declarative aspects of program semantics, and will semi-automatically find functions containing bugs, we propose to use this technique for debugging lazy functional programs. Our earlier work showed that this is a promising approach. However, the current version of our debugger has severe implementational problems, e.g. too large trace size and too many questions asked. This paper suggests a number of techniques for overcoming these problems, at least partially. The key techniques are immediate strictification and piecemeal tracing.
1
Introduction
Debugging has always been a costly part of software development, and several attempts have been made to provide automatic computer support for this task [14]. The algorithmic debugging technique, introduced by Shapiro [16], was the first attempt to lay a theoretical framework for program debugging and to take this as a basis for a partly automatic debugger. Algorithmic debugging is a two phase process: an execution trace tree is built at the procedure/function level during the first (trace) phase. This tree is then traversed during the second (debugging) phase. Each node in the tree corresponds to an invocation of a procedure or function and holds a record of supplied arguments and returned results. Once built, the debugger basically traverses the tree in a top-down manner, asking, for each encountered node, whether the recorded procedure or function invocation is correct or not. If not, the debugger will continue with the child nodes, otherwise with the next sibling. A bug has been found when an erroneous application node is identified where all children (if any) behaved correctly. Algorithmic debugging was first developed in the context of Prolog. In previous research by our group, the algorithmic debugging method has been generalized to a class of imperative languages and its bug finding properties improved by integrating the method with program slicing [15][4][8][7].
Within the field of lazy functional programming, the lack of suitable debugging tools has been apparent for quite some time. We feel that traditional debugging techniques (e.g. breakpoints, tracing, variable watching etc.) are not particularly well suited for the class of lazy languages since computations in a program generally do not take place in the order one might expect from reading the source code [3]. Algorithmic debugging, however, allows a user to concentrate on the declarative semantics of an application program, rather than its operational aspects such as evaluation order. During debugging, the user only has to decide whether or not a particular function applied to some specific arguments yields a correct result. Given correct answers from the user, the debugger will determine which function that contains the bug. Thus, the user need not worry about why and when a function is invoked, which suggests that algorithmic debugging might be a suitable basis for a debugging tool for lazy functional languages. Obviously, there must be a visible bug symptom for this technique to work. In our previous work [12], support for algorithmic debugging was added to an existing compiler for a small lazy functional language and an algorithmic debugger was implemented. The language, called Freja [11], is essentially a subset of Miranda1 [18]. It is based on graph reduction and implemented using a G-machine approach [1][2][5][6][13]. The system was successfully applied to a number of small examples, thus showing the relevance of algorithmic debugging for lazy functional programming. However, as we gained experience from using the system, a number of problems became apparent. Firstly, storing the complete trace is impractical for any but the smallest of problems. Secondly, the number of questions asked by the debugger for realistic programs are too large. Finally, the questions asked were often big and complex, involving large data structures and unevaluated expressions. In order to alleviate the last problem, a technique which we term strictification was introduced. This technique is concerned with hiding the lazy evaluation order, thus giving the user an as strict impression of lazy execution as possible. This reduces the number of unevaluated expressions involved in questions posed to the user which tends to make them easier to understand and answer. This leaves the first two, rather severe, problems. We don’t believe that an algorithmic debugger will be practically usable unless they are addressed in a satisfactory manner. Thus, in this paper, we outline a number of possible approaches for overcoming these problems, at least to some extent. We are only aware of two other algorithmic debuggers for lazy functional languages, both inspired by our earlier efforts and developed at the University of Melbourne, Australia. The first is for a functional language which is implemented by transformation into Prolog. The debugger itself is also written in Prolog [10]. The other is an attempt to implement a debugger similar to ours but in a more systematic way within a general monitoring framework[17][9]. However, within that framework, strictification seems to be difficult to implement. The rest of this paper is organized as follows. First, the need for special “lazy” debugging tools is justified in section 2. Lazy algorithmic debugging and strictification 1. Miranda is a trademark of Research Software Ltd.
is then described in section 3. In section 4 the current implementation and its problems are overviewed. Sections 5 presents a number of ideas to alleviate these problems and in section 6 conclusions are given.
2
The Need for Lazy Debugging Tools
Consider the following functional program, where foo is a function that clearly must not be applied to the empty list: foo xs = 0, if hd xs < 0 = hd xs, otherwise; fie xs = (foo xs):fie (tl xs); main = fie [-1]; The problem is that there is no termination condition in the recursive function fie, which means that fie eventually will apply foo to the empty list since main applies fie to the finite list [-1]. Suppose that we have strict semantics. Then we would get an execution trace tree as shown in Fig. 1. main ⇒⊥ fie [-1]⇒⊥ foo [-1]⇒0 hd [-1]⇒-1
tl [-1]⇒[]
fie []⇒⊥ foo []⇒⊥ hd []⇒⊥
Fig. 1. Strict execution trace tree after run-time error.
In the rightmost branch, we see how the application of hd to the empty list provoked a run-time error, represented by the symbol ⊥ (“bottom”). At this point, we simply have to follow the edges from the leaf node towards the root, which in practice is easily achieved by inspecting the run-time stack, in order to find out that the problem is that fie has applied foo to []. Now suppose that we had had lazy semantics instead. We would then get an execution tree as shown in Fig. 2. Applying the same technique as above to this tree would not give any insight as to what the problem might be: foo is applied to an expression that will evaluate to the empty list, that is for sure, but which function applied foo to that expression? There is no recollection of this in any of the execution tree records on the path from the node that caused the error to the root node, which are the only records available to a conventional debugger in the form of the run-time stack.
main ⇒⊥
foo [-1]⇒0 fie [-1]⇒ foo [-1]: fie (tl [-1])
fie (tl [-1])⇒ foo (tl [-1])⇒⊥ foo (tl [-1]): fie (tl (tl [-1]))
hd [-1]⇒-1
hd (tl [-1])⇒⊥
Fig. 2. Lazy execution trace tree after run-time error.
The presence of (partially) evaluated expressions in the lazy execution tree should also be noted. In general, these may become very large and complicated, even if they only denote very simple values, thus making it even harder for a user to get a clear understanding of what is going on. We could also try to do a conventional trace on the lazy execution: Entering fie: xs = [-1] Leaving fie, result is: (foo [-1]):(fie (tl [-1])) Entering foo: xs = [-1] ... Apparently, fie did not call foo! This behaviour is probably not in agreement with the programmer’s mental model of the execution process, and it is at least not obvious from reading the source code. In any case, lazy evaluation permits the programmer to largely forget about evaluation order, so there is a strong case for not bothering him with it during debugging. To sum up, debugging of lazy functional programs is made difficult by delayed evaluation, counter-intuitive evaluation order and partially evaluated expressions. Because of this, traditional debugging tools and techniques are of little or no use. Hence “lazy” debugging tools, that address the above mentioned problems and that conceptually fit into a lazy framework, are needed.
3
Lazy Algorithmic Debugging
In this section, we describe how algorithmic debugging may be applied to programs written in lazy functional languages. The reasons that algorithmic debugging is interesting in the context of lazy functional languages are that it frees the user from concerns regarding evaluation order, lets him concentrate on the declarative aspects of the program and that it semi-automatically will locate the erroneous function.
3.1
The Basic Approach
Basic algorithmic debugging [16] may readily be used for lazy functional languages since functions are side-effect-free. We do have to regard the execution environment of a function as belonging to its input parameters, though, since a function may contain references to free variables. However, while gaining experience in using the debugger, the fact that arguments to functions in general are partially evaluated expressions soon proved to be a major problem: the user is usually concerned with the values that these expressions represent, details of the inner workings of the underlying evaluation machinery is often of little or no interest. Furthermore, the questions that the debugger asked were frequently textually very large and difficult to interpret [12]. This suggests that we should replace unevaluated expressions by the values they represent, wherever possible, in order to give the user an impression of strict evaluation, which probably is closer to the user’s mental model of the evaluation process anyway. We will refer to technique of giving an impression of strict evaluation (if possible) as strictification from now on. However, Strictification is, as illustrated in the following subsection, not as straight forward as it first might appear: not only must values be substituted for expressions wherever possible, but the actual structure of the execution tree has to be changed as well. Otherwise, there is no longer any guarantee that the bug will be found. 3.2
Why Substitution of Values for Expressions Is Not Enough
Suppose that strictification was implemented in the obvious way, i.e. before asking whether a function application yielded a correct result or not, any unevaluated expressions that occur in the arguments or in the result of the application are replaced by the results of evaluating the expressions in case they are known to the debugger (i.e. were needed at some point during the execution). This of course has to be done recursively should the results themselves contain any unevaluated subexpressions1. The user will then see a version of the function application which is as strict as possible given a particular execution trace. Unfortunately, the debugging algorithm is then no longer guaranteed to find the bug, as illustrated below (the function add is incorrect). dbl x = add x x; add x y = x * y; 1. This could also be implemented in a more efficient way by keeping pointers from the execution tree to the graph representation of the unevaluated expressions. Due to the nature of graph reduction, these pointers would at the end of the execution refer to graphs representing the expressions in their most evaluated form, which is the most we can hope for under lazy evaluation unless we are going to change the semantics of the language by forcing further evaluation, something a debugger should not do and that could change a terminating program into a non-terminating one.
main = dbl 3; If no strictification is performed, evaluating main would yield an execution tree as depicted in Fig. 3. The debugger quickly concludes that the bug must be in the function add since applying add to 3 and 3 yields something erroneous and since that node has no children.
main⇒9
dbl 3⇒add 3 3
add 3 3⇒3*3
3*3⇒9
main ⇒ 9 >no dbl 3 ⇒ add 3 3 >yes add 3 3 ⇒ 3 * 3 >no Bug located in function “add”.
Fig. 3. Lazy execution trace tree.
Now, suppose that we did substitute values for expression wherever possible in the tree above and then tried to do algorithmic debugging. The result is shown in Fig. 4. When asked whether main should evaluate to 9 the user answers no and the debugger proceeds to the first child node and asks whether dbl 3 should evaluate to 9 or not. Since the intention is that dbl should double its argument the user again answers no. Now, since this node has no children, the debugger will come to the conclusion that the bug is within the function dbl, which is wrong. main⇒9
dbl 3⇒9
add 3 3⇒9
3*3⇒9
main ⇒ 9 >no dbl 3 ⇒ 9 >no Bug located in function “dbl”.
Fig. 4. Incorrectly strictified execution trace tree.
The problem is that in doing the substitutions (in this case first substituting 3*3 for add 3 3 and then 9 for 3*3) we are effectively pretending that these computations take place at an earlier point in time than is actually the case, but this is not reflected in structure of the execution tree. A correctly strictified tree and the resulting debugging interaction may be seen in Fig. 5. Note how the nodes involved in the substitution have become child and grand child of the dbl 3 node. 3.3
Correct Strictification
A correct way of doing strictification can be derived from the following two observations:
main⇒9 dbl 3⇒9 add 3 3⇒9 3*3⇒9
main ⇒ 9 >no dbl 3 ⇒ 9 >no add 3 3 ⇒ 9 >no 3*3⇒9 >yes Bug located in function “add”.
Fig. 5. Correctly strictified execution trace tree.
• Performing a substitution of a result for an expression in one of the arguments of a function application, corresponds to evaluation of the expression in question before entering the function (precisely what happens in a strict language). Thus, a new node should be inserted in the execution tree to the left of the node corresponding to the function application. • Performing a substitution of a result for an expression in the result of a function application, corresponds to evaluation of the expression in question during the invocation of the function (again as in a strict language). Thus, the node corresponding to the function application should be given a new child (inserting it to the right of its siblings will do). These transformations should be applied recursively, i.e. the new nodes must themselves be strictified. The process is depicted in Fig. 6 for a simple case. Grey nodes represent computations that have taken place elsewhere, e1, e2 and e3 are expressions. However, there is no need to actually perform these transformations on the execution tree; it is sufficient to ask the questions during the debugging phase in such an order as if the transformation had been performed. This is how strictification is implemented in the current debugger.
4
The Current LADT System
In this section we will give a brief overview of the current system, LADT (Lazy Algorithmic Debugging Tool). The main features of LADT are outlined and the major problems with the current implementation are discussed.
n1
f e1 e2 ⇒ e3
n2
n3
n5
e1⇒a
n4
e2⇒b e3⇒c n1
n2
e1⇒a
f a b ⇒ c
e2⇒b
n3
n4
n5
e3⇒c
Fig. 6. Correct strictification.
4.1
Main Features
LADT is written in C and presently runs on Sun SPARC stations. It consists of two major parts: routines that perform the tracing and build the execution trace tree, and routines that perform the actual debugging. The whole debugger is linked with the code output by the Freja compiler, thus forming a single executable. As mentioned above, strictification is currently performed during the debugging phase, i.e. after a complete execution trace tree reflecting the lazy evaluation has been built. The structure of the tree is however not changed, only the order in which questions are asked is. It might well be the case that a user is unwilling to give a definite answer to a question. LADT then allows him to postpone the question by giving the answer “maybe”. Debugging will then continue with the children of the node in question. Should a bug be found among these, then the better. Otherwise the user will eventually be faced with the deferred question again. Hopefully, he should now be confident enough to give a decisive answer. In order to reduce the number of questions asked, the debugger keeps a record over all questions and answers asked so far. Thus, the same question never has to be asked twice. There is also a simple assertion facility whereby the user may assert the
correctness of a particular function. Questions regarding this function will then be suppressed. Obviously, a debugger must be able to cope with programs that terminate in an abnormal manner. For an algorithmic debugger, this means that it will be left with an incomplete trace tree. LADT deals with this situation by patching the tree into a consistent state before the actual debugging starts in the case of a run-time error. This is done by inserting nodes representing the value ⊥ wherever there is a branch missing in the tree. In the case of a program that actually is non-terminating, the user has to interrupt the program by pressing Ctrl-C. This is then interpreted as a normal run-time error and dealt with as outlined above. The debugger also handles interactive programs without problem. This is because I/O is managed without resorting to side effects. In Freja, as in many other lazy functional languages, input is made available as a list of characters which is supplied as the sole argument to the main function in the program. Due to the lazy semantics, no input actually has to be available until it is used, and thus it is possible to write interactive programs. LADT has so far been used to debug a number of small programs, e.g. a program for calculating prime numbers, as well as a somewhat larger expression evaluator, consisting of some 250 lines of Freja code. Some of the found “bugs” were artificially introduced into the programs, whereas others were real bugs, inadvertently introduced during implementation of the test programs. Further details on LADT may be found in Nilsson and Fritzson [12]. 4.2
Problems
The current LADT implementation has two severe problems that make it difficult or impossible to apply to real, large programs. The main one is the size of the trace tree: currently every single reduction is recorded, which means that the size easily could reach hundreds of megabytes. The situation is akin to running a lazy functional program without garbage collection. Also, building the tree takes a long time. Though we have not done any extensive measurements, execution seemed to be slowed down by two or three orders of magnitude when doing tracing. Now, it certainly would be possible to keep the trace on secondary storage, even if tracing (as well as strictification) then would become even more expensive. Indeed, one might even argue that the sizes of primary memories within a not too distant future will be large enough to accommodate traces of such sizes. However, the fundamental problem is that there is no upper bound on the size of trace, and that problem remains however we store the trace. The other big problem is that far too many questions are asked. This makes LADT a very tedious debugging tool to use, especially since a large number of the questions are irrelevant. It might well be the case that a user can see exactly what is wrong in a result returned from function. If this information could be conveyed to the debugger, many irrelevant questions could in principle be discarded.
5
Ideas for Practical Implementation
Despite the problems with current implementation, we feel that this approach to debugging is basically sound and promising in the context of lazy functional languages. In this section, a number of ideas for dealing with the above problems and extending the basic approach are suggested, with the aim of making algorithmic debugging for lazy functional languages practical. The ideas are summarized in the list below and then explained further in the following subsections. • Thin tracing: If it is known beforehand that some functions or modules are correct (e.g. library routines), it should not be necessary to trace everything, thereby reducing the size of the trace as well as the number of questions asked. • Piecemeal tracing: Do not store the entire trace at once. Instead, parts of the trace can be constructed as and when they are needed by rerunning the program that is being debugged. • Immediate Strictification: Instead of building a lazy execution trace tree and applying strictification on it afterwards, a strictified tree could be built directly. • Slicing: If the user is able to be more specific as to what is wrong, rather than just saying that something is wrong, it ought to be possible to make use of this information to reduce the number of questions asked by applying program slicing. • A smarter user interface: It is often the case that the details of large data structures are of no interest in answering questions. Thus it would be beneficial to be able to suppress such details. 5.1
Thin Tracing
Currently, LADT records every single reduction that takes place during execution. Quite a few of these are applications of language primitives and library functions which may reasonably be assumed to behave correctly. Thus the user should not be asked about the behaviour of such functions, in which case there seems to be little point in tracing such applications in the first place. Furthermore, large systems are usually built modularly, so it is not unreasonable to assume that it frequently will be the case that there are a large number of well tested, trusted modules and a few, new “prime suspects” when a bug manifests itself. So under a thin tracing scheme, only a subset of the reductions would be traced, based on assumptions regarding the correctness of certain modules. Clearly, this will also reduce the number of questions that are asked and the time taken to build the tree. However, not having the entire trace at our disposal, means that strictification cannot be performed as it is currently done, i.e. during the debugging phase. Therefore, a new approach to strictification must be adopted in order to use thin tracing. There is also a more subtle problem as to what is meant by a function being “correct”. For a first-order function it is obvious: a function is correct if it computes the expected result for whatever arguments it is applied to. During debugging, this means
that a user no doubt would indicate that an application of the function is correct, and the entire branch in the execution trace tree emerging from that point may thus be cut away. But for a higher-order function that takes another function as an argument, it would be a rather bold claim that the result is correct for arbitrary arguments: the supplied function is effectively behaviour that has been abstracted out of the higher-order function, and claiming that the higher-order function produces the correct result when some arbitrary behaviour is being plugged back in cannot be justified. It is only possible to say that the higher-order function uses the supplied function in the intended way. For our purposes, this means that the branch in the execution trace tree corresponding to the application cannot be cut away. The question about the application of the higher-order function could of course be suppressed, but if the node has many children, then more questions would be asked on average than if the question had not been suppressed. On the other hand, if it is known that the function that is supplied as an argument is correct as well, then the application could be treated as in the first-order case. This suggests that some simple “correctness calculation” should be performed on higherorder applications. 5.2
Piecemeal Tracing
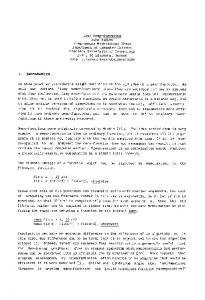
Even if it is possible to substantially reduce the size of the trace using thin tracing, there is still no guaranteed upper bound on the size of the trace tree. Indeed, as long as the trace for a whole execution is going to be stored, there can be no general, fixed such upper bound. An interesting alternative would then be to store only so much trace as there is room for. Debugging is then started on this first piece of trace. If this is enough to find the bug, then all is well. Otherwise, the program to be debugged is re-executed, and the next piece of the trace is captured and stored. Re-executing the program is not a problem since pure functional programs are deterministic, but any input to the program must obviously be preserved and reused. We will refer to such a tracing scheme as piecemeal tracing from now on. The question is then how to select the piece of the trace to be stored in a sensible way. Just storing reductions as they happen until the trace storage is full would not be very useful since it may then happen that a very deep but narrow piece of the tree is captured. If the top reduction actually is correct, the program would have to be rerun immediately to get the next piece of the trace. It would be better if trace corresponding to the next n questions, regardless of what the answers to these questions will be, could be stored. This leads to the idea of introducing a distance measure on the nodes in the tree based on the number of questions that would have to be answered in order to get from one node to another (if this is possible, otherwise the measure is undefined). We term this measure the query distance and the idea is illustrated in Fig. 7. The nodes are labelled with their query distance from the root node and the grey arcs are labelled with the answer that would take a user from one node in the execution trace tree to the other during algorithmic debugging.
0
no
yes 1
2
no
no yes
2
yes 3
yes
yes 4
5
3
yes 4
yes 5
6
Fig. 7. Query distances from the root node.
Given a cache for execution trace tree nodes, piecemeal tracing can be performed as follows. Suppose that a particular node in the trace tree has been reached during debugging and that it is found that more trace is needed to proceed. Call this particular node the current node. Now the entire program is re-executed. (There is a good reason for re-executing the entire program as will become clear in the next subsection.) Only nodes reachable from the current node, i.e. nodes for which the query distance is defined relative to the current node, are stored in the cache. When the cache is full, nodes with the largest query distance relative to the current node are thrown out in favour of nodes with a smaller query distance. Then nodes corresponding to the next n questions will be in the cache when the tracing is completed, where n depends on the size of the cache. Thus, an arbitrary upper bound may be imposed on the trace size, but obviously, the larger the size of a cache, the fewer times the program will have to be rerun. The piecemeal tracing scheme makes it possible to trade space for time as is appropriate for any specific implementation. However, as is the case with thin tracing, the entire trace is no longer available during debugging, which means that strictification cannot be performed as it is currently done. This problem is addressed in the next subsection. 5.3
Immediate Strictification
In the current LADT system, a lazy execution trace tree reflecting the real order in which reductions take place is built during the trace phase. Strictification is performed afterwards, during the debugging phase, by recursively substituting values for expressions while asking for confirmation, as described in subsection 3.3. This means that the debugger is effectively redoing work that has already been done during execution of the program that is being debugged. Also, due to the way graph reduction works, some strictification opportunities are missed by LADT which means that only approximative strictification is achieved [12]. Furthermore, doing strictification afterwards is only possible if the entire trace, containing every single
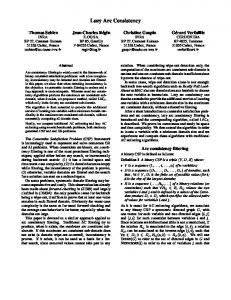
reduction, is available to the debugger. Thus thin and piecemeal tracing cannot be integrated with the current debugger. As observed in passing in subsection 3.2, it would not be necessary to perform any substitutions at all if we kept pointers from the execution trace tree to the corresponding pieces of graphs, since these would be in their most evaluated form once the execution was completed. Not only would it then not be necessary to have access to the complete trace during debugging, but it would also solve the problem with approximative strictification. But, as explained in the aforementioned subsection, correct strictification also requires the structure of the execution tree to be changed. So is it possible to build a tree with the correct, i.e. strict, structure directly, during tracing rather than afterwards? Indeed this seems to be possible. The basic idea is that whenever a redex (reducible expression) is created during the execution of code corresponding to a function, a node referring to this redex is also inserted at the appropriate place in the execution trace tree. Since a strict language would not create the redex for later evaluation, but evaluate it directly, the “appropriate place” is as a child node of the node corresponding to the current function invocation. The key observation is that the creation of a redex in the lazy case corresponds to strict evaluation of that expression. The redexes also has to be tagged with pointers referring back to the corresponding nodes in the execution trace tree so that this node can be found once the redex is reduced. Having this back pointer is also convenient during garbage collection since pointers in the execution trace tree then must be updated when pieces of graph are moved around. We will therefore in the following assume that there is a single pointer from the execution tree to any graph node (and vice versa). This means that once a reduction has taken place, any piece of graph that has reached its final form is copied into the execution trace tree. However, there are several design options here and it might be better not to copy anything, leaving it where it is. The above also explains why the entire program should be re-executed during piecemeal tracing: it is only after completing the execution that each piece of graph will be in its most evaluated form. If we tried to only re-evaluate a particular function application, we would not know when to stop since we would not know which parts of the result that actually were going to be used later on (assuming that the result is a list for example). Hopefully, the following example should give a feeling for what we are trying to achieve. Suppose that we were to execute the following (bug free) program: sqr x = x * x; main = sqr (1 + 2); Fig. 8 shows the corresponding lazy execution tree, i.e. it reflects the order in which the reductions actually happens, while Fig. 9 shows the strict tree, i.e. the tree that we are trying to construct using immediate strictification. First, main is invoked. It builds two redexes: 1+2 and sqr (1+2). Thus nodes corresponding to these are inserted into the execution trace tree, in the order in which they are created. Note how the sqr node refers to the 1+2 node so that there is only one pointer from the execution tree to each redex. Since the result of main is the result
main⇒9 sqr (1+2)⇒(1+2)*(1+2)
main⇒9 (1+2)*(1+2)⇒9
1+2⇒3
1+2⇒3
sqr 3⇒9 3*3⇒9
Fig. 8. Lazy execution trace tree.
Fig. 9. Strict execution tree.
of the latter redex, the result field of the tree node for main points at the tree node for sqr in order to preserve the single pointer property. The situation is shown in Fig. 10.
main⇒(•)
1+2⇒(•)
sqr (•)⇒(•)
@ sqr
@ @
+
2 1
Fig. 10.
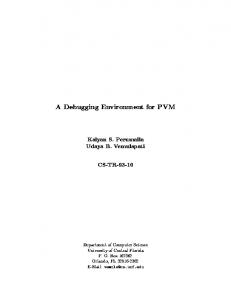
The next thing that happens, as can be seen from the lazy execution tree, is that the sqr function is invoked to reduce sqr (1+2) to (1+2)*(1+2). This means that sqr has built a new redex, so the corresponding node is inserted into the execution tree. This is depicted in Fig. 11. Since the result of sqr (1+2) is the result of (1+2)*(1+2), the result field of the sqr execution tree node has been redirected to the new node. Then 1+2 is reduced to 3. This creates no new redexes, but the result of the reduction is copied into the tree, see Fig. 12. Finally, 3*3 is reduced to 9. Again, no new redexes are created so it only remains to copy the result into the tree, see Fig. 13. Compare the resulting strictified tree with the strict tree in Fig. 9.
main⇒(•)
1+2⇒(•)
sqr (•)⇒(•)
@
(•)*(•)⇒(•)
@ @ * @ +
2 1 Fig. 11.
main⇒(•)
1+2⇒3
sqr (•)⇒(•)
@
(•)*(•)⇒(•)
@ 3 * Fig. 12.
5.4
Slicing
Obviously, the more information the user is able to supply the system with per question, the fewer questions the system has to ask in order to locate the bug. For example, if a user indicates that a particular element in a list is not what it is supposed to be, the system can disregard any computations that are not relevant for the production of this
main⇒(•)
1+2⇒3
sqr (•)⇒(•)
(•)*(•)⇒9 Fig. 13.
particular element. This technique is a variation of program slicing [19][20] and it could reduce the number of questions asked during algorithmic debugging considerably. The approach that seems to be the most suitable is dynamic slicing, since dynamic slices are more precise than are static ones [7]. Perhaps something similar to what Kamkar has done could be used [8][7]. Amongst other things, this would require keeping track of data dependencies, i.e. which node in the execution tree that corresponds to the function application that computed a certain value. Note, however, that some such information would be present in the strictified tree “for free” if strictification is performed as outlined in the previous subsection. Thus, it might be possible to do a coarse, approximative, but yet useful, slicing without much extra effort. 5.5
A Smarter User Interface
Even if strictification helps in making the questions asked by the debugger easier to understand and answer, they are still large if large data structures are involved. Frequently, the details of such structures are not important when it comes to answering questions about the correctness of the behaviour of a function application. As a trivial example, consider the function to append two lists. The actual elements in the list are not important for the behaviour of the function, something which is reflected by the polymorphic type of the function which indicates that it can append lists of any specific type. This suggests that it might be possible to use type information and other static properties to construct heuristics regarding which parts of large data structures that are interesting and thus should be presented to the user, and which that are not and thus should be suppressed, at least initially. The gain of a scheme like this could be considerable. By building a window and pointer based graphic user interface, the usability of the debugger would be further enhanced, e.g. suppressed subcomponents could be expanded by clicking on them and erroneous parts of data structures could easily be marked for computing a slice.
6
Conclusions
This paper has argued that algorithmic debugging is a suitable technique for debugging lazy functional programs. Experience from work with the current LADT implementation supports this claim. However, as it stands, LADT cannot be considered to be a practically usable system, mainly due to the prohibitively large trace size for any real world problem and because far to many questions has to be answered during debugging. In this paper, we have suggested a number of techniques to alleviate these and other problems. Thin tracing should be used so that only relevant applications are traced. By using piecemeal tracing, the debugger can handle traces of arbitrary size at the expense of re-executing the program when more trace is needed. Since both thin tracing and piecemeal tracing means that strictification cannot be performed during the debugging phase, as is currently the case, a method for building a strictified tree directly during the trace phase, immediate strictification, was suggested. Finally, it was argued that the debugger should employ dynamic slicing to reduce the number of questions asked and that heuristics based on type information and other statically inferable properties should be used to perform sensible pretty printing of questions to reduce their size. If all these techniques can be successfully integrated, we believe that a practically useful algorithmic debugger for lazy functional languages could be built.
References [1]
Lennart Augustsson. A compiler for lazy ML. In Proceedings of the 1984 ACM Conference on LISP and Functional Programming, pages 218–227, August 1984.
[2]
Lennart Augustsson. Compiling Lazy Functional Languages part II. PhD thesis, Department of Computer Science, Chalmers University of Technology, December 1987.
[3]
Lennart Augustsson. Personal communication on the lack of suitable debugging tools for lazy functional languages, November 1991.
[4]
Peter Fritzson, Tibor Gyimothy, Mariam Kamkar, and Nahid Shahmehri. Generalized algorithmic debugging and testing. In Proceedings of the 1991 ACM SIGPLAN Conference, pages 317–326, Toronto, Canada, June 1991. A revised version to appear in ACM LOPLAS (Letters of Programming Languages and Systems).
[5]
Thomas Johnsson. Efficient compilation of lazy evaluation. In Proceedings of the 1984 ACM SIGPLAN Symposium on Compiler Construction, pages 58–69, June 1984. Proceedings published in SIGPLAN Notices, 19(6).
[6]
Thomas Johnsson. Compiling Lazy Functional Languages. PhD thesis, Department of Computer Science, Chalmers University of Technology, February 1987.
[7]
Mariam Kamkar. Interprocedural Dynamic Slicing with Applications to Debugging and Testing. PhD thesis, Department of Computer and Information Science, Linköping University, S-581 83, Linköping, Sweden, April 1993.
[8]
Mariam Kamkar, Nahid Shahmehri, and Peter Fritzson. Interprocedural dynamic slicing. In M. Bruynooghe and M. Wirsing, editors, Programming Language Implementation and Logic Programming, volume 631 of Lecture Notes in Computer Science, pages 370–384, Leuven, Belgium, August 1992.
[9]
Amir Shai Kishon. Theory and Art of Semantics Directed Program Execution Monitoring. PhD thesis, Yale University, May 1992.
[10]
Lee Naish. Declarative debugging of lazy functional programs. Research Report 92/6, Department of Computer Science, University of Melbourne, Australia, 1992.
[11]
Henrik Nilsson. Freja: A small non-strict, purely functional language. MSc dissertation, Department of Computer Science and Applied Mathematics, Aston University, Birmingham, England, September 1991.
[12]
Henrik Nilsson and Peter Fritzson. Algorithmic debugging for lazy functional languages. In M. Bruynooghe and M. Wirsing, editors, Programming Language Implementation and Logic Programming, volume 631 of Lecture Notes in Computer Science, pages 385–399, Leuven, Belgium, August 1992.
[13]
Simon L. Peyton Jones. The Implementation of Functional Programming Languages. Prentice Hall, 1987.
[14]
Rudolph E. Seviora. Knowledge-based program debugging systems. IEEE Software, 4(3):20–32, May 1987.
[15]
Nahid Shahmehri. Generalized Algorithmic Debugging. PhD thesis, Department of Computer and Information Science, Linköping University, S-581 83, Linköping, Sweden, 1991.
[16]
Ehud Y. Shapiro. Algorithmic Program Debugging. MIT Press, May 1982.
[17]
Robert Sturrock. Debugging systems for lazy functional programming languages. Honours dissertation, Department of Computer Science, University of Melbourne, Australia, November 1992.
[18]
David A. Turner. Miranda: A non-strict functional language with polymorphic types. In Proceedings of the IFIP International Conference on Functional Programming Languages and Computer Architecture, FPCA’85, number 201 in Lecture Notes in Computer Science, Nancy, 1985.
[19]
Mark Weiser. Programmers use slices when debugging. Communications of the ACM, 25(7):446–452, July 1982.
[20]
Mark Weiser. Program slicing. IEEE Transactions on Software Engineering, 10(4):352–357, July 1984.