ISSN:2229-6093 Arun Kumar R et al, Int. J. Comp. Tech. Appl., Vol 2 (5), 1709-1716
Leaf Disease Grading by Machine Vision and Fuzzy Logic Sanjeev S Sannakki1*, Vijay S Rajpurohit2, V B Nargund3, Arun Kumar R4, Prema S Yallur5 1,2,4,5
Department of Computer Science and Engineering, Gogte Institute of Technology, Belgaum, India 3 Department of Plant Pathology, University of Agricultural Sciences, Dharwad, India Email-
[email protected]*,
[email protected],
[email protected]
Abstract- present paper introduces an innovative approach to automatically grade the disease on plant leaves. The system effectively inculcates Information and Communication Technology (ICT) in agriculture and hence contributes to Precision Agriculture. Presently, plant pathologists mainly rely on naked eye prediction and a disease scoring scale to grade the disease. This manual grading is not only time consuming but also not feasible. Hence the current paper proposes an image processing based approach to automatically grade the disease spread on plant leaves by employing Fuzzy Logic. The results are proved to be accurate and satisfactory in contrast with manual grading. Keywords- color image segmentation, disease spot extraction, percent-infection, fuzzy logic, disease grade. INTRODUCTION The sole area that serves the food needs of the entire human race is the Agriculture sector. It has played a key role in the development of human civilization. Plants exist everywhere we live, as well as places without us. Plant disease is one of the crucial causes that reduces quantity and degrades quality of the agricultural products. Plant Pathology is the scientific study of plant diseases caused by pathogens (infectious diseases) and environmental conditions (physiological factors). It involves the study of pathogen identification, disease etiology, disease cycles, economic impact, plant disease epidemiology, plant disease resistance,
IJCTA | SEPT-OCT 2011 Available
[email protected]
pathosystem genetics and management of plant diseases. Disease is impairment to the normal state of the plant that modifies or interrupts its vital functions such as photosynthesis, transpiration, pollination, fertilization, germination etc. Plant diseases have turned into a nightmare as it can cause significant reduction in both quality and quantity of agricultural products [2]. Information and Communication Technology (ICT) application is going to be implemented as a solution in improving the status of the agriculture sector [3]. Due to the manifestation and developments in the fields of sensor networks, robotics, GPS technology, communication systems etc, precision agriculture started emerging [10]. The objectives of precision agriculture are profit maximization, agricultural input rationalization and environmental damage reduction by adjusting the agricultural practices to the site demands. In the area of disease management, grade of the disease is determined to provide an accurate and precision treatment advisory. EXISTING SYSTEM: MANUAL GRADING Presently the plant pathologists mainly rely on the naked eye prediction and a disease scoring scale to grade the disease on leaves. There are some problems associated with this manual grading. Diseases are inevitable in plants. When a plant gets affected by the disease, a treatment advisory is required to cure the
1709
ISSN:2229-6093 Arun Kumar R et al, Int. J. Comp. Tech. Appl., Vol 2 (5), 1709-1716
disease. Chemical pesticides are commonly used to cure the diseases. But, excessive use of pesticides for plant disease treatment increases costs and raises the danger of toxic residue levels on agricultural products. As pesticides are among the highest components in the production costs of field crops and have been identified as a major contributor to groundwater contamination; their use must be minimized. This requires that the disease must be identified accurately along with the stage in which the disease is; so that only a proper quantity of pesticide can be used for the treatment rather than blindly spraying. Presently, the plant pathologists rely on disease scoring scale to grade the disease. This is shown in Table 1. Table I: Disease Scoring Scale for Leaves Percent Infection Disease Grade 0 0 Up to 1 1 1 – 10 2 10 – 20 3 20 – 40 4 40 – 100 5 From the table 1, it is observed that the grade of the disease is assigned based on the percent-infection i.e., if the infection percent is about 5 then the grade is 2. The problem here is that even if the percentinfection is 2 or 9 the grade remains 2 only. Presently, percent-infection is calculated based on grid paper analysis. This method is time consuming and burden of repetitive tasks. Since human intervention is involved, it is prone to errors also. Hence, now the time has come to overcome these problems. This can be achieved by inculcating machine vision into the agriculture to get the accurate grade of the disease. With this motto the present paper proposes an automatic and accurate disease grading system for plant
IJCTA | SEPT-OCT 2011 Available
[email protected]
leaves which can be of great useful for the agronomists. METHODOLOGY The proposed methodology aims to model a promising disease grading system for plant leaves. For the experimentation purpose, pomegranate leaves are considered. The flow chart of the methodology is presented in the annexure 1 in the appendix. The system is divided into the following steps: (1) Image acquisition (2) Image Pre-processing (3) Color image segmentation (4) Calculating AT and AD (5) Disease grading by Fuzzy Logic. (1) Image acquisition The digitization and storage of an image is referred as the image acquisition. In any image processing applications, the work always starts with image acquisition. In the current work, the images of diseased samples of pomegranate leaves are captured using Nikon Coolpix L20 digital camera having 10 megapixels of resolution and 3.6x optical zoom, maintaining an equal distance of 16 cm to the object. All the images are then saved in the same format i.e., JPEG. For the purpose of image acquisition, authors have visited and captured images from several pomegranate farms in the places of Hagaribommanahalli, Bellary district and Kaladhagi, Bagalkot district of Karnataka, India. (2) Image Pre-processing Image processing is a form of signal processing for which the input is an image, such as a photograph or video frame; the output of image processing may be either an image or a set of characteristics or parameters related to the image. Digital image processing is the use of computer algorithms to perform image processing on digital images [5]. Preprocessing uses the techniques such as image resize, filtering, segmentation,
1710
ISSN:2229-6093 Arun Kumar R et al, Int. J. Comp. Tech. Appl., Vol 2 (5), 1709-1716
cropping, contrast enhancement, angle correction, morphological operations etc. In the contemporary exertion, image resize and filtering are performed as a part of pre-processing. Initially, captured images are resized to a fixed resolution so as to utilize the storage capacity or to reduce the computational burden in the later processing. Noise is inevitable during image acquisition or transmission. Noise would disturb the segmentation and the feature extraction of disease spots. So they must be removed or weakened before any further image analysis by applying an appropriate image filtering operation. In the present work, authors have considered Gaussian filter to filter out the input images. (3) Color image segmentation Image segmentation refers to the process of partitioning the digital image into its constituent regions or objects so as to change the representation of the image into something that is more meaningful and easier to analyze. The level to which the partitioning is carried depends on the problem being solved i.e. segmentation should stop when the objects of interest in an application have been isolated [5]. In the current work, the very purpose of segmentation is to identify regions in the image that are likely to qualify as diseased regions. There are various techniques for image segmentation such as clustering methods, compression-based methods, histogram-based methods, region growing methods etc. K-means clustering method has been used in the present work to carry out segmentation. K-Means Clustering is a method of cluster analysis which aims to partition n observations into k mutually exclusive clusters in which each observation belongs to the cluster with the nearest mean. Following are the steps in K-means clustering. Step1: Read Image Step2: Convert Image from RGB Color Space to L*a*b* Color Space: This
IJCTA | SEPT-OCT 2011 Available
[email protected]
conversion enables to quantify the visual differences present in the RGB image. Step 3: Classify the Colors in 'a*b*' Space Using K-Means Clustering. K-means clustering treats each object as having a location in space. K-means finds partitions such that objects within each cluster are as close to each other as possible, and as far from objects in other clusters as possible. Since the color information exists in the 'a*b*' space, the objects of interest are the pixels with 'a*' and 'b*' values. The output of k-means is the set [cluster_index cluster_center]. Step 4: Label Every Pixel in the Image Using the Results from K-means: For every object in the input image, k-means returns an index corresponding to a cluster and labels every pixel in the image with its cluster_index. Step 5: Create Images that Segment the original image by Color: This step will result in k number of images each of which is a segment of the original image that are partitioned by color. When the segmentation is completed, one of the clusters contains the diseased spots being extracted. This image is saved and considered for calculating AD (4) Calculating AT and AD In image processing terminology area of a binary image is the total number of on pixels in the image [18]. Hence, the original resized image is converted to binary image such that the pixels corresponding to the leaf image are on. From this image total leaf area (AT) is calculated. Similarly, the output image from color image segmentation, containing the disease spots, is used to calculate total disease area (AD). (5) Disease grading by Fuzzy Logic Once AT and AD are known, the percent-infection (PI) is calculated by applying the formula (1). PI= (AD / AT) *100 . . . (1)
1711
ISSN:2229-6093 Arun Kumar R et al, Int. J. Comp. Tech. Appl., Vol 2 (5), 1709-1716
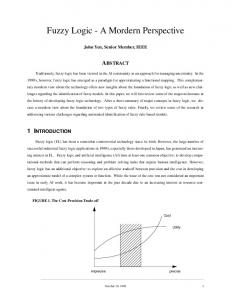
Now that, the Grade of the disease has to be determined from PI. Fuzzy Logic has been employed for this purpose. Fuzzy Logic (FL) – FL, which was first introduced by Lotfi Zadeh (1965), is used to handle uncertainty, ambiguity and vagueness. It provides a means of translating qualitative and imprecise information into quantitative (linguistic) terms [4]. Fuzzy set theory and fuzzy logic provide powerful tools to represent and process human knowledge in the form of fuzzy IFTHEN rules. Over the past few decades, fuzzy logic has been used in a wide range of problem domains. The areas of applications are very wide: process control, management and decision making, operations research, pattern recognition and classification. In the lack of precise mathematical model which will describe behavior of the system, Fuzzy Logic is a good “weapon” to solve the problem: it allows using logic if-then rules to describe the system’s behavior. From the literature survey, it has been proved that fuzzy logic can be inculcated effectively and efficiently in the agriculture domain covering a wide range of precision agriculture applications such as texture analysis, agriculture produce grading, effective use of herbicide sprayers in disease control etc. Hence, in the present work Fuzzy Logic (FL) is used for the purpose of disease grading. RESULTS AND ANALYSIS (1)Image acquisition Figure 1 shows the query image.
Fig1. Query Image
IJCTA | SEPT-OCT 2011 Available
[email protected]
(2) Image Pre-processing A. Resize The image is resized to a resolution of [200 250]. Figure 2 shows the result of resizing for the sample query image.
Fig2. Resized image
Filtering Figure 3 shows the image that has been filtered by Gaussian filter.
A.
Fig3. Gaussian Filtered Image
(3) Color image segmentation K-means segmentation algorithm requires users to select the value ‘k’. The correct choice of k is often ambiguous. Increasing k will always reduce the amount of error in the resulting clustering, to the extreme case of zero error if each data point is considered its own cluster (i.e., when k equals the number of data points, n). Intuitively then, the optimal choice of k will strike a balance between maximum compression of the data using a single cluster, and maximum accuracy by assigning each data point to its own cluster. After some trial and error method, for the current work, value of K is chosen as 10 and the corresponding results are shown in Annexure 2 in the appendix where the figure (a) shows the L*a*b converted image. Figure (b) shows the image labeled by cluster index. Figures (c) through (l) shows segmentation results.
1712
ISSN:2229-6093 Arun Kumar R et al, Int. J. Comp. Tech. Appl., Vol 2 (5), 1709-1716
From these figures, it can be seen that the cluster 3 contains the disease spots being extracted and the same is displayed in Figure 4.
Fig4. Disease portion extracted
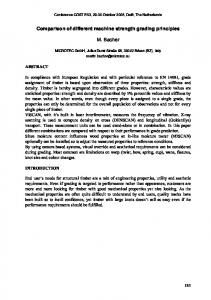
(4) Calculating AT and AD Total Leaf Area (AT) Figure 5 shows the binary image of the original resized image.
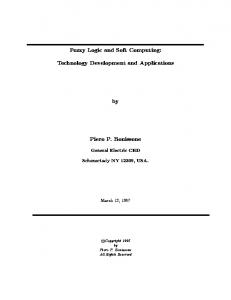
(5) Disease grading by Fuzzy Logic From (1), Percent-infection is given by PI= (AD / AT) *100 = (682 / 30468 ) * 100 = 2.238414 % A Fuzzy Inference System (FIS) is developed for disease grading by referring to the disease scoring scale in Table I. For the FIS for disease grading, input variable is Percent Infection and output variable is Grade. Triangular membership functions are used to define the variables and six fuzzy rules are set to grade the disease. Figure 7 shows the result of grading. Also, the Percent-Infection and the corresponding Disease Grade will be displayed in a separate text file.
Percent-Infection= 2.238414% Disease Grade = 1.500000e+000 Fig5. Binary version of the query image
From this figure, the value of total leaf area is: Total leaf area (TA) = 30468 pixels Total Disease Area (AD) Figure 6 shows the binary image of the disease portion.
Fig6. Binary version of the disease portion
From this figure, the value of total disease area is: Total leaf area (TD) = 682 pixels
IJCTA | SEPT-OCT 2011 Available
[email protected]
Fig7. Result of Disease Grading
From the result, it can be observed that the accurate values of percentinfection and disease grade are obtained with which a proper treatment advisory can be given thereby eliminating eh above said problems. CONCLUSION As it is realized throughout this paper, an approach to automatically grade the disease on plant leaves is very much essential in the present scenario. The Grading System built by Machine Vision and Fuzzy Logic is very useful for grading the disease. This kind of expert system is going to help pathologists as it overcomes almost all the disadvantages of manual grading in terms of complexity and time. The observed results through experiments are found to be accurate and satisfactory.
1713
ISSN:2229-6093 Arun Kumar R et al, Int. J. Comp. Tech. Appl., Vol 2 (5), 1709-1716
REFERENCES [1] Shen Weizheng, Wu Yachun, Chen zhanliang, Wei Hongda, “Grading Method of Leaf Spot Disease Based on Image Processing”, 2008 International Conference on Computer Science and Software Engineering, IEEE [2] Dheeb Al Bashish, Malik Braik and Sulieman Bani-Ahmad, “Detection and Classification of Leaf Diseases using Kmeans-based Segmentation and NeuralNetworks-based Classification”, Information Technology Journal 10(2): 267-275, 2011. [3] Nur Badariah Ahmad Mustafa, Syed Khaleel Ahmed, Zaipatimah Ali, Wong Bing Yit, Aidil Azwin Zainul Abidin, Zainul Abidin Md Sharrif, “Agricultural Produce Sorting and Grading using Support Vector Machines and Fuzzy Logic”, 2009 IEEE International Conference on Signal and Image Processing Applications. [4] Üsmail KAVDIR,Daniel E. GUYER, “Apple Grading Using Fuzzy Logic”, Turk J Agric (2003), 375-382 © T.BÜTAK [5]Rafael C.Gonzalez, Richard E.Woods, Steven L.Eddins, “Digital Image Processing”, Pearson Education, 2nd Edition [6]Image Processing Toolbox™ 7 User’s Guide, ©Copyright 1993–2010 by The MathWorks, Inc. [7]J.-S. Roger Jang, Ned Gulley, “MATLAB Fuzzy Logic Toolbox User’s guide Version 1”, ©Copyright 1984 - 1997 by The MathWorks, Inc. [8]Timothy J Ross, FUZZY LOGIC with engineering applications, John Wiley & Sons, Inc, 2nd ed., 2005
IJCTA | SEPT-OCT 2011 Available
[email protected]
[9] C.C. Yang1, S.O. Prasher, J.-A. Landry, J. Perret1 And H.S. Ramaswamy , “Recognition Of Weeds With Image Processing And Their Use With Fuzzy Logic For Precision Farming”, Canadian Agricultural Engineering Vol. 42, No. 4 [10]Aline Baggio, “Wireless Sensor Networks in Precision Agriculture”.
1714
ISSN:2229-6093 Arun Kumar R et al, Int. J. Comp. Tech. Appl., Vol 2 (5), 1709-1716
APPENDIX Annexure 1: Flow chart of the proposed methodology START
CAPTURE DISEASED LEAF IMAGE
IMAGE RESIZE
CONVERT TO B/W IMAGE
IMAGE FILTERING
COLOR IMAGE SEGMENTATION
CALCULATE TOTAL LEAF AREA (AT)
DISEASE SPOTS BEING EXTRACTED
CALCULATE TOTAL DISEASE AREA (AD)
PERCENT-INFECTION PI = (AD/AT)*100
DISEASE GRADING BY FUZZY LOGIC
DISAEASE GRADE
END
IJCTA | SEPT-OCT 2011 Available
[email protected]
1715
ISSN:2229-6093 Arun Kumar R et al, Int. J. Comp. Tech. Appl., Vol 2 (5), 1709-1716
Annexure 2: Segmentation results for the Query image
(a) LAB image
(d) Objects in Cluster 2
(g) Objects in Cluster 5
(j) Objects in Cluster 8
IJCTA | SEPT-OCT 2011 Available
[email protected]
(b) Cluster index Image
(e) Objects in Cluster 3
(h) Objects in Cluster 6
(k) Objects in Cluster 9
(c) Objects in Cluster 1
(f) Objects in Cluster 4
(i) Objects in Cluster 7
(l) Objects in Cluster 10
1716