International Journal of Industrial Engineering and Management (IJIEM), Vol. 2 No 1, 2011, pp. 21-26 Available online at http://www.ftn.uns.ac.rs/ijiem/ ISSN 2217-2661
Lean Manufacturing Implementation Problems in Beverage Production Systems Ivica Veža University of Split, Faculty of Electrical Engineering, Mechanical Engineering and Naval Architecture, Ruđera Boškovića 32, 21000 Split, Croatia,
[email protected]
Nikola Gjeldum University of Split, Faculty of Electrical Engineering, Mechanical Engineering and Naval Architecture, Ruđera Boškovića 32, 21000 Split, Croatia,
[email protected]
Luka Celent University of Split, Faculty of Electrical Engineering, Mechanical Engineering and Naval Architecture, Ruđera Boškovića 32, 21000 Split, Croatia,
[email protected] Received (01 February 2011); Revised (05 March 2011); Accepted (27 March 2011)
Abstract For production companies, it is very important to keep their production processes efficient. Huge competition and continuously changing market demands require constant improvements of company’s business. Lean manufacturing is a production practice that considers the expenditure of resources for any goal other than the creation of value for the end customer to be wasteful, and thus a target for elimination. Working from the perspective of the customer who consumes a product or service, "value" is defined as any action or process that a customer would be willing to pay for. Lean manufacturing is a generic process management philosophy derived mostly from the Toyota Production System. This paper presents the results of case study about implementation of lean concept in bottler beverage production system in the Croatian enterprises and the main problems of implementation. Key words: Lean Production, Line Output Improvement, 5S, Line Time Study
1. INTRODUCTION One of the possible conceptions for the survival in a turbulent world market is the introduction of new technologies and organisational structures (for example fractal factory [1], network enterprises [2], lean production [3], six sigma [4], business process reengineering [5] etc.). The term Lean manufacturing is in opposite to principles of mass production which for a long time has been dominating in western industry. As oppose to Lean principles, mass production means big production systems, with huge inventories, great expenses, big batch production, downtimes, and waiting in production process [6]. Methods and tools used in lean concept modelling can be described as important elements in manufacturing system construction (Figure 1.). As shown in Figure 1 that symbolically represents a house, the base of everything are: work teams, highly-motivated workers and the principle “5x why - 1x how” which warns about the seriousness of every decision that lead to a goal. As all tools are important, they are arranged at random. Beside these tools there can be produced and shaped others which in certain conditions give better results. Lean production is an applied methodology of scientific, objective techniques that cause work tasks in a process to be performed with a minimum of non-value adding activities resulting in greatly reduced wait time, queue
time, move time, administrative time, and other delays. A critical point in the lean thinking is the focus on value. Often however, value creation is seen as equal to cost reduction. This represents a common yet critical shortcoming of the understanding of lean [7].
Principles, methods and tools in building lean concept procedures
Pull/Kanban
JIT
Flow continue
SMED
Batch Reduction
Layout
Visual systems
TPM
TQM
7 waste
5S
5 why
Value Stream Mapping Work teams, high motivated workers, customer orientation Figure 1. Lean concept principles, tools and methods
Companies are taking more and more notice of the importance of organizational innovations such as lean production or total quality management [8].
IJIEM
22
Veža et al.
Lean is one of the popular concepts which have been practiced in most company. However, there are a lot of companies who implement lean and are not realized whether lean level of company is improve or relegate. Thus, it is important to inspect the lean result after implementation of lean. So, this paper presents results of Lean production tools implementation in bottler beverage production system. The results have shown the improvement on lean behavior with the help of people development system implementation which enhance the people capabilities in eliminating wastages. These are supported by comparing the survey results on lean behavior for beginning and end of the period of thre months with the monitoring of real life data on the case study
2. LINE OUTPUT IMPROVEMENT (LOI) IN BEVERAGE PRODUCTION SYSTEM Successful Lean application is conditioned by an evolutionary problem-solving ability of the rank and file. Such ability is in itself contingent on employee involvement in improvement programs and the implementation of appropriate practices. At the beginning, the study found that employees do not feel valued when they contribute to the improvement processes and that 100 per cent of the hourly male employees disagreed that ‘‘The Company considers the employees as the most important asset and will do whatever they can to keep their people’’. After a period of production observation at first sight was obvious that there was a high level of manual intervention, the speed of which was heavily dependent on the skill set of the operator. The overall effect was bottlenecks within the system and a subsequent reduction in output. With operations running in two shifts in winter period of the year, the additional output could not be achieved by the inclusion of extra shifts. Instead, attention to improving the speed of the production line and the cycle output, through implementation of some methods of lean concept is adopted. Continuous improvement is a core element in every production system and can be summarized as a company-wide focus to improve process performance; using gradual step by step improvement and organizational activities with the involvement of all people in the company, while creating a learning and growing environment [9]. Excellence today may not equal excellence tomorrow, excellence requires continual change. Based on that conclusion, case study was performed as line output improvement (Figure 2.). LOI was carried out through observing, measuring and final analyzing the results of work in order to: • • •
achieve allocation of production time presented with waterfall charts, establish the time required for completion of the work by a qualified worker when working at a defined level of performance, find area of concern and possible opportunity for improvement.
Figure 2. Steps of line output improvement
For successful implementation of line output improvement, support of whole organization is necessary, starting from head management down to line operators. It is of most importance to: • •
Explain the importance of improving line output. Equip each operator with the knowledge, skill and tools to improve production line output. • Describe the elements of measuring line efficiency. • Achieve understanding of Waterfall Diagrams, their role and usage. • Convince people in the organization about the oncoming results. This is very important because lean manufacturing involve in many rapid changes, and people are less resistant to the change when they see the results. Successful Lean application is conditioned by an evolutionary problem-solving ability of the rank and file. Such ability is in itself contingent on employee involvement in improvement programs and the implementation of appropriate practices [9]. Four improvement steps are presented, line design, 5S, line time study and action planning.
3. LINE DESIGN First of all it is important to identify: equipment, layout, production process, space and workers. Inside the bottling plant are four production lines, which produce different brands in different formats, and especially in smaller series charging there are frequent changes of formats and flavours of filling which requires following operations: 1. Shut Down – preparing for production stop 2. Clean On Place (COP) / Clean In Place (CIP) external/internal cleaning 3. Change Over (CHO) – change of format parts 4. Start Up – preparing for start of new production Understanding how line logic affects line efficiency is relevant. For example, in terms of line efficiency the filler represents the core machine as “Lead” speed
IJIEM
23
Veža et al.
reference of all equipment, so everything else is a constraint. If all the equipment would run at the same speed as the filler any stoppage on the line before the filler would mean a permanent gap in the line because the line would never catch up. Also, any stoppage on
the line after the filler would mean a bottle jam because the line becomes full. Therefore, to ensure continuous flow the filler must be the slowest machine on the line and all other production steps on line have to run faster than the filler (Figure 3.).
Figure 3. Bottling production line layout
4. 5S METHOD Most Lean manufacturing implementation begins with 5S implementation, especially on fields where benefit can be achieved in shortest possible time. 5S represents procedure for workshops and work cells design enabling achievement of full functionality on given space. The main purpose of 5S implementation is mostly orientated on micro level in manner of efficiency increase by maintenance of working space clear, properly arranged and accessible to operators. The 5S implementation gives employee a chance to enjoy in improved working environment, by their commitment and problem solving. 5S contains five elements derived from Japanese words beginning with S (Table 1).
used for implementation (Figure 4.). Red color marked materials require disposal in warehouse for this items, for additional checking for possibility of usage. Yellow color defines possibility of usage in next period, so label has to include date of marking. Green flag defines necessarily of material in next four weeks, and therefore they cannot be removed from working place. All marked materials are afterwards included in inventory list.
Table 1. Elements of 5S 1.
Sort
2.
Set in Order
3.
Shine
4.
Standardize
5.
Sustain
Sorting and putting in following groups: waste, rarely usable objects, and necessary objects Setting the location, the border-lines and signs to insure the return of the objects to the correct place Cleaning, painting, and regular cleaning Defining and standardization 5S working process, activities and tasks. Make 5S the way of living, institutional and organized
Figure 4. Application of marking method on shop floor
Set represents allocation of materials and tools on in advance dedicated place, to avoid unnecessary movements and searching during production process (Figure 5.).
Sorting, as a first column of visual working place, act requiring only necessary items on working place for production in one process step on given time. In case of beverage production there are large amount of accumulated material and shop floor becomes more buried, full cabinets represents wall for workers in search for specific format part and tool effort, inventory level in warehouse shows uncompleted amount of purchases material, and workshop becomes less flexible. Strategy of red marking, by labels or flags, was
IJIEM
Figure 5. Achievement of full functionality on given space
24
Veža et al.
Shine is related to cleaning and painting procedures, which enables light working place, without dust, and impurity. After tasks were dedicated to employees, visible posters were placed, with names, machines and spaces, for continuous cleaning process. Improvements, like transparent bags instead of paper boxes, for disposal of defective bottles for better handling, shown on Figure 6 are implemented.
Figure 6. Replacement of box with transparent bag for easy handling of scrap bottles
Standardization is often used to maintain first three presented steps, and can be defined as a result of successful 5S implementation. Standardization with visual 5S makes employee habits to maintain workplace clean, by returning of all unnecessary items back on dedicated space, without supervisor order. Sustain step presents a hard to reach goal for employees because of previous habits which were not in 5S direction. In many cases the problems occur: • • • • •
Unnecessary items starting to accumulate immediately after finishing sort step. Tools and materials are not being returned on visually dedicated space due to false conclusion of repetitive need in next period. Cleaning tasks are abandoned immediately. Parts get all over the workshop and transport ways, so they represent threat to safety. Because of dark and dirty working place, starting euphoria evaporating, and worker moral is rapidly decreasing.
4.1 The results of implementing the 5S method The implementation itself in the first two steps showed very good results. The measurable values of the results were increasing of finances (extra income) through accumulation of financial resources provided by selling the technically out of date, uneconomical and no longer in use means of work, and also increase of usable workplace by removing unnecessary materials. Apart from these economy results, during the realization of the first step of line output improvement other positive moves were made. As the increase of the employee motivation, the process of managing was easier, safety at work was also increased, etc. It should be pointed out that the above results were achieved without any additional costs, as they were the result of more efficient organization and coordination on the level of organizational units in which the case study was done.
Increased safety, productivity, space and resources utilization, and reduced transport distances and excessive movements gain the benefit.
5. LINE TIME STUDY Time studies are the foundation of any lean manufacturing process Knowing how to use time is invaluable to an organization and it is a good first step in creating a lean application. Time study has finally found a home in the modern plant by helping employees to understand the nature and the true costs of work, assist management in reducing unnecessary costs, and balance work cells to make work flow smoother [10]. It is important to understand that not only the work, but also the way and the time in which the work is carried out is important in lean manufacturing context. Time study is a structured process of directly observing and measuring, using a timing device: a) human work in order to establish the time required to complete the work by a qualified worker when working at a defined level of performance, b) machine work in order to record number of stops and the total stoppage time (downtime). To run a successful line time study the ideal number in the group would be three, positioned at the loading/depalletizing or blowing end of the line, palletizing end and the filling machine. The study time should be a minimum of eight hours, or a full shift. Much more information would be gathered by complete one shift study, especially if there is a start up, shutdown, change over and shift handover on the shift end. The data are analyzed after the study. Each stoppage 'reason' is categorized, the total number of stops from that cause recorded and the total stoppage time calculated. The number of stops is important because despite the total time shows a loss of five minutes, the number of stops could be as many as 10 to 15, due to, for example, caps jamming in the chute. The actual stoppage time is reduced because the filler operator is on-hand to rectify the fault quickly. The number of stops would define an area of concern and possible opportunity for improvement. In addition it is necessary to record distances, lead time, delays, quality problems, and number of operators, rework and other occurrences during production process.
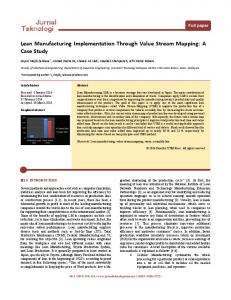
6. ACTION PLANING Time Study Methodology shows a round picture of whole process and forms waterfall chart of studied production period, e.g. week 5 of 2009 (Figure 7.). This study indicates where to look for areas for improvement. Rather than reacting to problems as they occur, avoiding problems in advance saves the company both more time and more money. The purpose of the summary of the study in form of waterfall diagram is to: • ensure clear and consistent allocation of production crew time, • determine overall equipment effectiveness.
IJIEM
25
Veža et al.
The principles used in the study are a proven methodology to identify sources of lost time or enefficiency and focus on their elimination. Speaking of lost time during production the most of it refers to equipment performance loss (EPL) which means that the production line stops due to electrical or mechanical
Asset Utilisation 100,0%
failure, and operational performance loss (OPL) where production line stops for operational reasons usualy material or personnel related. Speed loss present the allocation of time for the period that the production line is not run at the design speed.
Efficiency
Key Improovement areas
100,0% 28,6%
90,0%
100,0%
80,0%
1,4% 2,7% 3,4%
31,2%
4,4%
% Time Available
70,0%
4,6% 7,1%
60,0%
2,4%
1
50,0%
5,9% 0,7% 0,3% 56,3%
2
40,2% 40,0%
3
30,0%
20,0%
10,0%
SLE
Minor Stoppages
Speed losses
OPL
EPL
Change Over
Clean On Place
Clean In Place
Shut down
Start up
Maintenance
Paid Time
Output
Lost Time
Non-Scheduled Time
Capacity
0,0%
Figure 7. Production line performance shown as Waterfall Chart
It is necessary to identify the overall performance of each line over time and to compare the relative performance of all lines to understand which lines are improvement priorities. System line efficiency (SLE) measures the effectiveness of a line to operate and produce saleable product. First step is to calculate the theoretical number of hours that it would have taken to produce the actual number of saleable cases produced in the period based on the rated filler speed. It can be expressed as:
SLE of 56,3% is an call alert for improvement, in terms of creating a action plan (Table 2.) that we will be able to execute. Table 2. Corrective action plan for key improvement areas Key area
Delays
Action plan
1.
Start Up, Shut Down, CIP, COP
Identify the actions that need to be taken prior, maintenance of 5s standards, work standardization on each production step, state the checklists
2.
CHO
Maintenance of 5s standards, format parts shelves construction, standardization on each step, identifying appropriate dynamics of the people
3.
EPL, OPL
Identification of frequently breakdowns, employees training, preventive maintenance
(1) Second step is to compare machine standard time results with accumulated total number of hours in the production shifts (paid time) to get SLE: (2)
IJIEM
26
Veža et al.
d) The absence of knowledge about modern management (project and innovating management)
Results of Lean manufacturing implementation through accomplishing corrective action plan can be visible in very short period. For example, comparing the time of CHO for different filling formats (bottle types) before and after the application of action plan a significant time saving can be seen (Figure 8.).
These obstacles are not insuperable, but they require long-term education about the importance of managing the resources of which the organization disposes.
Figure 8. Change over improvement by identifying appropriate dynamics of the operators
The results case studies were reflected in drastic increase of safety, space utilization, production, pride and Kaizen thinking, and or the other hand, drastic reduce of waste, defects, errors, and unnecessary action. More important results can be expected in longterms. At the end of the study, when results become visible, workers resistant to the changes attenuate. Future research on this work could be to build a simulation model of the whole production line. Not only would simulation allow to exactly replicate production process in a controlled computerized environment, but also more importantly, allow the organization to quickly experiment with "what-if?" scenarios until the best solution was found.
CHO with one main operator and the help of another in specific previously planed moments (1+1 operator) bring savings of 15 minutes. Furthermore, CHO in a team of two operators working strictly by the corrective action plan bring saving of 45 minutes. Considering the speed of filling, for example 11000 bottles/hour savings can reach an extra time to fill 7750 bottles more. Of extreme importance is that the workers are informed about the results of the lean manufacturing aplications for improving line output because when results become visible, workers resistant to the changes attenuate.
8. REFERENCES [1]
Warnecke, H.J. (1992),“Die Fraktale Fabrik“, Springer Verlag, Berlin Heidelberg New York
[2]
Davidov, W. H., Malone, M. S. (1992),“ Unternehmen“, Campus Verlag, Frankfurt
[3]
Womack, J.P., Jones, D.T. and Roos, D. (1990),” The Machine that Changed the World”, Rawson, New York
[4]
Yang, K. and El-Haik, B. (2003), “Design for Six Sigma”, McGraw-Hill, New York
[5]
Hummer, M. and Champey, J. (1992), Reengineering”, Campus Verlag, Frankfurt
[6]
Stefanic, N., Tosanovic, N. and Cala, I. (2010), “Applying the Lean System in the Process Industry”, Strojarstvo: Journal for Theory and Application in Mechanical Engineering, Vol 52, No. 1, pp. 59-67.
[7]
Hines, P., Holweg, M. and Rich, N. (2004), “Learning to evolve”, International Journal of Operations & Production Management, Vol. 24 No.10, pp. 994-1011.
[8]
Kohl, H. and Depner, H. (2010), “The implementation of an organizational innovation: examples of mass customizing firms of the capital goods industry”, International Journal of Industrial Engineering and Management, Vol. 1, No 3, pp. 85-95
[9]
Angelis, J. J. and Femandes, B. (2007), “Advances in Production Management Systems”, IFIP International Federation for Information Processing, Volume 246, Olhager, J. and Persson, F. (eds.), Boston: Springer, pp. 347-354.
7. CONCLUSION In this paper, results of the case study of Lean production implementation in Croatian enterprises are presented. The implementation of lean concept was made through line output improvement. The first step was applying the 5S method to increase the efficiency on the micro-level, and rest of study was performing line output improvements through observing, measuring and final analyzing the results of work in order to establish the time required for completion of the work by a qualified worker when working at a defined level of performance. Allocation of time was presented with waterfall charts which indicate where to look for improvements. The main problems that came across during case studies were: a) The absence of clearly defined processes and interrupted directory chains. b) The Lean Production concept is developed in Toyota and it seems difficult to implement it in East Europe production systems, because of different organizational and social culture of enterprises and labor, c) The concepts related to Lean Production have been frequently misunderstood in those enterprises because of poor employees training and educational program.
Das
virtuelle
“Business
[10] Meyers, F.E. and Stewart J.R. (2002), “Motion and Time Study For Lean Manufacturing”, 3rd Edition, Prentice Hall
IJIEM