Learning Defect Predictors:Lessons from the Trenches
Learning Defect Predictors: Lessons from the Trenches Tim Menzies LCSEE, WVU
[email protected] October 28, 2008
1 / 40
Learning Defect Predictors:Lessons from the Trenches
Sound Bites
Static code features can be used to build software quality predictors. But they are a shallow well. We can easily get to the bottom. But further effort will not take us deeper. Unless we change the rules of the game.
2 / 40
Learning Defect Predictors:Lessons from the Trenches
Acknowledgments WVU Bojan Cukic, Zach Milton, Gregory Gay, Yue Jiang, Justin DiStefano, Supported by NSF grant #CCF-0810879 National Science Foundation, USA
Softlab (Bo˘ gazi¸ci University, Turkey) Ay¸se Bener, Burak Turhan Supported by Turkish Scientific Research Council (Tubitak EEEAG #108E014).
Scientific and Technological Research Council of Turkey
PSU: Jeremy Greenwald
Reference herein to any specific commercial product, process, or service by trademark, manufacturer, or otherwise, does not constitute or imply its endorsement by the Governments of Turkey or the United States. 3 / 40
Learning Defect Predictors:Lessons from the Trenches
PROMISE ’09
www.promisedata.org/2009 Motto: Repeatable, refutable, improvable Put up or shut up Papers ... ... and the data used to generate those papers www.promisedata.org/data Keynotes: Barry Boehm (USC) Brendan Murphy (Microsoft)
4 / 40
Learning Defect Predictors:Lessons from the Trenches What is “Defect Prediction”?
Outline
1 What is “Defect Prediction”? 2 Value of Defect Prediction 3 Variance and Ceiling Effects 4 Changing the Rules 5 Conclusions & Next Steps 6 References
5 / 40
Learning Defect Predictors:Lessons from the Trenches What is “Defect Prediction”?
Problem 100% quality assurance (QA) is infinitely expensive Tests(Conf , ErrRate) =
log (1−Conf ) log (1−ErrRate)
Test engineers, skew QA towards what is most critical: e.g. model checking restricted to the kernel of the guidance system But if we only look at {A,B,C}.... ... what hides in the blind spot of {E,F,G,...}? Proposal: Augment focused expensive QA methods with cheaper faster methods But how to sampling methods blind spots? quickly cheaply 6 / 40
Learning Defect Predictors:Lessons from the Trenches What is “Defect Prediction”?
One Solution: Data Mining Input: rows of data
name tim tim tim tim
features age shoeSize 48 11 12 5 28 9 100 11
class mood happy sad happy happy
Learners: Naive Bayes: statistical feature combinations for class prediction RIPPER : learns rules C4.5 : decision tree learner Random Forests : learn 100s of trees etc Output: combinations of features that predict for the class
7 / 40
Learning Defect Predictors:Lessons from the Trenches What is “Defect Prediction”?
Solution: the Details
Using data mining: explore the “modules” smallest functional unit ∈ {function, method, class, ...} Take logs of modules described as static code modules: Lines of code and comment measures Counts of intra-module symbols (Halstead [1977]); Measures of intra-module call graphs (McCabe [1976]); Join the logs to number of defects seen in each module often, discretized to {yes, no}; Find feature combinations that predict for defective ∈ {yes, no};
8 / 40
Learning Defect Predictors:Lessons from the Trenches What is “Defect Prediction”?
Examples of Static Code Features m = Mccabe
locs
loc loc(other)
Halstead
h
H
v (g ) cyclomatic complexity iv (G ) design complexity ev (G ) essential complexity loc total (one line = one count loc blank loc code and comment loc comments loc executable number of lines (opening to closing brackets) N1 num operators N2 num operands µ1 num unique operators µ2 num unique operands N length: N = N1 + N2 V volume: V = N ∗ log2 µ L level: L = V ∗ /V where V ∗ = (2 + µ2 ∗ )log2 (2 + µ2 ∗ ) D difficulty: D = 1/L ˆ ∗ V where I content: I = L ˆ = 2 ∗ µ2 L µ1 N2 ˆ E effort: E = V /L B error est T prog time: T = E /18 seconds
9 / 40
Learning Defect Predictors:Lessons from the Trenches What is “Defect Prediction”?
Why Do That? Useful: out-performs known industrial baselines at defect detection: IEEE Metrics’02 panel: manual software reviews finds ≈60% (Shull et al. [2002]); Raffo (pers. comm.): industrial review methods find pd = TR(35, 50, 65)% Data mining static code features finds (median) 71% (Menzies et al. [2007]).
Easy to use: Automatic, cheap and fast to collect, scales to large systems. Manual methods: 8-20 LOC/minute for manual code reviews. Widely used: Hundreds of research papers. Earliest: Porter and Selby [1990]? Recommended by numerous texts Large government contractors: only review modules that trigger a static code analyzer 10 / 40
Learning Defect Predictors:Lessons from the Trenches What is “Defect Prediction”?
Why Use Static Code Features?
Why not use... knowledge of the developers (Nagappan et al. [2008]) Or history of runtime defectives (Musa et al. [1987]) Or XYZ? A: Use whatever is available And that changes from site to site I dream of the day that I work with an organization with stable products and practices. Meanwhile, in the real world...
11 / 40
Learning Defect Predictors:Lessons from the Trenches What is “Defect Prediction”? Menzies et al. [2008a]
Dealing with Organizational Change year 1988 1991 1994 1995 1996 1996 1997 1998 1999 2000 2001 2002 2003 2004 2005 2006 2007
#IV&V project n/a n/a 1 1 2 3 3 3 12 15 20 36 42 37 24 26 24
notes Space shuttle begins IV&V New the IV&V facility International space station IV&V begins
oversight Johnson (Texas) Headquarters (east coast)
NASA Ames (west coast) IV&V funded from project budgets
IV&V now considered on all software GSFC (east coast)
IV&V funded from central agency source. SILAP data collection begins SILAP data collection ends
2003: Loss of Columbia ⇒ “return to flight” reorganization 2004: Bush’s new vision for space exploration Always: layers of contractors; so “oversight”, not “insight” 12 / 40
Learning Defect Predictors:Lessons from the Trenches What is “Defect Prediction”?
The Real Question
Not what features “are right”; But what features are available “right now”. Particularly when you can not control data collection Agile Out-source Open source Sub-contractors Your current project? Sometimes, all you can access “right now” is source code.
13 / 40
Learning Defect Predictors:Lessons from the Trenches Value of Defect Prediction
Outline
1 What is “Defect Prediction”? 2 Value of Defect Prediction 3 Variance and Ceiling Effects 4 Changing the Rules 5 Conclusions & Next Steps 6 References
14 / 40
Learning Defect Predictors:Lessons from the Trenches Value of Defect Prediction Fenton and Pfleeger [1997], Shepperd and Ince [1994]
Aren’t Static Code Features.... Stupid? m = Mccabe
locs
loc loc(other)
Halstead
h
H
v (g ) cyclomatic complexity iv (G ) design complexity ev (G ) essential complexity loc total (one line = one count loc blank loc code and comment loc comments loc executable number of lines (opening to closing brackets) N1 num operators N2 num operands µ1 num unique operators µ2 num unique operands N length: N = N1 + N2 V volume: V = N ∗ log2 µ L level: L = V ∗ /V where V ∗ = (2 + µ2 ∗ )log2 (2 + µ2 ∗ ) D difficulty: D = 1/L ˆ ∗ V where I content: I = L ˆ = 2 ∗ µ2 L µ1 N2 ˆ E effort: E = V /L B error est T prog time: T = E /18 seconds
v (g ) correlated to LOC “For a large class of software ((v (g )) is no more than a proxy for, and in many cases outperformed by, lines of code” – Shepperd & Ince
15 / 40
Learning Defect Predictors:Lessons from the Trenches Value of Defect Prediction Turhan et al. [2008]
So What Would Happen if... We learned defect predictors from NASA aerospace applications Then applied them to software developed for Turkish whitegoods? (Caveat: in both studies, same data dictionary but different data.)
source NASA NASA NASA NASA NASA NASA NASA SOFTLAB SOFTLAB SOFTLAB
project cm1 pc1 mc2 mw1 kc1 kc2 kc3 ar5 ar3 ar4
language C++ C++ C++ C++ C++ C++ JAVA C C C
description Spacecraft instrument Flight software for earth orbiting satellite Video guidance system A zero gravity experiment related to combustion Storage management for ground data Storage management for ground data Storage management for ground data Washing machine Dishwasher Refrigerator
Begin digression: how do we measure performance?
16 / 40
Learning Defect Predictors:Lessons from the Trenches Value of Defect Prediction Turhan et al. [2008]
Performance Measures {A, B, C , D} = true negatives, false negatives, false positives, and true positives (respectively) found by a binary detector.
pd = recall = pf = prec = precision = acc = accuracy = neg /pos =
D B+D C A+C D D+C A+D A+B+C +D A+C B+D
For large neg /pos values: can be accurate and still miss most things
signal detected? Acc =
no yes
module found in defect logs? no yes A = 395 B = 67 C = 19 D = 39 accuracy =
83%
pf =
Prob.falseAlarm =
5%
pd =
Prop.detected =
37%
End digression.
17 / 40
Learning Defect Predictors:Lessons from the Trenches Value of Defect Prediction Turhan et al. [2008]
Results For learner=Naive Bayes (why? see later), try “round robin” or “self-” learning RR= “Round robin” : train on them, test on me. ‘Self” : train and test on me
RR self RR
Data source Imported data Local data Filtered imported data
Train all X - Xi 90% of Xi k-nearest of (all X - Xi )
Test Xi 10% of Xi Xi
Probability False Detection Alarm 94 ( ! ) 68 75 29 69 27
Best data source: local data Adequate: using imported data (filtered with nearest neighbor) Recommendations: If no data, start local collection Meanwhile, use imported data, filtered with nearest neighbor Question: how much data is needed to build local detectors? 18 / 40
Learning Defect Predictors:Lessons from the Trenches Variance and Ceiling Effects
Outline
1 What is “Defect Prediction”? 2 Value of Defect Prediction 3 Variance and Ceiling Effects 4 Changing the Rules 5 Conclusions & Next Steps 6 References
19 / 40
Learning Defect Predictors:Lessons from the Trenches Variance and Ceiling Effects Menzies et al. [2007]
What is “The” Best Feature? Experiments with N¨ aive Bayes: While performance improved, add features.
data pc1 mw1 kc3 cm1 pc2 kc4 pc3 pc4 all
pd 48 52 69 71 72 79 80 98 71
pf 17 15 28 27 14 32 35 29 25
index of selected feature 3, 35, 37 23, 31, 35 16, 24, 26 5, 35, 36 5, 39 3, 13, 31 1, 20, 37 1, 4, 39
ID used in what 1 2 loc blanks 3 2 call pairs 4 1 loc code and command 5 2 loc comments 13 1 edge count 16 1 loc executable 20 1 I 23 1 B 24 1 L 26 1 T 31 2 node count 35 3 µ2 36 1 µ1 37 2 number of lines 39 2 percent comments H’ = derived Halstead h = raw Halstead
type locs misc locs locs misc locs H’ H’ H’ H’ misc h h locs misc
Why no single most valuable feature? 20 / 40
Learning Defect Predictors:Lessons from the Trenches Variance and Ceiling Effects Menzies et al. [2007]
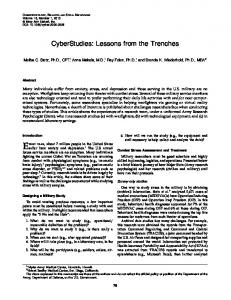
Feature Information Variance 10 * { 90% sample, compute “info gain” of each feature}
InfoGain(Ai)
0.100 0.075 0.050 0.025 0 1
8
16 24 Attributes Ai, sorted by InfoGain
32
38
High left-hand-side plateau (multiple candidate “best” features) Low right-hand-side valley (small set of “always worst” features) Never again: v (g ) > 10.
21 / 40
Learning Defect Predictors:Lessons from the Trenches Variance and Ceiling Effects Jiang et al. [2007]; Lessmann et al. [2008]
Value of Better Data Miners? Ceiling effects: an inherent upper bound on the performance of our data miners Have yet to improve our mid-2006 defect predictors: Menzies et al. [2007]
6/9 methods are “best”
14/19 methods are “best”
Note: evaluation bias- area under the curve of a detection vs false alarm plot AUC(PD, PF) 22 / 40
Learning Defect Predictors:Lessons from the Trenches Variance and Ceiling Effects Menzies et al. [2008b]
Value of More Data? Learner = NB Randomized order ; train on “X”; test on next 100 KC1
PC1 1.0 balance
0.5
0.5 800
1000
600
400
0
2000
500
0
1500
0 1000
0
200
balance
1.0
Micro-sampling: N defective + N non-defective, N ∈ {25, 50, 75, ...} KC1
PC1 100 balance
50
160
140
120
100
80
60
40
0
700
600
500
400
300
200
0
0 100
0
50
20
balance
100
Statistically, little gain after 100 (random) or 50 (micro-sampling)
23 / 40
Learning Defect Predictors:Lessons from the Trenches Variance and Ceiling Effects Lessmann et al. [2008]
End of the Line?
“...the importance of the (learner) is less than generally assumed and practitioners are free to choose from a broad set of candidate models when building defect predictors.” – Lessmann et al. No value in new algorithms for defect prediction? Not unless we change the rules of the game
24 / 40
Learning Defect Predictors:Lessons from the Trenches Changing the Rules
Outline
1 What is “Defect Prediction”? 2 Value of Defect Prediction 3 Variance and Ceiling Effects 4 Changing the Rules 5 Conclusions & Next Steps 6 References
25 / 40
Learning Defect Predictors:Lessons from the Trenches Changing the Rules Menzies et al. [2007a]
PD= probability of detection
Generalized Evaluation Bias preferred curve risk-adverse region
1 0.75
costadverse region PF=PD=no information
0.5 0.25 0
0
0.25 0.5 0.75 PF= probability of false alarm
1
pd hi med
pf hi lo
Risk adverse (e.g. airport bomb detection, morning sickness) Cost adverse (e.g. budget conscious) Arisholm and Briand [2006] #
negative curve
effort#
< pd
effort = LOC in the modules predicted to be faulty
26 / 40
Learning Defect Predictors:Lessons from the Trenches Changing the Rules Milton [2008]
Evaluation-aware Learners
All learners have an search bias S and an evaluation bias E . e.g. C4.5: S = infogain E = pd,pf,accuracy, etc Note: usually, S 6= E Question: What if we make S = E ? Answer: Milton [2008]
27 / 40
Learning Defect Predictors:Lessons from the Trenches Changing the Rules Milton [2008]
Evaluation-aware Learning with “WHICH” 1.0
2 Sort all ranges using E onto a stack 3 Pick any 2 items near top-of-stack
Top-of-stack score
1 Discretize all numeric features.
4 Combine items, score them with E , insert them into the sorted stack. 5 Goto 3 Note: no S; E is customizable.
0.8 0.6 A 0.4 0.2 0 1
10 100 Number of picks
1000
Top of stack stabilizes quickly (UCI data).
Other methods can bias learner predictions: Apply E during decision tree splitting Elkan [2001]: cost-sensitive learning (*) Fawcett [2001]: ROC ensemble combinations (*) (*) But what work if search criteria is orthogonal to the evaluation criteria? 28 / 40
Learning Defect Predictors:Lessons from the Trenches Changing the Rules Milton [2008]
Experiments with “WHICH” Arisholm and Briand [2006] For a budget-conscious team,
then that defect predictor is not useful i.e. they prefer pd > effort
80
im in
m
an
um
ua
l
good 60
m
but they contain ≤ X % of the detects,
best PD (% probability of detection)
if X% of modules predicted to be faulty
A=30
100
40 bad 20
Operationalizing their bias: Find modules triggered by the learner
0 0
20 40 60 80 Effort (% LOC inspected)
100
Sort them in ascending order of size Assume human inspectors find ∆ of the defects in the triggered modules
“bad” : worse than manual “good” : beats manual
Score learner as ratio of “best” effort-vs-pd curve “best” only triggers on defective modules Note : ∆ cancels out 29 / 40
Learning Defect Predictors:Lessons from the Trenches Changing the Rules Milton [2008]
Experiments with “WHICH” 10 random orderings * 3-way cross-val 10 sets of static code features from NASA, Turkish whitegoods “Rank” computed using Mann-Whitney U test (95%) Micro20: training on 20 defective + 20 non-defective rank treatment
median “best”%
1
WHICH
87.3
2
micro20
76.3
3
NB
64.2
3
manual
64.2
4
C4.5
23.1
4
jRip
17.7
2nd quartile, median, 3rd quartile
s
s s
s
s
s
50%
Shallow well: we do not need much data to do it (40 examples).
30 / 40
Learning Defect Predictors:Lessons from the Trenches Conclusions & Next Steps
Outline
1 What is “Defect Prediction”? 2 Value of Defect Prediction 3 Variance and Ceiling Effects 4 Changing the Rules 5 Conclusions & Next Steps 6 References
31 / 40
Learning Defect Predictors:Lessons from the Trenches Conclusions & Next Steps
But Why does it Work so Well? Related question: Why does IR work so well? Same answer for both questions? Is our technical work constrained by: compilers, languages, target domains, human short-term memory, etc What is this invisible hand? 32 / 40
Learning Defect Predictors:Lessons from the Trenches Conclusions & Next Steps
F.A.Q.
Are defect predictors useful? As a method to reduce the cost of more expensive QA, yes. Are defect predictors general? Yes: after NN, NASA & SOFTLAB’s predictors work on each other’s site But learning from local data is best. How much data is needed? Dozens to under 100 for micro-sampling to random sampling
33 / 40
Learning Defect Predictors:Lessons from the Trenches Conclusions & Next Steps
F.A.Q. (more)
Which learner is best for building defect predictors? When maximizing PD-vs-PF, there are many choices. Otherwise, tune learner to local evaluation bias (e.g. WHICH) What is the “best” feature? Wrong question. “Best” is domain-specific. Collect everything that is readily and cheaply available
34 / 40
Learning Defect Predictors:Lessons from the Trenches Conclusions & Next Steps
Research Directions: NSF CCF funding We have seen above that the “best” features are data set dependent. Due to feature information variance So lets look harder at exploiting local knowledge. Microsoft example Given the small samples needed for learning detectors (dozens to 100) Augment (? replace) data mining ... with human-in-the-loop case-based-reasoning Do you think that with your domain expertise you can do better than stupid static features? Then lets talk some. 35 / 40
Learning Defect Predictors:Lessons from the Trenches Conclusions & Next Steps
And Finally..
Static code features can be used to build software quality predictors. But they are a shallow well. Easily get to the bottom With ≤ 100 examples. Further effort will not take us deeper Ceiling effects on AUC(Pd,Pf). Unless we change the rules of the game: Using evaluation aware learning Augment data mining with human-in-the-loop
36 / 40
Learning Defect Predictors:Lessons from the Trenches References
Outline
1 What is “Defect Prediction”? 2 Value of Defect Prediction 3 Variance and Ceiling Effects 4 Changing the Rules 5 Conclusions & Next Steps 6 References
37 / 40
Learning Defect Predictors:Lessons from the Trenches References
References
E. Arisholm and L. Briand. Predicting fault-prone components in a java legacy system. In 5th ACM-IEEE International Symposium on Empirical Software Engineering (ISESE), Rio de Janeiro, Brazil, September 21-22, 2006. Available from http://simula.no/research/engineering/publications/Arisholm.2006.4. Charles Elkan. The foundations of cost-sensitive learning. In Proceedings of the Seventeenth International Joint Conference on Artificial Intelligence (IJCAI01), 2001. Available from http://www-cse.ucsd.edu/users/elkan/rescale.pdf. Tom Fawcett. Using rule sets to maximize roc performance. In 2001 IEEE International Conference on Data Mining (ICDM-01), 2001. Available from http://home.comcast.net/~tom.fawcett/public_html/papers/ICDM-final.pdf. N. E. Fenton and S.L. Pfleeger. Software Metrics: A Rigorous & Practical Approach. International Thompson Press, 1997. M.H. Halstead. Elements of Software Science. Elsevier, 1977. Y. Jiang, B. Cukic, and T. Menzies. Fault prediction using early lifecycle data. In ISSRE’07, 2007. Available from http://menzies.us/pdf/07issre.pdf. S. Lessmann, B. Baesens, C. Mues, and S. Pietsch. Benchmarking classification models for software defect prediction: A proposed framework and novel findings. IEEE Transactions on Software Engineering, 2008. T.J. McCabe. A complexity measure. IEEE Transactions on Software Engineering, 2(4):308–320, December 1976. ISSN 0098-5589.
38 / 40
Learning Defect Predictors:Lessons from the Trenches References
References (more)
T. Menzies, M. Benson, K. Costello, C. Moats, M. Northey, and J. Richarson. Learning better IV&V practices. Innovations in Systems and Software Engineering, March 2008a. Available from http://menzies.us/pdf/07ivv.pdf. T. Menzies, B. Turhan, A. Bener, G. Gay, B. Cukic, and Y. Jiang. Implications of ceiling effects in defect predictors. In Proceedings of PROMISE 2008 Workshop (ICSE), 2008b. Available from http://menzies.us/pdf/08ceiling.pdf. T. Menzies, J. Greenwald, and A. Frank. Data mining static code attributes to learn defect predictors. IEEE Transactions on Software Engineering, January 2007. Available from http://menzies.us/pdf/06learnPredict.pdf. Tim Menzies, Alex Dekhtyar, Justin Distefano, and Jeremy Greenwald. Problems with precision. IEEE Transactions on Software Engineering, September 2007a. http://menzies.us/pdf/07precision.pdf. Z.A. Milton. The WHICH Stochastic Rule learner. Master’s thesis, Lane Department of Computer Science and Electrical Engineering, WVU 2008.
39 / 40
Learning Defect Predictors:Lessons from the Trenches References
References (yet more)
J. Musa, A. Iannino, and K. Okumoto. Software Reliability: Measurement, Prediction, Application. McGraw Hill, 1987. N. Nagappan, B. Murphy, and Basili V. The influence of organizational structure on software quality: An empirical case study. In ICSE’08, 2008. A.A. Porter and R.W. Selby. Empirically guided software development using metric-based classification trees. IEEE Software, pages 46–54, March 1990. M. Shepperd and D.C. Ince. A critique of three metrics. The Journal of Systems and Software, 26(3):197–210, September 1994. F. Shull, V.R. Basili ad B. Boehm, A.W. Brown, P. Costa, M. Lindvall, D. Port, I. Rus, R. Tesoriero, and M.V. Zelkowitz. What we have learned about fighting defects. In Proceedings of 8th International Software Metrics Symposium, Ottawa, Canada, pages 249–258, 2002. Available from http://fc-md.umd.edu/fcmd/Papers/shull_defects.ps. B. Turhan, A. Bener, and T. Menzies. Nearest neighbor sampling for cross company defect predictors. In Proceedings, DEFECTS 2008, 2008.
40 / 40