DIVISION OF THE HUMANITIES AND SOCIAL SCIENCES
CALIFORNIA INSTITUTE OF TECHNOLOGY PASADENA, CALIFORNIA 91125
LEARNING DYNAMICS IN MECHANISM DESIGN: AN EXPERIMENTAL COMPARISON OF PUBLIC GOODS MECHANISMS
ST
IT U T E O F
EC Y
C
AL
1891
HNOLOG
IF O R NIA
N
T
I
Paul J. Healy California Institute of Technology
SOCIAL SCIENCE WORKING PAPER 1182 November 2003
Learning Dynamics in Mechanism Design: An Experimental Comparison of Public Goods Mechanisms Paul J. Healy
Abstract In a repeated-interaction public goods economy, dynamic behavior may affect the efficiency of various mechanisms thought to be efficient in one-shot games. Inspired by results obtained in previous experiments, the current paper proposes a simple best response model in which players’ beliefs are functions of previous strategy profiles. The predictions of the model are found to be highly consistent with new experimental data from five mechanisms with various types of equilibria. Interesting properties of a 2parameter Vickrey-Clarke-Groves mechanism help to draw out this result. The simplicity of the model makes it useful in predicting dynamic stability of other mechanisms. JEL classification numbers: C72, C91, D83, H41 Key words: Mechanism design, experiments, best response, public goods, dynamics
Learning Dynamics in Mechanism Design: An Experimental Comparison of Public Goods Mechanisms∗ Paul J. Healy†
1
Introduction
There exists a large number of mechanisms that implement Pareto optimal allocations in public goods economies. Given the problem of selecting a particular mechanism for a public goods problem in which the level of the good must be re-evaluated at regular intervals, one would like to know which mechanisms converge quickly to the equilibrium outcome and which may cycle or diverge in the repeated setting. Behavioral models are typically suited for games with finite strategy spaces that are difficult to apply to direct mechanisms without imposing an arbitrary grid structure on decisions whose coarseness may significantly affect the dynamics of the model. For predicting convergence in the current application, a tractable model of behavior in a repeated game settings is more desirable. In the current paper, five public goods mechanisms with various equilibrium properties are experimentally tested in a repeated play setting and observed behavior approximates a simple model in which agents best respond to beliefs formed by the unweighted average of the previous few periods. In particular, the predictions of this model provide a significant improvement in accuracy of prediction over the static stage game equilibrium prediction. This result holds if the mechanism is efficient or inefficient and if the equilibrium is in dominant strategies or not. Although this simple model does not perfectly track behavior, it is useful in predicting convergence and therefore may provide a selection criterion for the mechanism designer interested in implementing Pareto optimal outcomes in the repeated public goods setting. Five public goods mechanisms with different equilibrium properties are compared in an identical laboratory environment. These are the Voluntary Contribution, Proportional Tax (with voluntary contributions,) Groves-Ledyard, Walker, and cVCG (Vickrey-Clarke ∗
The author wishes to thank John Ledyard for financial support, advice, and encouragement in writing this paper, as well as Ken Binmore, Matt Jackson, Tim Cason, Bob Sherman, Ivana Komunjer, Peter Bossaerts, Tatsuyoshi Saijo, and David Grether for their valuable suggestions and comments. † Division of the Humanities and Social Sciences, California Institute of Technology, Pasadena, CA 91125. Email:
[email protected].
Groves with a continuum of possible public goods levels) mechanisms1 . The conclusions of this paper are as follows. The data in all five mechanisms are consistent with a best response model in which agents maximize utility given that the belief that the strategy profile played by other agents in the current period will equal the average strategy profile over a small number of previous periods. Predictive power of this model is significantly greater than that of the static stage game equilibrium assumption. Behavior in the cVCG mechanism converges close to the efficient equilibrium with over half of the subjects choosing truthful revelation and nearly all others playing weakly dominated best response strategies. The Groves-Ledyard mechanism converges close to equilibrium, as does the Voluntary Contribution mechanism. The Proportional Tax mechanism does not systematically converge and the Walker mechanism behavior fails to converge. Furthermore, all strategy profiles observed to be stable or asymptotically stable are ε-equilibrium strategy profiles. All of these qualitative observations are consistent with the best response model. In the current environment, the cVCG mechanism is found to be the most efficient and stable, while the payoffs in the Walker mechanism are often worse than that of the initial endowments. The scope of this set of public goods mechanism experiments is arguably larger than any to date since five mechanisms are compared in identical environment; see Chen [8] for a survey of previous experiments.
2
Previous Experiments
The following discussion highlights the fact that previous experimental results in public goods mechanisms appear to be consistent with a best response behavioral model. The large set of experiments in the current paper tests this hypothesis directly by comparing behavior across a wide variety of mechanisms. In the decades since the theoretical development of public goods mechanisms, experimental tests have focused primarily on Nash mechanisms. In particular, the GrovesLedyard mechanism has been studied by several authors in repeated one-shot laboratory tests. Under a sufficiently high punishment parameter, strategies converge rapidly to equilibrium. Chen and Plott [6] study the effect of this parameter and Chen and Tang [7] compare the Groves-Ledyard mechanism to the Walker mechanism. The results of these studies imply that the Groves-Ledyard mechanism significantly outperforms the Walker mechanism, apparently due to the dynamic instability of the Walker mechanism that is observed in actual subject behavior as well as in many theoretical models of behavioral dynamics. The first well-controlled public goods test of the Pivot mechanism (the VCG mechanism with a binary public good) is given by Attiyeh, Franciosi and Isaac [1]. Subjects are given positive or negative values for a proposed project and must submit a message 1
The cVCG mechanism is in contrast to the “Pivot” version of the VCG mechanism in which a binary public project is either funded or scrapped depending upon the reported valuations of the agents in the economy.
2
indicating their demand for the project. For example, large negative messages represent strong opposition to the project. Here, around ten percent of observed strategies were demand-revealing, with thirteen of twenty subjects never revealing their true value. A regression of bids on values indicates that players with extreme preferences tend to understate the magnitude of their demand and players with preferences near indifference tend to overstate their demand. Kawagoe and Mori [24] extend the Attiyeh et al. result by comparing the above treatment to one in which subjects are given a payoff table. The effect of having players choose from the table is significant, as demand revelation increases to 47%. The authors argue that the weak nature of the dominant strategy prevents all subjects from finding their equilibrium strategy since non-revelation strategies may also be best responses2 . In an unpublished pilot experiment run by Kawagoe and Mori (“A Short Report on Pivotal Mechanism Experiment”, Nagoya City University, 1999), the cVCG mechanism with strictly concave utilities is tested in an environment where subjects first participate in the mechanism without a detailed payoff table and again with the table. Instead of submitting their value as in the Pivot mechanism, agents report the intercept of their marginal valuation curve, which is given to be linear with an identical slope for all agents. The demand revelation frequencies in this experiment are similar to those in Pivot mechanism with and without the payoff table, which is particularly surprising given that a grid of only 11 strategies was imposed on the strategy space. The ten percent of observations in which subjects reveal their true intercept parameter without a payoff table is therefore consistent with completely random behavior, possibly indicating significant confusion among subjects. Most recently, Cason, Saijo, Sjostrom and Yamato [5] compare the Pivot and cVCG mechanisms and show that deviations from truthful revelation, when they occur, tend to result in non-dominant Nash equilibria that are outcome equivalent to the dominant strategy equilibrium. The Pivot mechanism is as in previous studies, but agents in the cVCG mechanism are given single-peaked Euclidean preferences and report only their ideal point. In both sessions, players are given detailed payoff tables and are asked to choose their strategy from the columns of the table. The underlying public goods problem and mechanism are not explained to the subjects. The game is played as a two-player game in rotating, anonymous pairings rather than the typical five-player treatments seen in the previous studies. Half of the observed pairings play a dominant strategy equilibrium in the Pivot mechanism and 81 percent of pairings do so in the cVCG mechanism3 . In the Pivot mechanism, if both subjects randomly deviate from dominant strategies uniformly across the strategy space then approximately half of the observations would be Nash equilibria. Since two-thirds of observed non-dominant strategy observations 2
Although not mentioned in the paper, the data reveal that 25% of observations have the wrong sign, where agents with positive values bid against the project or vice versa. This indicates that there may be confusion among the subjects about the workings of the mechanism. 3 By the discreteness of the game, there are actually four dominant strategy equilibria. Since players are not given the underlying context of the environment, the concept of demand revelation is a bit ambiguous, so dominant strategy play is considered equivalent to revelation.
3
are Nash equilibria, there exists a tendency toward Nash equilibria in the absence of dominant strategy play. In this game form, if only one subject plays his dominant strategy while the other overstates her value, the outcome will be in the interior of a large set of Nash equilibria4 . The good is produced in the dominant strategy equilibrium with the given parameters, so that one player overstating her value has no affect on the outcome while understating her value will reduce her payoff. With this insight, the high frequency of non-dominant Nash equilibrium observations can be explained by deviations of only one player that are payoff equivalent to the dominant strategy. Behaviorally, this explanation is consistent with an evolutive model where agents play any payoff maximizing strategy rather than an eductive model where agents solve for the equilibria of the game. The results of existing studies imply that dynamically stable Nash equilibria and strict dominant strategy equilibria are good predictors of behavior in public goods mechanisms (and perhaps in other similar game forms,) but Nash mechanisms with poor stability properties in fact produce unstable behavior. Also, payoff-equivalent strategies may be chosen over a weak dominant strategy equilibrium. These behaviors are consistent with a best response model in which beliefs are functions of the history of the game. If beliefs in such a model are consistent with actual play, then the model predicts Nash equilibrium play. If beliefs in repeated games are simply the strategies observed in the previous one period, for example, then behavior follows a Cournot best response dynamic5 . In the Walker mechanism, the Nash equilibrium is not an asymptotic attractor of the one-period best response dynamic6 . In the Groves-Ledyard mechanism and the one-parameter cVCG mechanism with strictly concave utilities, the best response model converges to the equilibrium prediction. In the Pivot mechanism, the dominant strategy equilibrium is not asymptotically stable since there always exist strategies that are payoff equivalent to truthful revelation in any interval containing the truth-telling point. Thus, the convergence predictions of history-dependent best response models coincide nicely with the previous experimental results.
3
Setup and Environment
The general environment in use is as follows. A set of N = {1, . . . , n} agents have preferences for consumption of a private good x = (x1 , . . . , xn ) and a single public good y, 4
In the two-dimensional strategy space, the dominant strategy pair is located just inside the corner of a large rectangular set of strategy pairings that are Nash equilibria. 5 The previous literature on dynamics in games is inconclusive about which dynamic model best describes actual behavior. Boylan and El-Gamal (1993) compare nine experiments statistically and find that the one-period best response and the fictitious play dynamics each fit better to certain experimental results, but neither appears to be unequivocally the better model across experiments. 6 In simulations based on the parameters used in the current set of experiments, the Nash equilibrium appears to be a local attractor for best response models that form beliefs over a larger number of previous periods since the dynamic path converges to a periodic oscillation around the Nash equilibrium. However, the behavior is oscillatory and does not dampen, so the rest point is not an asymptotic attractor.
4
which can be represented by the differentiable function ui (y, xi |θi ), where θi ∈ Θi indicates the vector of utility parameters held by agent i ∈ N . The set of all such parameters is given by Θ ≡ ×ni=1 Θi . Preferences are assumed throughout to be quasilinear, so that ui (xi , y|θi ) ≡ vi (y|θi ) + xi where vi (y|θ) is strictly concave in y. A public gods allocation is a (n + 1)-tuple of the form (y, x1 , . . . , xn ) where y ≥ 0 is the level of public good produced and xi is the amount of private good consumed by agent i ∈ N . No public good exists initially, although a technology can be used to build y units of the public good at a cost of c (y) units of the private good. In the current study, a constant marginal cost κ is assumed with c (0) = 0, so that c (y) = κy. Given an initial endowment of the private good ωi , consumption of the private good is given by xi = ωi −τi for each i, where τi represents a transfer payment paid by agent i. Therefore, the public goods allocation is equivalently expressed as (y, τ1 , . . . τn ). Individual budget constraints are not imposed in the following P analysis, so that τi may be larger than ωi . A vector of transfer payments is feasible if i∈N τi ≥ κy and budget balanced if the constraint is met with equality. A mechanism is given exogenously as a game form, indexed by g, in which agents use their private information θi to choose a message mg,i from a convex strategy space Mg,i . The vector of all messages is denoted mg ∈ Mg ≡ ×ni=1 Mg,i . When there is no confusion, the g subscript will be dropped. For a given agent i and a vector of messages m−i ≡ (m1 , . . . , mi−1 , mi+1 , . . . , mn ), a best response message for agent i is that which maximizes i’s utility under the assumption that the other agents send messages m−i . The set of best responses to m−i in mechanism g is denoted by Bg,i (m−i |θi ). Define Bg (m, θ) ≡ ×ni=1 Bg,i (m−i |θi ) to be the set of message profiles that are best responses to the profile m. Any fixed point of the best response profile mapping is a Nash equilibrium strategy profile of the game. Thus, the Nash equilibrium solution concept selects a set of equilibrium messages dependent upon the preference parameters θ. The equilibrium strategies are denoted m∗ (θ) = (m∗1 (θ) , . . . , m∗n (θ)), where m∗ (θ) ∈ {m0 ∈ M |m0 ∈ B (m0 , θ)} Note that this solution concept requires each player’s equilibrium strategy to be a function of the other players’ types if m∗i varies with θj for j 6= i. If the equilibrium message does not depend on the types of other agents, the Nash equilibrium is in dominant strategies. The vector of received messages m in mechanism g maps to a unique outcome of the form ηg (m) ≡ (yg (m) , τg (yg (m) , m, κ)) where yg : Mg → R+ determines the level of the public good chosen and τg : R+ × Mg × R+ → Rn determines the vector of transfer payments of the private good to be paid by each agent7 . The strategy space (inputs) and outcome function (outputs) completely characterize the mechanism. All mechanisms considered here are feasible and some are budget balanced. 7
Set-valued mechanisms may be defined, but implementation in this context is assumed to require the selection of a unique outcome.
5
The objective of the mechanism designer is to implement a social choice correspon¡ ¢ dence f : Θ ³ R+ × Rn with certain desirable properties. Let y f (θ) , τ f (θ) ∈ f (θ) represent a particular public goods allocation satisfying the properties for preference parameters θ. In the public goods environment, the appropriate social choice correspondence for ¢a utilitarian planner picks the set of Pareto optimal allocations given by ¡ P P y (θ) , τ (θ) , where " n # X P y (θ) ∈ arg max vi (y|θi ) − c (y) y∈R+
i=1
and τ P (θ) satisfies budget balance. A mechanism g implements f if ηg (m∗ (θ)) ∈ f (θ) for all θ ∈ Θ. If f (θ) is the set of Pareto optimal allocations, then a mechanism that implements it is said to be efficient. If yg (m∗ (θ)) ∈ y P (θ) and τg (yg (m∗ (θ)) , m∗ (θ) , κ) is feasible but not budget balanced, then the mechanism is only outcome-efficient. The surplus transfer payments in this case are assumed to be wasted and yield no value to any agent in the economy.
3.1
A Best Response Model of Behavior
When a mechanism is played repeatedly by an unchanging set of agents with timeinvariant preferences, agents may use information obtained in previous periods to improve their payoffs in the current period. If agents are imperfect utility maximizers, then past payoff information may be useful in selecting more successful strategies in the current period. Such is the motivation behind various reinforcement learning models. Alternatively, if agents are capable of utility maximization, but beliefs over the strategy choices of others are not necessarily consistent with actual behavior in each period, then previous observations may be used to help form beliefs about the strategies to be played in the current period. A history-based best response learning model assumes agents’ beliefs over the strategies of others to be used in the current period t are formed from the previously observed strategies (history) of the other players from periods 1 through t−1, denoted m1−i through mt−1 −i for a given agent¡i. Define agent ¢ i’s belief about the strategy to be played by agent t−1 i 1 j in period t to be ψj mj , . . . , mj ∈ Mj , which maps each possible history of agent j into a unique pure strategy for every j 6= i8 . Agent i is then assumed to select a best ¢ ¡ t−1 1 i response to the belief vector ψ−i m−i , . . . , m−i . Therefore, ¢ ¡ B ◦ ψ : ×ni=1 ×j6=i Mjt−1 × Θ ³ M maps histories and utility parameters into actions through beliefs. If ψji is undefined for some j 6= i, then ª ¢ ¡ © Bi (∅|θi ) ≡ mi ∈ Mi |mi ∈ Bi m0−i |θi for some m0 ∈ ×j6=i Mj 8
This definition excludes probabilistic beliefs over a set of pure strategies, such as those assumed by fictitious play, for example.
6
so that every strategy that is a best response to some profile m0−i is a best response to unspecified beliefs. Note that this type of learning model assumes that players are rational but not consistent. In other words, agents perfectly maximize their utility given their beliefs, but their beliefs may be inconsistent with the actual choices of the other agents. This assumption is applicable if preferences are either not common knowledge (as is often the case in experimental and applied environments) or the preferences of others are not employed in the individual decision making process. If the consistency assumption were added, the model would predict Nash equilibrium play in every period. Without consistency, the dynamic process may or may not converge to a Nash equilibrium through replication. A k-period average best response model where M is a bounded convex set in Rn assumes that in all periods t > k ≥ 1 ψji
t−1 ³© ª ´ 1 X s t s t−1 mj s=1 = m ¯j ≡ m k s=t−k j
(1)
for all i, j ∈ N and t > k ∈ N. Thus, agents best respond to the belief that the average message of the previous k periods will be played in the current period9 . Note that ψji ∈ Mj by the convexity of Mj . Behaviorally, the k-period average model implies that agents best respond to an estimate of the current trend in the messages of other agents. Here, the estimate of trend is given by a simple moving average filter. Other low-pass filters may be used to determine the current trend in m−i , such as exponential smoothing or time-weighted moving averages. Although these various trend models may produce slightly different results, the implication of such models is that agents form unique, pure-strategy beliefs about the decisions of others using previous observations, but these beliefs are not highly sensitive to short-term fluctuations in the choices of others. The following propositions and corollaries establish the relationship between the kperiod average best response model and both dominant strategies and Nash equilibrium. Proposition 1 Strategies strictly dominated by a pure strategy are never selected in any period in a k-period average best response dynamic. The proof of Proposition 1 is straightforward. The dynamic model does not allow for completely mixed strategies, and all pure strategies predicted by the model must be best responses to some pure strategy belief. A resulting corollary is that if a game has a pure strategy profile that strictly dominates all other pure strategy profiles for all i ∈ N , then the given dynamic selects the dominant pure strategy profile in all periods. It is 9
Most dynamic models are based on mixed strategy probabilities defined on a finite strategy space while the best response models suggested in this paper are defined over a continuous strategy space and use only pure strategies.
7
important to note, however, that this dynamic process may allow for weakly dominated strategies to be selected in any period. The following propositions and corollaries show that under sufficient continuity, convergence of the dynamic process implies that the limit point is in fact a Nash equilibrium. Proposition 2 If a strategy is observed in k + 1 consecutive periods of the k-period average best response dynamic then it is a Nash equilibrium. Proof. Assume mt ∈ B (m ¯ t , θ) where m ¯ t is given in equation (1) and mt = mt−1 = . . . = mt−k , so that m ¯ t = mt−1 , which also equals mt . Thus, mt ∈ B (m ¯ t , θ) implies that mt ∈ B (mt , θ). Proposition 2 immediately implies the following important corollary. Corollary 3 All rest points of the k-period best response dynamic are Nash equilibria. The following proposition shows that convergence implies that the limit point is a Nash equilibrium. ∞
Proposition 4 If {mt }t=1 is a sequence of strategy profiles in M consistent with the k-period average best response dynamic for all t, if the best response correspondence B is upper hemi-continuous at a point q ∈ M and non-empty on M for all θ ∈ Θ, and if lim mt = q ∈ M
t→∞
then q is a Nash equilibrium strategy profile Proof. If mt converges to q, then the sequence of averages m ¯ t also converges to q. By ∞ the upper hemi-continuity of B at q, the fact that {m ¯ t }t=1 converges to q implies that any convergent sequence in M such that the tth term lies in B (m ¯ t , θ) for all t must converge ∞ t t to a point in B (q, θ). Since m ∈ B (m ¯ , θ) for all t by assumption, then {mt }t=1 is a sequence with terms in B (m ¯ t , θ) that converges to q. Thus, q ∈ B (q, θ). ∞
Corollary 5 If {mt }t=1 is a sequence of strategy profiles in M ⊆ Rn consistent with the k-period average best response dynamic that converges to q ∈ M , if η (m) is continuous and single-valued for all m ∈ M , and if ui (xi , y|θi ) is continuous in xi and y for all θi ∈ Θi and i ∈ N , then q is a Nash equilibrium strategy profile. This corollary is a simple application of the Theorem of the Maximum, which guarantees that the best response correspondence is upper hemi-continuous and non-empty under the given conditions. Corollary 6 If q ∈ M is asymptotically stable according to the k-period average best response dynamic and B is upper hemi-continuous and non-empty, then q is a Nash equilibrium strategy profile. 8
Asymptotic stability requires that the dynamic path from all initial points in some neighborhood of q converge to q. By Proposition 4, this is clearly sufficient for q to be a Nash equilibrium. The above propositions show that, for the k-period average best response dynamic, rest points are Nash equilibria, as are asymptotically stable points under upper hemicontinuity of the best response correspondence. It should be noted that strict Nash equilibria are not necessarily asymptotically stable.
3.2
Experiment Parameters
The experimental design tests five mechanisms with four sessions per mechanism. In every session, 5 subjects are grouped together to participate in the mechanism through a computer interface. Each subject in the group is assigned a unique player type, differing only by their utility parameters and endowments. Quasilinear preferences are induced with concave quadratic values for the public good given by vi (y|θi ) = −ai y 2 + bi y and an initial endowment of the private good, ωi . The vector θi = (ai , bi ) and the endowment ωi are positive for all i ∈ N . The quasilinear, quadratic structure of the preferences is common knowledge across all subjects, although the vectors of individual coefficients θi = (ai , bi ) and endowment ωi are private information. The chosen player type profile θ = (θ1 , . . . , θ5 ) and endowments are identical across all periods, sessions and mechanisms. These values are given in Table 1. [Table 1 about here.]
The cost function for the production of the public good is chosen to be linear with c (y) = κy = 100y for every session. As will be shown in the next section, these parameters provide distinct predictions between various mechanisms. Given the quasilinear preferences, the Pareto optimal level of the public good is uniquely solved by ¡ ¢ y P (θ) = arg max 302y − 21y 2 − 100y y≥0
= 202/42 = 4.8095 From an experimental design standpoint, a non-focal value for the Pareto optimum is preferred so that public good levels observed at are near Pareto optimal levels cannot be alternatively explained by subjects choosing integer strategies, for example.
4
The Mechanisms
The Voluntary Contribution, Proportional Tax, Groves-Ledyard, Walker, and continuous VCG (“cVCG”) mechanisms are compared in the lab. Each has different equilibrium 9
properties in the given environment. In particular, Voluntary Contribution has a strict dominant strategy on the lower boundary of the message space for four of the five player types and yields inefficiently low levels of the public good, while the equilibrium of the Proportional Tax mechanism has one player type contributing an inefficiently high level of the public good and all others contributing zero. The Groves-Ledyard mechanism is supermodular for the given punishment parameter while the Walker mechanism is not10 . The cVCG mechanism is especially interesting in this setting since there exists a unique dominant strategy located on a line of best responses in the two-dimensional strategy space of each player type on which all strategies are payoff equivalent to the dominant strategy. The following is a description of each mechanism in detail. A reader familiar with the details of public goods mechanisms may skip the discussion of the Voluntary Contribution, Proportional Tax, Groves-Ledyard, and Walker mechanisms, though the cVCG mechanism in use here has interesting properties that are critical in understanding the results presented below.
4.1
Voluntary Contribution Mechanism
The Voluntary Contribution mechanism serves as a baseline mechanism because it requires neither communication nor a central authority to collect taxes. The intuition behind the mechanism is that there exists a technology capable of producing the public good available to all agents. Given knowledge (or beliefs) about the amount of public good produced by others, each agent has a free-riding incentive since consumption of the public good is non-excludable and non-rivalrous. In the setting of the current experiments, four of the five player types have a dominant strategy to contribute nothing since their marginal value for every unit of the public good is less than its marginal cost. The mechanism works as follows. Each player i announces mi , the number of units of the public good to be added to the total. The sum of the contributions represents the realized level of the public good and the tax paid by agent i is the cost of mi units of the public good. Mathematically, y (m) =
n X
mi
i=1
τi (y (m) , m, κ) = κ mi The “Robinson Crusoe” ideal point for each agent, denoted y˜i , is the amount of public good she would contribute in the absence of contributions by others. In the current environment, bi − 100 y˜i ≡ 2ai 10
Muench & Walker (1983) show that maintaining this dynamic stability property of the GrovesLedyard mechanism as n → ∞ requires the punishment parameter γ to grow at a rate equal to n. However, for large n the punishment parameter will become inhibitive.
10
The unique best response message is given by Bi (m−i |θi ) = y˜i −
X
mj
j6=i
The vector of Robinson Crusoe ideal points for the given parameter values is µ ¶ 2 y˜ = −33, 1, −15, −2 , −7 3 The message space is restricted to M = [0, 6]5 so that the Nash equilibrium is clearly m∗ (θ) = (0, 1, 0, 0, 0). Since y˜i < 0 for players 1, 3, 4 and 5, zero contribution is a strict dominant strategy. Player 2’s best response, however, is sensitive to the choices of others.
4.2
Proportional Tax Mechanism
An alternative to the “pure” Voluntary Contribution mechanism is a voluntary contribution mechanism in which all agents pay an equal share of the production cost. For example, the central taxing authority can be assumed to entirely reimburse contributing agents for costs incurred using funds collected from an equal head tax paid by all agents in the economy. Thus, all agents in the economy pay an equal share of the cost regardless of their level of contribution, wealth, or benefits received. The formal setup is as follows. The functions y (m) and τi (m) are given by X y (m) = mi i∈N
and
1 κy (m) n The Robinson Crusoe ideal point for each agent is τi (y (m) , m, κ) =
y˜i ≡
bi − 20 2ai
and the unique best response message is Bi (m−i |θi ) = y˜i −
X
mj
j6=i
The vector of Robinson Crusoe ideal points for the given experimental parameters is y˜ = (7, 6, 5, 4, 3) The message space is chosen to be identical to the Voluntary Contribution mechanism message space, where M = [0, 6]5 . Note that this message space generates a corner 11
equilibrium of m∗ (θ) = (6, 0, 0, 0, 0)11 . No agent in this mechanism has a dominant strategy, although players 3, 4 and 5 are, in some sense, less likely to prefer non-zero contributions given the ideal points of players 1 and 2.
4.3
Groves-Ledyard Mechanism
This efficient mechanism requires all agents pay an equal share of the cost plus a penalty term based on deviations from the average of the others’ contributions and on the variance of those contributions. Formally, the outcome functions are given by X y (m) = mi i∈N
and
κ γ τi (y (m) , m, κ) = y (m) + n 2
where µi = and σi2 =
µ
n−1 (mi − µi )2 − σi2 n
¶
1 X mj n − 1 j6=i
1 X (mj − µi )2 n − 2 j6=i
are the mean and sample variance of the n − 1 other agents’ messages. Each agent’s unique best response message in the quadratic, quasilinear environment is given by µ ¶ bi − κ/n γ/n − 2ai X Bi (m−i |θi ) = mj + 2ai + γ n−1 2ai + γ n−1 n n j6=i For the current parameters, the term in parentheses is positive for all player types. Therefore, the game is supermodular, which is a sufficient condition for the one-period best response dynamic to converge to the Nash equilibrium12 . The equilibrium of the game is m∗ (θ) = (1.0057, 1.1524, 0.96952, 0.86476, 0.81714) which gives yg (m∗ (θ)) = 4.8095 = y P (θ). The message space used in testing this mechanism is chosen to be M = [−4, 6]5 , which is identical to that used by Chen and Plott [6] and Chen and Tang [7]. Clearly the Nash equilibrium strategy profile lies within the interior of the message space. 11
If the upper bound of the message space were chosen to be greater than or equal to 7, then the equilibrium would be m∗ = (7, 0, 0, 0, 0). 12 Chen (2000) shows that this mechanism is a supermodular game if and only if γ ≥ © ª −n mini∈N ∂ 2 vi /∂y 2 , which implies that γ/n ≥ maxi∈N {2ai }. Since maxi∈n {2ai } = 16 and γ/n = 20, the game is supermodular.
12
The equilibrium vector of taxes has each agent paying approximately 96.18 francs. The relatively small difference across equilibrium messages serves to reduce the magnitude of the penalty function in equilibrium, thus reducing the variance in taxes. The equilibrium vector of taxes satisfies individual rationality in the current setting, although it is well known that this would not be true for all parameter values.
4.4
Walker Mechanism
Walker [45] developed the following “paired difference” mechanism that implements the Lindahl allocation in Nash equilibrium. The y (m) and τi (m) functions are defined as X y (m) = mi i∈N
and τi (y (m) , m, κ) =
³κ n
´ + mdi y (m)
respectively, where mdi ≡ m(i−1) mod n − m(i+1) mod n The unique best response message is given by bi − κ/n − mdi X mj − Bi (m−i |θi ) = 2ai j6=i Solving for the equilibrium with the given parameters, m∗ (θ) = (12.276, −1.438, −6.771, −2.200, 2.943) which gives the Lindahl allocation (y (m∗ (θ)) , τ (y (m∗ (θ)) , m∗ (θ) , κ)) = (4.8095, (117.26, 187.8, 99.855, 49.469, 26.567)) To accommodate the disperse equilibrium messages, the message space is expanded to M = [−10, 15]5 . Note the similarity between the best resonse function for the Walker mechanism and those of the Voluntary Contribution and Proportional Tax mechanisms. P In all three specifications, each agent has a particular value of y˜i ≡ Bi (m−i |θi ) + j6=i mj that she would most prefer. These heterogeneous ideal public good levels create instability in the simple best response dynamic as each agent attempts to force the public good level to their own ideal point. The fact that the messages of some other agents are a part of Bi (m−i |θi ) in the Walker mechanism allows for an interior equilibrium, but the offequilibrium best response dynamics are still similar to those of the other two mechanisms.
13
Chen and Tang [7] also show that the cost of deviating by some fixed ε from the Nash equilibrium is less in the Walker mechanism than in the Groves-Ledyard mechanism, particularly as the punishment parameter γ increases. Since the opportunity cost of choosing a deviating strategy is lower, subjects may be more likely to attempt such deviations. These observations indicate that the equilibrium of the Walker mechanism is less attractive and less stable than that of the Groves-Ledyard mechanism.
4.5
Continuous VCG (cVCG) Mechanism
The continuous version of the VCG mechanism with a two-dimensional message space is particularly interesting in this context because the set of best responses to a given pure strategy profile is much larger than the unique dominant strategy point. Specifically, all points on a particular line in the strategy space that intersects the dominant strategy point are best responses to some m−i . The best response learning model predicts that subjects play strategies on the best response line while the dominant strategy prediction is limited to to the truthful revelation point. Given that the dominant strategy equilibrium is a zero-dimensional space, the best response set is one-dimensional for each agent, and the strategy space is two-dimensional, it is possible to distinguish between equilibrium, best response, and random (or, unexplained) strategy choices. The cVCG mechanism studied is identical to the mechanism used in the pilot experiment of Kawagoe and Mori. The message space is set equal to the parameter space, so that Mi = Θi and a message mi can be equivalently expressed as an announced parameter value θˆi = (ˆ ai , ˆbi ). The outcome function takes the vector of announced parameter values θˆ and solves for the Pareto optimal level of y on the assumption that θˆ is the true vector of preference parameters. Formally, " n # X ˆ = arg max ˆ − κy y(θ) vi (y|θ) y
i=1
Pn ˆ b −κ Pn i = i=1 2 i=1 a ˆi The tax function is given by
à ! X κ n − 1 ˆ − ˆ ˆ θ, ˆ κ) = y(θ) ˆ θˆj ) − κ y(θ)) τi (y(θ), vj (y(θ)| n n j6=i ! à X n − 1 κ zi (θˆ−i )) + vj (zi (θˆ−i )|θˆj ) − n j6=i
14
where zi (θˆ−i ) ≡ arg max y
P =
X j6=i
ˆ − P
j6=i bj
2
j6=i
n−1 vj (y|θˆj ) − κy n
n−1 κ n
a ˆj
represents the Pareto optimal level of the good for the n − 1 agents excluding i and assuming the preference parameters θˆ−i were announced truthfully. The first-order condition for utility maximization by agent i given the announcements ˆ θ−i is Ã" # " Ã !#! X X dui dy ˆbj − κ − y(θ) ˆ 2 ai + = bi + a ˆj . ˆ ˆ dθi dθi j6=i
j6=i
Since dy/dθˆj 6= 0 for all θˆi ∈ Θi and all i ∈ N due to linearity in the ˆbi parameter, utility maximization is necessarily achieved by setting the term in parentheses to zero ˆ The necessary and sufficient condition for maximization through manipulation of y(θ). is therefore P bi + j6=i ˆbj − κ ´ = y(θi , θˆ−i ). y(θˆi , θˆ−i ) = ³ P ˆj 2 ai + j6=i a Thus, any announcement by player i that results in the same level of the public good as would have obtained under truth-telling is necessarily a best response. Since truthtelling is a best response given any θˆ−i , then it is a weakly undominated strategy. Solving explicitly for the set of individual best responses to any set of reports θˆ−i = (ˆ a−i , ˆb−i ) gives ¶ µP ˆ j6=i bj +bi −κ B ˆB B B ˆ P ai , bi ) ∈ Θi : bi = a ˆi ³ ´ (ˆ a ˆ +a j i j6=i ˆ µ ¶ Bi θ−i |θi = . (2) P P bi j6=i a ˆj −ai j6=i ˆbj +ai κ P + a ˆj +ai j6=i
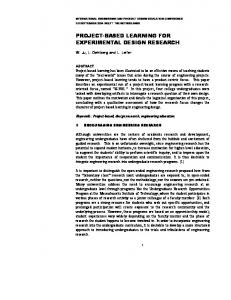
Since a strategy θˆi affects agent i’s utility only through the value of y(θˆi , θˆ−i ), indifference curves in agent i’s strategy space correspond to level curves of the y(·, θˆ−i ) function. The set Bi (θˆ−i |θi ) is therefore the level set of i’s most preferred quantity of the public good given θˆ−i . With quadratic, quasilinear utilities, the level curves of y(·, θˆ−i ) are the parallel lines through the strategy space given by Equation 2. The slope and intercept of the most-preferred contour line varies with θˆ−i , but the fact that θi is a point in the line does not. Thus, the line Bi (θˆ−i |θi ) rotates about θi as θˆ−i changes. See Figure 1 for a simple illustration of these sets. [Figure 1 about here.]
15
It is important to reiterate the fact that the set of Nash equilibria extends beyond the unique dominant strategy equilibrium. As a simple example, if n − 1 agents fully reveal their preference parameters while the nth agent announces θˆn ∈ Bn (θ−n |θn ) \ {θn }, then a weakly dominated Nash equilibrium has obtained. Since y(θˆn , θ−n ) = y (θ) = y P (θ), this equilibrium is also outcome efficient. Although this mechanism is known to be inefficient due to its lack of budget balance, the size of the predicted efficiency varies with the parameter choices. Thus, the results obtained in the laboratory are sensitive to the choice of preference parameters. The parameters in use for the current set of experiments generate equilibrium efficiencies of over 99%. The discussion in Section 6.4 will highlight the significance of this (or any) fixed parameter choice in analyzing the results.
5
Experimental Design
All experiments were run at the California Institute of Technology using undergraduates recruited via e-mail. Most subjects had participated in economics experiments, though none had experience with the particular game forms in the current study. Four sessions were run with each mechanism for a total of twenty sessions13 . In each session, from five to twenty subjects were simultaneously brought into the laboratory. Instructions were given to the subjects and read aloud by the experimenter14 . Subjects were then given their private information (preference parameters and initial endowments) on a slip of paper. All subjects logged into the game from their computer terminal. Each subject knew she was grouped with four others, but could not discern which individuals were in her group15 . The use of the software was explained in detail to the subjects, although no practice rounds were played. The software interface includes two useful tools for the subjects to use at any time. First, a history window is available that displays the results of all past periods. Subjects can see all previous outcomes, including the message they sent, taxes paid, public good levels, and profits. The entire vector of messages submitted by the other agents in previous periods is not shown; only the relevant variables used in calculating their tax, value and payoff functions are provided. The second tool, called the “What-If Scenario Analyzer,” allows subjects to enter hypothetical messages into a calculator-like program to view what levels of y (m), τi (y (m) , m, κ) and profit would result. Each subject is shown only her own hypothetical tax, value, and profits so that subjects can not deduce the preference parameters of other subjects. 13
Four additional sessions with the cVCG mechanism were run, but had to be discarded due to a software glitch. These data are very similar to the reported sessions and feature a slightly higher frequency of demand revelation. 14 Instructions and copies of the software are available upon request. 15 In one cVCG session, only one group of subjects was in the laboratory at the same time. The subjects were well separated to prevent communication or other out-of-experiment effects.
16
The benefit of the “What-If Scenario Analyzer” is that it enables subjects to perform searches over the strategy space before selecting their strategies. In this sense, it is similar to giving subjects a payoff table describing all possible outcomes, although the current tool provides more feedback than payoffs alone. The interest of the current study is in understanding the learning dynamics involved as subjects repeatedly interact with each other rather than the dynamics involved in learning how strategies map to outcomes. Out-of-game experimentation allows subjects to understand how strategies map to outcomes before making decisions. Instead of a practice period, subjects were given five minutes to experiment with the “What-If Scenario Analyzer” and ask questions. During the actual game, subjects enter their message (twice for confirmation) into the computer. The feedback at the end of each period is identical to the feedback described above for the history window. Total earnings are kept at the bottom of the screen, along with the current period number and the total number of periods in the game. Sessions typically lasted 90 minutes to two hours and subjects were paid a $5 show-up fee plus earnings that averaged approximately $20 per person.
6
Results
Due to the substantial difference between the structure of the first four mechanisms and that of the cVCG mechanism, results pertaining to the latter will be considered seperately.
6.1
Best Response in non-VCG Mechanisms
The predictions of any best response model depend on the beliefs held by the agents regarding the strategies to be chosen by the other agents. In an anonymous environment where preference parameters are private information, a reasonable assumption is that agents’ beliefs depend only on observable histories. A k-period best response model is consequently one natural candidate for describing subject behavior in such an environment. Given that each of the public goods mechanisms under consideration was developed under the assumption that agents play Nash equilibrium strategies, the static Nash equilibrium m∗ (θ) serves as an appropriate model against which the best resopnse models may be tested. If the best response models are found to provide significant improvement in predicitive power over the Nash equilibrium assumption, then mechanism design theory is improved in accuracy by instead assuming that agents are best responding to history-dependent beliefs. 6.1.1
Choosing The Parameter k
Using the observed data, best response model predictions for each period t > k are generated for k ∈ {1, . . . , 10} and compared to the observed announcement in period t. 17
The first k periods are required to “seed” the initial beliefs used in the best response models and are therefore excluded from analysis. To focus further analysis of the best response models, the value of k that minimizes the average minimum deviation between the best resopnse set and the data is selected from k ∈ {1, . . . , 10}. Define k ∗ to be the parameter that satisfies " Ã !# 5 X 4 X 5 50 X X ° ° 1 °mtg,s,i − mB ° k ∗ = arg min inf t B k∈{1,...,10} 100 (51 − tmin ) m ∈Bg,i (m ¯ g,s,−i |θi ) g=1 s=1 i=1 t=t min
where g ∈ {1, . . . , 5} represents each of the five mechanisms under consideration, s ∈ {1, . . . , 4} indexes the 4 identical sessions of each mechanism, and k·k is the standard Euclidean norm. Since the first k periods of each model are used to seed the initial beliefs, they must be excluded from analysis. Consequently, tmin must be strictly larger than k. In four of the five mechanisms, Bg,i (m ¯ tg,s,−i |θi ) is unique and Mg,i ∈ R1 , so the term in parentheses reduces to a simple absolute difference. In the cVCG mechanism, this term represents the orthogonal distance from the observed message to the appropriate best response line. Table 2 reports the average minimum deviation measure for various values of k and tmin . Note that for every value of k considered, the deviation measure is strictly decreasing in tmin , indicating that the models are less accurate in early periods than in later periods. Therefore, comparisons between models should only be made for fixed values of tmin . Given that messages are serially dependant and the nature of this dependence is unknown, no appropriate notion of significance is applicable to this analysis16 . The objective of this subsection is to make further analysis tractable by selecting a single value k ∗ to represent the class of k-period best response models. Therefore, statistical significance of the difference in quality of fit between best response models is unimportant in this context; choosing the minimum-deviation model is sufficient. [Table 2 about here.]
Result 7 Among the k-period best response models with k ∈ {1, . . . , 10}, the 5-period best response model is estimated to be the most accurate. Support. The result follows immediately from inspection of Table 2, where the values of the deviation measure appear to be U-shaped in k for each fixed value of tmin . With one minor exception (at tmin = 7,) k = 5 is the minimum value for every tmin ∈ {6, . . . , 11} , 16
Serial dependence is clear from inspection of correlograms. Several models of serial dependence were estimated, including various time trend regressions, GARCH models, and a variety of stochastic differential equations. None of these procedures was able to adequately explain the data and result in an apparently uncorrelated error structure.
18
and the values are strictly decreasing in k for all tmin ∈ {2, . . . , 5} where the k = 5 model deviations cannot be calculated. Given that k ∗ = 5, empirical analysis of the best response models will henceforth be limited to the 5-period model17 .
6.1.2
Comparison of Best Response and Equilibrium Models
It is important to note that while the results of this paper examine the properties of best response behavior, the data may be consistent with a variety of other learning models as well. The best response model is chosen because it is consistent with qualitative descriptions of behavior in a variety of mechanisms and it provides a straightforward and tractable explanation of the experimental results, both past and present. By selecting a model that improves the accuracy of prediction over that of Nash equilibrium, the accuracy of mechanism design may be improved. The relevant question for theoretical mechanism design is whether this dynamic model represents a significant improvement in accuracy over the equilibrium assumption commonly employed. The power of the statistical analysis of this comparison is dependent upon the degree of separation between the predictions of the two models. Visual inspection of the data (see Tables 2 through 5) indicates that all player types in the GrovesLedyard mechanism, four of five player types in the Voluntary Contribution mechanism and two player types in the Proportional Tax mechansim converge quickly to equilibrium (as do their best responses,) resulting in little to no power in comparing the accuracy of the two models. However, the Walker mechanism data fail to converge to equilibrium and therefore provide the most powerful tests. A one-sample runs test for randomness indicates that the errors of both the best response and equilibrium models are not randomly drawn from a zero-median distribution and tests for correlation indicate the errors are serially dependant18 . This nonstationarity implies that statistics aggregated across time may be easily misinterpreted19 . For example, the average prediction error across all periods does not estimate the average prediction error in any one period. Since this average is likely a function of the total 17
Complete analysis was performed on all models in k ∈ {1, . . . , 10}, and results for k ≥ 2 are similar to the case of k = 5. As is apparent from Table 2, the k = 1 model is notably less accurate than the others. The level of variation in the predictions of the k = 1 model is often greater than that of the data, so the smoothing achieved by the k ≥ 2 models provides a better fit. 18 The runs test indicated that the best resopnse model errors for 16 of the 20 total player types were not evenly scattered about zero at a significance level of 5%. Each of the 4 player types with model errors apparently randomly drawn from a zero-median distribution were from different mechanisms, indicating that the assumption of mean-zero random errors for all player types in any one mechanism is invalid. The errors of the equilibrium model were not evenly scattered about zero for 19 of 20 player types at the 5% significance level. Tests of first-order correlation indicate that the errors are serially correlated for all 20 player types in both models. 19 The dependence also implies that neither model fully captures the true dynamics of subject behavior in repeated games.
19
number of periods, analysis of the statistic must be considered specific to the length of the experiment20 . Empirical analysis of model fit is therefore performed on each player type in each period individually, with data aggregated only across the four sessions of each mechanism. However, the results of the period-by-period statistics may not be aggregated across time. [Figure 2 about here.]
[Figure 3 about here.]
[Figure 4 about here.]
[Figure 5 about here.]
The prediction error of each model, averaged across the four sessions, is presented in Figures 2 through 5. The confidence intervals are 95% confidence intervals generated by the bias-corrected and accelerated bootstrapping method using 2,000 draws in each period for each player type in each mechanism (see Efron & Tibshirani [13].) These graphs begin to illustrate the superiority of the best response model over the Nash equilibrium model. While the two predictions are often very similar, there are certain player types for whom the equilibrium model systematically under- or over-predicts the observed strategies. The best response model appears both more accurate and more precise than the equilibrium model whenever differences between the two are observed. The statistical hypothesis of interest is whether or not the expected equilibrium model error is significantly greater than the expected 5-period best response model error. In the context of non-cVCG mechanisms, error is simply the absolute distance between the observed message and the unique model prediction. A non-parametric permutation test for a difference in means between the two model errors is performed in each period for each player type in each mechanism (Efron & Tibshirani [13].) Each test was based on an simulated distribution of 2,000 draws, more than enough to make insignificant the variation in estimated p-values due to random sampling. The null and alternative hypotheses for each player type i and period t > k are ¯¤ ¢¯¤ ¡ t £¯ £¯ (3) ¯ −i |θi ¯ H0 : E ¯mti − m∗i (θ)¯ = E ¯mti − Bi m ¯ ¤ ¢¯ ¡ ¤ £¯ £¯ t ¯ t−i |θi ¯ HA : E ¯mi − m∗i (θ)¯ > E ¯mti − Bi m 20
This is a point occassionally forgotten in past analyses of time series data in experiments, leading to results that likely depend on the somewhat arbitrary choice of experiment length.
20
where the expectation is taken across the four sessions of each mechanism. Clearly, the power of this test depends on this difference between the predictions of the two models. If the best response is very near the equilibrium prediction in a given period, the test will have little power in differentiating the hypotheses and will often fail to reject H0 even when HA is true. The posterior probability of the truth of HA is consequently a function of the test’s power. Using the standard significance level of 5% and assuming equal prior beliefs on the truth of H0 and HA , if the test fails to reject the null hypothesis, a power of 89.4% is needed to guarantee that the posterior probability on HA is less than 10%. If the test rejects H0 , a power of 45% is needed to ensure that the posterior probability of HA is greater than 90%21 . The decision problem is to determine whether or not HA is accurate. Given that a power level of 45% is needed to provide at least a 90% probability that H0 is false when the test rejects H0 , tests with less than 45% power may be considered indeterminate in the sense that insufficient information about the truth of HA is provided by the test result. Tests that do not have sufficient power are therefore excluded from analysis of the current hypotheses. To estimate the test’s power as a function of the prediction differences, a simulation of the permutation test is performed for various differences between the model predictions. Specifically, four independent, normally distributed random messages (w1 , . . . , w4 ) are generated with mean µa and variance σw2 . This is repeated 100 times and the permutation test is performed in each repetition on the hypotheses ˜ 0 : E [|w − µb |] = E [|w − µa |] H ˜ A : E [|w − µb |] > E [|w − µa |] H where µa and µb represent unequal predictions of two different models, the first of which is correct in the sense that it predicts the true mean of the data. Given that the null hypothesis is false by construction, an estimate of the power of the permutation test is ˜ 0 . The simulation is given by the percentage of simulated tests that correctly reject H repeated for various values of (µa − µb ) and σw . The estimated power of the test is then plotted as a function of (µa − µb ) /σw , the number of standard deviations separating the two predictions22 . The resulting graph is shown in Figure 6. From this graph, it is clear 21
By Bayes’s Rule, P [HA true|reject H0 ] =
P [reject H0 |HA true] P [HA true] . P [reject H0 |HA true] P [HA true] + P [reject H0 |HA false] P [HA false]
Under diffuse priors, P [HA false] = P [HA true], so P [HA true|reject H0 ] =
P [reject H0 |HA true] Power = . P [reject H0 |HA true] + P [reject H0 |HA false] Power + Significance
Choosing a standard significance level of 0.05 implies that a test power of 0.45 is necessary to ensure that P [HA true|reject A similar calcuation shows that a power of 0.8944 is £ H0 ] is greater than 90%. ¤ needed to ensure P HA true|don0 t reject H0 < 10%. 22 It should be noted that if the mean of the data were µw > µa > µb , then the test would have even
21
that the distance between the two predictions should be at least 1.75 standard deviations of the data in order to keep the probability of incorrect rejections of H0 under 10%. [Figure 6 about here.]
Figures 7 through 10 display the p-value of the permutation test for each player type in each period, along with the estimated power of each test (drawn from Figure 6) and, for those tests with power greater than 45%, whether or not the test rejects the null hypothesis at the 5% and 10% significance levels. [Figure 7 about here.]
[Figure 8 about here.]
[Figure 9 about here.]
[Figure 10 about here.]
Result 8 The 5-period best response model is overall a better model to explain individual choice than the Nash equilibrium model. Support. In the Voluntary Contribution mechanism (Figure 7,) players 1, 3, 4, and 5 have a strict dominant strategy to contribute zero, implying that equilibrium is always a best response to any beliefs. Since the two models are identical, the power of the test is zero for these player types. Although the p-values for player 2 never indicate a rejection of of the null hypothesis, the power of the test is always below 40%, rendering its conclusions ambiguous. In the Proportional Tax mechanism (Figure 8,) players 3, 4, and 5 have little incentive to contribute regardless of the contributions of others, so that the free-riding equilibrium strategy is most often a best response. Player 1 is expected to contribute 6 units in equilibrium, and player 2 has an incentive to contribute if player 1 sends less than 6. For these players, best response is occasionally far from equilibrium, providing enough power for the permutation tests to be conclusive. For player 1, all 16 tests with sufficient power more power, while if µa > µw > (µa + µw ) /2, the test would have less power.
22
reject the null hypothesis at the 10% level, and 15 of 16 reject at the 5% level. Player 2’s results are similar, although the data revert toward equilibrium in the final periods (see Figure 3 as well.) The rapid convergence of the Groves-Ledyard mechanism (Figure 9) to equilibrium, which is accompanied by the convergence of best response predictions to equilibrium, reduces the power of the test in most periods. The ten tests with sufficient power (out of 175 possible) do favor the Nash equilibrium model, though the test power being well below 89.4% in all ten tests prevents conclusive rejection of HA . Among non-cVCG mechanisms, the Walker mechanism (Figure 10) provides the most testing power due to the lack of convergence of the data. Players 3 and 5 diverge from equilibrium frequently, providing many tests with sufficient power. Of the 41 tests due to player 3, only 2 fail to reject the null hypothesis at the 10% level, while 37 tests reject H0 at the 5% level. Of the 37 tests due to player 5, 8 fail to reject H0 , 12 reject H0 at the 10% level, and the remaining 17 tests reject H0 at the 5% level. The p-values of all 37 tests are below 0.20. These rejections are scattered evenly throughout the session, indicating no particular pattern over time. Of the other 3 player types, players 1 and 2 have low p-values on average, with five rejections of H0 and only 1 failure to reject. Player 4 shows mixed support overall, and in the few tests with sufficient power, shows fairly strong support for equilibrium behavior. This can also be seen in Figure 5, where the best response model errors are consistently positive while the average equilibrium model errors converge to zero. The significance of this result lies in its implications for implementation in a repeated interaction setting, where the assumption that agents play Nash equilibrium is clearly less accurate than a simple best response behavioral assumption. Mechanisms constructed under the assuption of equilibrium behavior may fail to implement the desired outcome due to instability in the behavioral process. Although the best response behavioral model does not provide a complete description of human behavior, a mechanism designer who assumes this simple dynamic will be able to more accurately implement the desired outcomes than a designer who assumes equilibrium behavior.
6.2
Best Response in the cVCG Mechanism
In the cVCG mechanism, a belief over the strategy profiles to be played by others induces a best response surface in the strategy space on which all actions are payoff-equivalent if the belief is consistent with actual behavior. If the belief puts all probability on a single strategy profile, the best response manifold in the quasi-linear environment is a line through the strategy space of the agent that necessarily intersects the truthful revelation point. The slope and intercept of this line are functions of the anticipated strategies used by others. If beliefs place nonzero probabilities on multiple strategy profiles, then the best response surface collapses to the truthful revelation point. In the k-period best response model, agents are assumed to form beliefs that put all weight on a single pure 23
strategy profile, so that the model predicts behavior anywhere on a line through the strategy space for each agent. As new data are received and the belief updates, this best response line rotates about the truthful revelation strategy. Empirically, the decisions of subjects can be grouped into three categories; full revelation of both parameters (which is the weak dominant strategy equilibrium,) partial revelation of only one parameter, and no revelation. The hypothesis of the best response model is that those observations in the second and third categories are located along the appropriate best response line.
6.2.1
Frequency of Revelation
One implication of best response behavior is the possibility of observing weakly dominated strategies. The following results show that while a majority of observations are consistent with the dominant strategy equilibrium, a significant number of observations are not. These observations are shown to instead follow a pattern of weakly dominated best responses that are payoff equivalent to the truth-telling equilibrium. [Table 3 about here.]
[Table 4 about here.]
Tables 3 and 4 summarize the frequency of parameter revelation observed in the cVCG mechanism for each player type. Although subjects may enter any non-negative real number for their strategies, the following analysis is limited to only those strategies that exactly correspond to parameter revelation – slight deviations from revelation are excluded. Result 9 Truthful revelation in the cVCG mechanism is observed with relatively high frequency. This frequency increases in the final periods. Support. Refer to Tables 3 and 4. On average, 54% of all observed messages are full revelation strategies, with the frequency increasing to 59% in the final 10 periods. Average partial revelation rises to 72% over the last 10 periods. Examining the individual frequencies over the final 10 periods, half of the twenty subjects fully reveal in at least nine of the last ten periods. Twelve subjects at least partially reveal in nine of the last ten periods. Only three subjects fail to fully reveal in all 50 periods, and an additional three subjects reveal fully only twice. Every subject reveals partially at least twice over the course of the experiment.
24
Interestingly, the frequencies with which players reveal their slope parameter bi is within 2% of the frequency of partial revelation when averaged across all subjects. In other words, when a subject partially reveals but does not fully reveal, it is most often the intercept parameter that is misrepresented. This is likely due to the fact that the intercept parameter has a linear effect on payoffs, unlike the slope parameter, so that experimentation with the intercept announcement may be more intuitive than with the slope announcement. 6.2.2
Patterns of Misrevelation & Weakly Dominated Best Responses
Although more than half of the cVCG decisions are full revelation strategies, a fair number of off-equilibrium observations remain to demonstrate that the data concentrate around the best response surfaces induced by the beliefs of the 5-period best response model. Full revelation strategies are necessarily best responses consistent with this model. Partial revelation and no-revelation strategies are off-equilibrium behavior that may or may not be consistent with best response. A convenient method for analyzing the data in this mechanism is to convert the twodimensional messages (ˆati , ˆbti ) into polar coordinates (φˆti , rˆit ) with the origin at the truthful revelation point (ai , bi ). Specifically, define the polar coordinates to be ∅ if a ˆti = ai & ˆbti = bi π/2 if a ˆti = ai & ˆbti > bi φˆti ≡ −π/2 ³ ˆti = ai & ˆbti < bi ´ if a s ˆ arctan bi −bi otherwise a ˆsi −ai r ³ ´2 rˆt ≡ (ˆ at − ai )2 + ˆbt − bi i
i
i
From Equation (2), the best response angle is given by ( P π/2 ³ P if ¯ j + ai = 0 ¡ ¢ j6=i a ´ ¯−i |θi = ¯bj +bi −κ φB θ i otherwise arctan Pj6=i a¯j +ai
.
j6=i
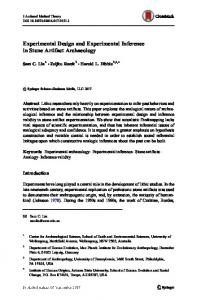
The since the best response prediction allows for any rˆit , the prediction error can be measured as the difference between the observed angle of the data and the best response ¡ ¢ ¯ angle. If the non-dominant strategy observations are best responses, φˆti − φB i θ−i |θi will be zero. Figure 11 displays the observed data in polar form with the origin located at the truth-telling point and the zero-degree line corresponding to the 5-period best response prediction. The equilibrium model predicts that all data will be located at the center of this graph, while the best response model predicts that all data will be scattered along the¢horizontal axis. Figure 12 shows the time-series representations of rˆit ¡ ¯ and φˆti − φB i θ−i |θi for each player type in the cVCG mechanism. The 95% confidence intervals are again formed by the bias-corrected and accelerated bootstrapping method with 2,000 ¡draws.¢ Note that all equilibrium observations are excluded from the graph ¯ of φˆti − φB i θ−i |θi , futher reducing the usable sample size. 25
[Figure 11 about here.]
[Figure 12 about here.]
Result 10 The 5-period best response prediction appears to be an accurate prediction of non-equilibrium play. Support. Given the dependence of messages across periods, statistical tests must be performed on a period-by-period basis. However, the removal of all full-revelation observations reduces the average sample size to less than two observations per period – not enough for statistical testing. Figure 11 clearly shows that the data scatter along the best response prediction. In the left graph, three data points are located over 900 units from the truth-telling equilibrium but lie within 1.09 degrees of the best response prediction. In total, half of all non-equilibrium observations are within 1.295 degrees of the best response line and 81.4% are within 10 degrees of the prediction. This analysis includes all partial revelation observations for which φˆti is necessarily a multiple of π/2. After removing these observations, just over half of the remaining data are within 0.832 degrees of the best response prediction, and 79.3% are within 10 degrees. Figure 12 tells a similar story. The average distance from the truth-telling equilibrium is frequently large, highly variable, and does not converge toward zero for three of the five player types. The high frequency of full and partial revelation drives the lower bounds ¯ of the confidence intervals toward zero in most instances. The graphs of φˆti − φB i (θ−i |θi ) across time show that the off-equilibrium data are centered at or near the best response prediction, with indications of convergence over time. Again, small sample sizes prevent clean statistical analyses. The tendancy for the angular deviation to be slightly positive by about 6 degrees, which is visible in both figures, arises from the partial revelation observations. 86.9% of the best response lines are between 83◦ and 85◦ while 20% of all off-equilibrium observations are partial revelation strategies located at 90◦ .
6.3
Testing Theoretical Properties of the Best Response Model
In Section 3, various theoretical properties of the k-period average best response model are derived. Each of these may be tested empirically to confirm that the important implications of this behavioral assumption are observed in the laboratory. In the cVCG mechanism, if four players fully reveal and the fifth chooses a nonrevelation strategy on Bi (θ−i |θi ), the result is a Nash equilibrium with one player choosing 26
a weakly dominanted strategy. Given that B5 (θ−5 |θ5 ) is a sloped line through R2 , choosing a strategy exactly on the best response line is a stringent requirement. However, if θˆ5 is sufficiently near B5 (θ−5 |θ5 ), then u5 (η (θ) |θ5 ) − u5 (η(θˆ5 , θ−5 )|θ5 ) will be less than some ε > 0. In other words, (θˆ5 , θ−5 ) will be an ε-equilibrium. Since θˆ5 is weakly dominated by θ5 , (θˆ5 , θ−5 ) is called a weakly dominated ε-Nash equilibrium. Result 11 Weakly dominated ε-Nash equilibria are observed, while undominated equilibria are not. Support. Setting ε = 1, 30.5% of observed strategy profiles in the cVCG mechanism are weakly dominated ε-Nash equilibria. At ε = 5, 67% of the profiles are ε-equilibria. Across the last 12 periods, ε-equilibria are observed 93.8% of the time for ε = 5. In the first session, subjects play a particular ε-equilibrium (for ε ≥ 1/2) in each of the final 19 periods. In none of the 200 repetitions of the cVCG mechanism is the truth-telling dominant strategy equilibrium observed. Beyond providing further support for a best response model of behavior, this result has greater implications: it suggests that elimination of weakly dominated strategies leads to the elimination of certain Nash equilibria that are observed in the laboratory. The practice of iterated elimination of weakly dominated strategies is consequently inappropriate as an equilibrium selection algorithm. The following result indicates that elimination of strictly dominated strategies is consistent with observed behavior. [Figure 13 about here.]
Result 12 (Proposition 1) Messages quickly converge to and do not significantly deviate from strictly dominant strategies in any period t > 5. Support. See Figure 13 for a graph of the average strategy chosen among players in the Voluntary Contribution mechanism with a strict dominant strategy to send mti = 0 in every period23 . Since the confidence intervals are generated by the bias-corrected bootstrapping method (with 2,000 draws for each period,) zero cannot lie in the interior of any confidence interval when all of the data are non-negative. After the 16th period, the upper bound of the confidence interval remains below 0.5 and drops below 0.2 after the 36th period. In the final four periods, the upper bound of the confidence interval drops to as low as 0.005 and the lower bound is identically zero. Overall, 64.25% of the observations are exactly zero. The following results indicate that convergence and repetition of observed messages are often indicative of a Nash equilibrium, which is also a property of the best response model of behavior. 23
This is the only mechanism with strict dominant strategies since the equilibrium of the cVCG mechanism is in weak dominant strategies.
27
Result 13 (Proposition 2) If a strategy is observed in 6 consecutive periods, then it is most likely a Nash equilibrium strategy. Support. In the non-cVCG mechanisms, there are 754 messages mti such that mti = = · · · = mt−5 i . Of those, 74.8% are Nash equilibrium messages. 80. 1% of such messages are within 1 unit of Nash equilibrium. In the cVCG mechanism, 45% of the 375 such messages are ε-equilibria with ε = 1. Setting ε = 5 increases the frequency to 82.1%. mt−1 i
Result 14 (Proposition 4) If a sequence of strategy profiles converges to a point q, then q is most likely a Nash equilibrium strategy profile. Support. Of the 20 groups across the 5 mechanisms, only one played the same strategy profile in all of the last 10 periods, indicating convergence to a particular strategy profile. As noted in Result 11, the first session of the cVCG mechanism converged to an ε-equilibrium (ε = 1/2) in all of the final 19 periods. One group in the Proportional Tax mechanism played a particular non-equilibrium strategy in 15 of the final 25 periods while another group played the Nash equilibrium profile in 7 of the final 10 periods. Overall, the above results indicate that the dynamic properties of observed behavior are roughly in line with the theoretical properties of the k-period best response dynamic.
6.4
Efficiency & Public Good Levels
The ability to compare data across a fairly large number of mechanisms leads to the natural question of which mechanisms generate the most efficient outcomes. In fact, this study provides a unique opportunity to do so since no other experiment to date has tested as many processes side-by-side. Although outcomes and efficiencies can be compared, it should be understood that results may be very sensitive to changes in parameters. In particular, the current set of parameters yields high efficiency levels in the cVCG mechanism24 . It is probable that the realized efficiency of this mechanism would be reduced given parameters with much lower equilibrium efficiency. In fact, it may be true that behavior changes in a low efficiency environment as subjects face a more stark contrast between incentives and efficiency25 . Furthermore, the dependence of messages across time limits statistical comparison to a period-by-period analysis with no measure of overall significance. The average public good level and realized efficiency are presented in Figure 14 along with 95% bootstrap confidence intervals. [Figure 14 about here.]
24
A test of equilibrium efficiencies in a random sample of “similar” parameters found the current parameters to yield efficiencies in the top 5% of the distribution. 25 Thanks to John Ledyard for this suggestion.
28
Result 15 For the given parameters, the average public good levels are closest to the Pareto optimal level in the cVCG mechanism, followed by the Groves-Ledyard mechanism. Efficiency in the other three mechanisms is lower, with the Walker mechanism often resulting in efficiency below that of the initial endowment. Support. Figure 14 shows the average public good levels in each period of each mechanism with 95% confidence intervals. The average public good level is not significantly different from the Pareto optimum (y P O = 4.8095) in 43 of the 50 periods for the cVCG mechanism and 35 of 50 periods in both the Walker and Groves Ledyard mechanisms. However, the average public good level in the Walker mechanism is also not significantly different from the highly inefficient level of y = 3.3 in 35 of 50 periods. This is due to the high variability of observed outcomes between sessions. The average in the cVCG mechanism is not significantly different from the Pareto optimum in 22 of the final 25 periods, whereas the same is true in only 15 of the final 25 periods for the GrovesLedyard mechanism. As predicted by Nash equilibrium and best response dynamics, the Voluntary Contribution mechanism significantly underprovides and the Proportional Tax mechanism overprovides the public good with the current parameters. Efficiency levels follow from the results on the public goods levels. The cVCG mechanism is the most efficient, followed by the Groves Ledyard mechanism. Interestingly, the average efficiency of the Walker mechanism is not significantly greater than the efficiency of the initial endowments (71.18%) in 38 of the 50 periods, and in 4 periods the average efficiency is significantly lower. This trend does not disappear across time. Thus, the Walker mechanism often violates the “individual rationality” constraint that its equilibrium is guaranteed to satisfy. The high level of efficiency achieved by the cVCG mechanism is not due convergence to the weak dominant strategy equilibrium, but rather to various weakly dominated Nash equilibria. Recall from Section 4.5 that all Nash equilibria of this mechanism are necessarily outcome efficient, so that the observed behavior results in efficiencies as good or better than that of the dominant strategy equilibrium. However, it is important to reiterate that the efficiency of the mechanism is particularly high under the current parameters and the results are likely to change in different environments.
6.5
Open Questions
The fundamental difficulty of testing the efficiency of mechanisms in the laboratory lies in their sensitivity to parameter choice. Past research has focused on changing punishment parameters of the mechanisms, but it is unknown how behavior differs when preferences are varied within a mechanism. In particular, the role of the incentive-efficiency tradeoff in guiding behavior is not known. The current set of experiments makes use of the ”What-If Scenario Analyzer” tool that enables subjects to calculate hypothetical payoffs. This tool is provided as an alternative 29
to the payoff tables often provided in experiments. The effect of this tool on dynamic behavior is not well understood. Unfortunately, the version of the software in use for this study does not provide data about what hypothetical scenarios subjects considered. Only actual decisions are tracked. The possibility of studying hypothetical explorations is an exciting extension to this research that may provide additional understanding of the learning dynamics in use. On the theoretical front, much work is left undone with respect to dynamics in public goods mechanisms. The literature is far behind that of private goods mechanisms, where stability in competitive markets has been extensively analyzed for several decades. Taesung Kim [25] shows that mechanisms Nash implementing Lindahl allocations must be locally unstable for some environment. However, restricting attention to quasilinear environments, a dynamically stable game form is introduced that does implement the Lindahl correspondence. De Trenqualye [11] and Vega-Redondo [42] introduce mechanisms that converge to the Lindahl allocation under Cournot best response behavior. Some mechanisms such as Smith’s auction [37] use convergence of tatonnemont-like dynamics as a stopping rule in each period of the mechanism. However, there have been only limited attempts to seriously consider dynamic issues in the theoretical mechanism design literature.
7
Conclusion
Motivated by the conjecture that a wide variety of behavior in a number of previous studies is consistent with a simple best response dynamic model, this paper experimentally compares five different public goods mechanisms, each with interesting equilibrium properties. In particular, dynamically stable and unstable Nash mechanisms are compared along with a weak dominant strategy mechanism whose best response properties provide an opportunity to distinguish between best response and equilibrium behavior. This latter mechanism, though tested in simpler forms in previous experiments, has never been tested in the laboratory with more than one preference parameter. The results of these experiments strongly support the best response behavioral conjecture. Strategies converge to Nash equilibria that are asymptotic attractors in a best response dynamic and diverge from equilibria that are not. In the weak dominant strategy mechanism, behavior tends to track a rotating best response line through the strategy space, implying that subjects who don’t understand the undominated properties of truthful revelation instead seek a best response strategy, resulting in the realization of weakly dominanted Nash equilibria. This result implies that elimination of weakly dominated strategies is an inappropriate tool for game theoretic analysis. Although outcomes and efficiency are sensitive to parameters, the continuous VCG mechanism performs well in both categories, as does the Groves-Ledyard mechanism. The Walker mechanism, due to its instability, generates efficiencies below that of the initial endowment. 30
The implications for mechanism design are straightforward. Most theorists have ignored dynamic stability in considering public goods mechanisms. The significant contribution of this paper is that it bridges the behavioral hypotheses that have existed separately in dominant strategy and Nash equilibrium mechanism experiments. The finding that a 5-period average best response dynamic is a fairly accurate behavioral model in all of these settings implies not only that dynamic behavior should be considered in theoretical research, but it also provides some guidance as to which behavioral models appear to be the most accurate. The results of this paper show that a best response dynamic with beliefs formed over a small number of previous periods well approximates the data. Thus, Nash implementation mechanisms should satisfy dynamic stability and dominant strategy mechanisms should satisfy the strict dominance property if either is to be considered for real-world use in a repeated interaction setting.
References [1] G. Attiyeh, R. Franciosi, M. Isaac, Experiments with the pivot process for providing public goods, Public Choice 102 (2000), 95-114. [2] K. Binmore, L. Samuelson, Evolutionary Drift and Equilibrium Selection, Rev. Econ. Stud. 66 (1999), 363-393. [3] R. Boylan, M. El-Gamal, Fictitious Play: A Statistical Study of Multiple Economics Experiments, Games Econ. Behav. 5 (1993), 205-222. [4] A. Cabrales, G. Ponti, Implementation, Elimination of Weakly Dominated Strategies and Evolutionary Dynamics, J. Econ. Dynam. Control 3 (2000), 247-282. [5] T. Cason, T. Saijo, T. Sjostrom, T. Yamato, Secure Implementation Experiments: Do Strategy-Proof Mechanisms Really Work?, California Institute of Technology Working Paper 1165, 2003. [6] Y. Chen, C. Plott, The Groves-Ledyard Mechanism: An Experimental Study of Institutional Design, J. Public Econ. 59 (1996), 335-364. [7] Y. Chen, F.-F. Tang, Learning and Incentive-Compatible Mechanisms for Public Goods Provision: An Experimental Study, J. Polit. Economy 106 (1998), 633-662. [8] Y. Chen, Incentive Compatible Mechanisms for Pure Public Goods: A Survey of Experimental Research, in: C. Plott, V. Smith (Eds.), The Handbook of Experimental Economics Results, Elsevier Press, Amsterdam, 2004. [9] Y. Chen, Dynamic Stability of Nash-Efficient Public Goods Mechanisms: Reconciling Theory and Experiments, University of Bonn Working Paper SFB303, 1999. [10] E. Clarke, Multipart Pricing of Public Goods, Public Choice 2 (1971), 19-33.
31
[11] P. de Trenqualye, Stable Implementation of Lindahl Allocations, Econ. Letters 29 (1989), 291-294. [12] W. Dotson, On the Mann Iterative Process, Transactions of the AMS 149 (1970), 65-73. [13] B. Efron, R. Tibshirani, An Introduction to the Bootstrap, Chapman & Hall, New York, 1993. [14] J. Green, J.-J. Laffont, Characterization of Satisfactory Mechanisms for the Revelation of the Preferences for Public Goods, Econometrica 45 (1977), 783-809. [15] T. Groves, Incentives in Teams, Econometrica 41 (1973), 617-633. [16] T. Groves, J. Ledyard, Optimal Allocation of Public Goods: A Solution to the ‘Free-Rider’ Problem, Econometrica 45 (1977), 783-809. [17] T. Groves, J. Ledyard, Incentive Compatibility Since 1972, in: T. Groves, R. Radner, S. Reiter (Eds.), Information, Incentives and Economics Mechanisms, University of Minnesota Press, Minneapolis, 1987. [18] W. Greene, Econometric Analysis 4th edition, Prentice Hall, New Jersey, 2000. [19] B. Holmstrom, Groves Scheme on Restricted Domain, Econometrica 47 (1979), 11371147. [20] L. Hurwicz, On Informationally Decentralized Systems, in: C. McGuire, R. Radner (Eds.), Decision and Organization, North-Holland, Amsterdam, 1972. [21] L. Hurwicz, Outcome Functions Yielding Walrasian and Lindahl Allocations at Nash Equilibrium Points, Rev. Econ. Stud. 46 (1979), 217-225. [22] L. Hurwicz, M. Walker, On the Generic Nonoptimality of Dominant Strategy Allocation Mechanisms: A General Theorem that Includes Pure Exchange Economies, Econometrica 58 (1990), 683-704. [23] J. Kagel, D. Levin, Independent Private Value Auctions: Bidder Behavior in FirstSecond- and Third-Price Auctions with Varying Number of Bidders, Econ. J. 103 (1993), 868-879. [24] T. Kawagoe, T. Mori, Can the Pivotal mechanism induce truth-telling? An experimental study, Public Choice 108 (2001), 331-354. [25] T. Kim, Stability Problems in the Implementation of Lindahl Allocations, Ph.D. Thesis, University of Minnesota, 1987. [26] J.-J. Laffont, E. Maskin, A Differential Approach to Dominant Strategy Mechanism Design, Econometrica 48 (1980), 1507-1520.
32
[27] J. Ledyard, Public Goods: A Survey of Experimental Research, in: J. Kagel, A. Roth (Eds.), Handbook of Experimental Economics, Princeton University Press, Princeton, NJ, 1995. [28] W. Mann, Mean Value Methods in Iteration, Proceedings of the AMS 4 (1963), 506-510 [29] R.P. McAfee, J. McMillan, Multidimensional Incentive Compatibility and Mechanism Design, J. Econ. Theory 46 (1988), 335-354. [30] H. Moulin, Characterizations of the Pivotal Mechanism, J. Public Econ. 31 (1986), 53-78. [31] T. Muench, M. Walker, Are Groves-Ledyard Equilibria Attainable?, Rev. Econ. Stud. 50 (1983), 393-396. [32] S. Rassenti, S. Reynolds, V. Smith, F. Szidarovszky, Adaptation and convergence of behavior in repeated experimental Cournot games, J. Econ. Behav. Organ. 41 (2000), 117-146. [33] R. Rob, Asymptotic Efficiency of the Demand-Revealing Mechanism, J. Econ. Theory 28 (1982), 208-220. [34] L. Samuelson, J. Zhang, Evolutionary Stability in Asymmetric Games, J. Econ. Theory 57 (1992), 363-391. [35] B. Scherr, E. Babb, Pricing Public Goods: An Experiment with Two Proposed Pricing Systems, Public Choice 21 (1975), 35-53. [36] S. Siegel, Nonparametric Statistics for the Behavioral Sciences, McGraw-Hill, New York, NY, 1956. [37] V. Smith, Incentive Compatible Experimental Processes for the Provision of Public Goods, in: V. Smith (Ed.), Research in Experimental Economics Volume 1, JAI Press, Greenwich, CT, 1979. [38] N. Stokey, R. Lucas, Jr, Recursive Methods in Economic Dynamics (with R. Prescott), Harvard University Press, Cambridge, MA, 1989. [39] T. Tideman, G. Tullock, A New and Superior Process for Making Social Choices, J. Polit. Economy 84 (1976), 1145-1159. [40] L. Thorlund-Petersen, Iterative Computation of Cournot Equilibrium, Games Econ. Behav. 2 (1990), 61-75. [41] J. Van Huyck, J. Cook, R. Battalio, Selection Dynamics, Asymptotic Stability, and Adaptive Behavior, J. Polit. Economy 102 (1994), 975-1005. [42] F. Vega-Redondo, Implementation of Lindahl Equilibrium: An Integration of Static and Dynamic Approaches, Math. Soc. Sci. 18 (1989), 211-228. 33
[43] W. Vickrey, Counterspeculation, Auctions and Competitive Sealed Tenders, J. Finance 16 (1961), 8-37. [44] M. Walker, On the Nonexistence of a Dominant Strategy Mechanism for Making Optimal Public Decisions, Econometrica 48 (1980), 1521-1540. [45] M. Walker, A Simple Incentive Compatible Scheme for Attaining Lindahl Allocations, Econometrica 49 (1981), 65-71.
34
ˆbi 6
¢¢
¢
¢
¢
³ ´ Bi θˆ−i |θi © © © ³ © ©
0 ¢ © Bi θˆ−i |θi © ¢ © s bi ©¢©θ © ¢ i ©© ¢ © ¢ ¢ ¢ ¢ -
ai
´
a ˆi
Figure 1: Two best response surfaces for Player i in the cVCG mechanism. Agent i’s true 0 parameter vector is θi = (ai , bi ) while θ−i and θ−i are two different parameter announcements of the other players. Note that θi is a best response to either announcement as it is a weakly dominant strategy.
35
Voluntary Contribution Mechanism
Player 1
2 1 0 −1 −2
Player 2
2 1 0 −1 −2
Player 3
2 1 0 −1 −2
Player 4
2 1 0 −1 −2
Player 5
5−period BR model deviations
2 1 0 −1 −2 10
20
30
40
Nash equilibrium model deviations
50
Period
10
20
30
40
50
Period
Figure 2: Average model error for the 5-period best response model and Nash equilibrium models in the Voluntary Contribution mechanism.
36
Proportional Taxation Mechanism 5−period BR model deviations
Nash equilibrium model deviations
Player 1
5 2.5 0 −2.5
Player 2
−5 5 2.5 0 −2.5
Player 3
−5 5 2.5 0 −2.5
Player 4
−5 5 2.5 0 −2.5
Player 5
−5 5 2.5 0 −2.5 −5 10
20
30
40
50
Period
10
20
30
40
50
Period
Figure 3: Average model error for the 5-period best response model and Nash equilibrium models in the Proportional Taxation mechanism.
37
Groves−Ledyard Mechanism
Player 1 Player 2
2 1 0 −1 −2
Player 3
2 1 0 −1 −2
Player 4
2 1 0 −1 −2
Player 5
5−period BR model deviations 2 1 0 −1 −2
2 1 0 −1 −2 10
20
30
40
Nash equilibrium model deviations
50
Period
10
20
30
40
50
Period
Figure 4: Average model error for the 5-period best response model and Nash equilibrium models in the Groves-Ledyard mechanism.
38
Walker Mechanism 5−period BR model deviations
Nash equilibrium model deviations
Player 1
14 7 0 −7 −14
Player 2
14 7 0 −7 −14
Player 3
14 7 0 −7 −14
Player 4
14 7 0 −7 −14
Player 5
14 7 0 −7 −14 10
20
30
40
50
Period
10
20
30
40
50
Period
Figure 5: Average model error for the 5-period best response model and Nash equilibrium models in the Walker mechanism.
39
1 0.855 Simulated Power
0.8
0.6
0.4
0.2
0 0
0.5
1
1.5
2
2.5
3
# Standard Deviations Between Predictions
Figure 6: Simulated power of the permutation test given in Equation for various differences in model predictions as a ratio of the data’s standard deviation.
40
Voluntary Contribution Mechanism
Reject H0 5% Reject H0 10% Not Reject H0
Player 1
1
Est. Power p−value
0.5
Player 2
0 1
0.5
Player 3
0 1
0.5
Player 4
0 1
0.5
Player 5
0 1
0.5
0 10
20
30
40
50
Period
Figure 7: p-values and estimated power for the permutation tests in the Voluntary Contribution mechanism. Stars, Xs, and Os represent test results for those tests with a power of at least 0.45. Star represents rejection of H0 at the 5% level, X represents rejection at the 10% level, and O represents no rejection of H0 . Note that this mechanism has no test with power ≥ 45%.
41
Proportional Taxation Mechanism
Reject H0 5% Reject H0 10% Not Reject H0
Player 1
1
Est. Power p−value 0.5
Player 2
0 1
0.5
Player 3
0 1
0.5
Player 4
0 1
0.5
Player 5
0 1
0.5
0 10
20
30
40
50
Period
Figure 8: p-values and estimated power for the permutation tests in the Proportional Tax mechanism. Stars, Xs, and Os represent test results for those tests with a power of at least 0.45. Star represents rejection of H0 at the 5% level, X represents rejection at the 10% level, and O represents no rejection of H0 .
42
Reject H0 5% Reject H0 10% Not Reject H0
Groves−Ledyard Mechanism
Est. Power p−value
Player 1
1
0.5
Player 2
0 1
0.5
Player 3
0 1
0.5
Player 4
0 1
0.5
Player 5
0 1
0.5
0 10
20
30
40
50
Period
Figure 9: p-values and estimated power for the permutation tests in the Groves-Ledyard mechanism. Stars, Xs, and Os represent test results for those tests with a power of at least 0.45. Star represents rejection of H0 at the 5% level, X represents rejection at the 10% level, and O represents no rejection of H0 .
43
Walker Mechanism
Player 1
1
Reject H0 5% Reject H0 10% Not Reject H0 Est. Power p−value
0.5
Player 2
0 1
0.5
Player 3
0 1
0.5
Player 4
0 1
0.5
Player 5
0 1
0.5
0 10
20
30
40
50
Period
Figure 10: p-values and estimated power for the permutation tests in the Walker mechanism. Stars, Xs, and Os represent test results for those tests with a power of at least 0.45. Star represents rejection of H0 at the 5% level, X represents rejection at the 10% level, and O represents no rejection of H0 .
44
90
90
1000
120
60
500
150
30
180
50
30
180
330
240
60
150
0
210
100
120
0
210
300
330
240
270
300 270
Figure 11: Polar-coordinate representation of the cVCG data with the origin at the truth-telling point and the horizontal axis corresponding to the 5-period best response surface. Two different scalings of the same graph are presented.
45
cVCG Mechanism Angular deviation from B.R. (degrees)
Player 1
60 50 40 30 20 10
Player 2
60 50 40 30 20 10
Player 3
60 50 40 30 20 10
Player 4
60 50 40 30 20 10
Player 5
Distance from Equilibrium
60 50 40 30 20 10
90 0 −90
90 0 −90
90 0 −90
90 0 −90
90 0 −90 10
20
30
40
50
10
20
30
Period
40
50
Period
Figure 12: Time series of average distance from equilibrium and angular deviation from the best response line for each player type in the cVCG mechanism with 95% confidence intervals.
6
Avg. Contribution
5
4
3
2
1
0
0
5
10
15
20
25
30
35
40
45
50
Period
Figure 13: Average message and 95 for players in the Voluntary Contribution mechanism with a strict dominant strategy to contribute zero.
46
Public Good Level
Efficieny
cVCG
Walker
Gr.−Led.
Prop.Tax.
Vol.Cont.
1 10
IR
PO 0
0 1
10
IR
PO 0
0 1
10
IR
PO 0
0 1
10
IR
PO 0
0 1
10
IR
PO 0
0 10
20
30
40
50
Period
10
20
30
40
50
Period
Figure 14: The average level of public good and realized efficiency for each mechanism in each period along with 95% confidence intervals. PO represents the Pareto Optimal level of the public good (4.8095) and IR represents the efficiency of the initial endowments (71.18%.)
47
Agent Player 1 Player 2 Player 3 Player 4 Player 5
ai 1 8 2 6 4
bi 34 116 40 68 44
ωi 260 140 260 250 290
Table 1: Preference parameters θi = (ai , bi ) and ωi used in all sessions.
k 1 2 3 4 5 6 7 8 9 10
First time 2 3 1.407 1.394 1.240 -
period used in calculating average minimum deviation (tmin ) 4 5 6 7 8 9 10 11 1.284 1.151 1.104 1.088 1.072 1.054 1.054 1.049 1.135 0.991 0.967 0.949 0.932 0.922 0.913 0.910 1.097 0.963 0.940 0.925 0.904 0.888 0.883 0.875 0.952 0.932 0.915 0.898 0.877 0.866 0.861 0.924 0.911 0.895 0.876 0.860 0.853 0.911 0.897 0.881 0.868 0.854 0.899 0.884 0.873 0.863 0.884 0.874 0.864 0.879 0.870 0.875
Table 2: Calculated average minimum deviation from best response for various k-period best response models. Boldfaced entries represent, for each value of tmin , the smallest average minimum deviation measure among the 10 models tested. Note that the measure cannot be calculated for k ≥ tmin since k periods are used to “seed” the model.
48
Session Session 1 Session 1 Session 2 Session 2 Session 3 Session 3 Session 4 Session 4 Average Average
Periods All 50 Last 10 All 50 Last 10 All 50 Last 10 All 50 Last 10 All 50 Last 10
Player1 Player2 Player3 Player4 Player5 0.82 0.76 0.00 0.88 0.62 1.00 1.00 0.00 1.00 1.00 0.92 0.28 1.00 0.00 0.88 1.00 0.60 1.00 0.00 0.70 0.40 0.04 1.00 0.48 0.70 0.00 0.00 1.00 0.50 0.90 0.00 0.94 0.92 0.04 0.04 0.00 1.00 1.00 0.00 0.00 0.54 0.51 0.73 0.35 0.56 0.50 0.65 0.75 0.38 0.65
Average 0.62 0.80 0.62 0.66 0.52 0.48 0.39 0.40 0.54 0.59
Table 3: Frequency of revelation of both parameters (“full revelation”) by each player of the cVCG mechanism for all 50 periods and for the last 10.
Session Session 1 Session 1 Session 2 Session 2 Session 3 Session 3 Session 4 Session 4 Average Average
Periods All 50 Last 10 All 50 Last 10 All 50 Last 10 All 50 Last 10 All 50 Last 10
Player1 Player2 Player3 Player4 Player5 0.94 0.78 0.04 0.90 0.76 1.00 1.00 0.00 1.00 1.00 1.00 0.30 1.00 0.04 0.94 1.00 0.60 1.00 0.00 0.70 0.80 0.06 1.00 0.48 0.72 1.00 0.00 1.00 0.50 0.90 0.68 0.98 1.00 0.08 0.34 1.00 1.00 1.00 0.10 0.60 0.86 0.53 0.76 0.38 0.69 1.00 0.65 0.75 0.40 0.80
Average 0.68 0.80 0.66 0.66 0.61 0.68 0.62 0.74 0.64 0.72
Table 4: Frequency of revelation of either parameter (“partial revelation”) by each player of the cVCG mechanism for all 50 periods and for the last 10.
49