AQ11P and ID-3 Using a Chess Endgame Test Problem. Technical. Report ISG 82-2, University of Illinois, Dept. of Computer Science,. Urbana, IL, September ...
Learning from Examples: Generation and Evaluation of Decision Trees for Software Resource Analysis Richard W. Selby and Adam A. Porter Department of Information and Computer Science1 University of California Irvine, California 92717 (714) 856-6326 August 1988
Keywords: Learning from examples, decision trees, software e�ort and error analysis, software metrics, empirical measurement and evaluation, analysis of variance, machine learning 1 This work was supported in part by the National Science Foundation under grant
CCR{8704311 with cooperation from the Defense Advanced Research Projects Agency under Arpa order 6108, program code 7T10; National Aeronautics and Space Administration under grant NSG{5123; National Science Foundation under grant DCR{8521398; University of California under the MICRO and Faculty Mentor programs; and Hughes Aircraft Company.
Abstract Solutions to the problem of learning from examples will have far-reaching bene ts, and therefore, the problem is one of the most widely studied in the eld of machine learning. The purpose of this study is to investigate a general solution method for the problem, the automatic generation of decision (or classi cation) trees. The approach is to provide insights through in-depth empirical characterization and evaluation of decision trees for one problem domain, software resource data analysis. The purpose of the decision trees is to identify classes of objects (software modules) that had high development e�ort or faults, where \high" was de ned to be in the uppermost quartile relative to past data. Sixteen software systems ranging from 3000 to 112,000 source lines have been selected for analysis from a NASA production environment. The collection and analysis of 74 attributes (or metrics), for over 4700 objects, capture a multitude of information about the objects: development e�ort, faults, changes, design style, and implementation style. A total of 9600 decision trees are automatically generated and evaluated based on several parameters: (i) attribute availability; (ii) evaluation function heuristic; (iii) tree termination criteria; (iv) number of projects in the training set; (v) ordinal grouping of attributes; and (vi) dependent variable. Sensitive 24x5x15 full-factorial analysis of variance models are employed to assess the performance contributions of the factors and their interactions simultaneously. The analysis focuses on the characterization and evaluation of decision tree accuracy, complexity, and composition. The decision trees correctly identi ed 79.3% of the software modules that had high development e�ort or faults, on the average across all 9600 trees. The decision trees generated from the best parameter combinations correctly identi ed 88.4% of the modules on the average. Visualization of the results is emphasized, and sample decision trees are included.
i
Contents
Abstract List of Figures 1 Introduction 2 Motivation 3 Background
3.1 An Approach for Learning from Examples : : : 3.1.1 Decision Trees : : : : : : : : : : : : : : 3.1.2 Software Resource Data : : : : : : : : : 3.1.3 Decision Tree Generation Approach : : 3.1.4 Decision Tree Evaluation : : : : : : : : 3.1.5 Attribute Selection : : : : : : : : : : : : 3.2 Previous Systems for Learning from Examples :
4 The Software Environment 5 Data Analysis Methods and Tools
5.1 Data Collection Methods and Analysis Tools : 5.2 Evaluation Using Analysis of Variance Models : 5.2.1 Independent Variables : : : : : : : : : : 5.2.2 Dependent Variables : : : : : : : : : : :
6 Characterizing Decision Tree Accuracy 7 Characterizing Decision Tree Complexity 8 Characterizing Decision Tree Composition 9 Conclusions 10 Acknowledgements A Attributes B Example Decision Trees Generated ii
: : : : : : : : : : :
: : : : : : : : : : :
: : : : : : : : : : :
: : : : : : : : : : :
: : : : : : : : : : :
: : : : : : : : : : :
: : : : : : : : : : :
: : : : : : : : : : :
: : : : : : : : : : :
: : : : : : : : : : :
: : : : : : : : : : :
i iv 1 3 4 4 4 5 5 7 7 9
11 11 11 12 12 14
15 16 16 17 19 20 22
References
28
iii
List of Figures 1
2 3 4 5 6 7 8 9 10 11 12 13 14 15 16
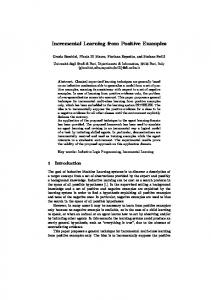
Example software attribute decision tree. Attributes = A1, A2, . . . . There is one attribute at each diamond-shaped decision node. Each decision outcome corresponds to a range of possible attribute values. Leaf nodes indicate whether or not an object is likely to have some concept, such as high development e�ort. : : : : : : : : Characterization of systems for learning from examples. : : : : : : Software analysis tools used for data manipulation and decision tree generation and analysis. : : : : : : : : : : : : : : : : : : : : : : : : Decision tree accuracy for the primary factors: dependent variable, attribute availability, evaluation function heuristic, tree termination criteria, number of projects in the training set, and ordinal grouping of attributes. : : : : : : : : : : : : : : : : : : : : : : : : : : : : : : Decision tree accuracy for interactions among attribute availability and dependent variable. : : : : : : : : : : : : : : : : : : : : : : : : Decision tree accuracy for interactions among tree termination criteria and attribute availability. : : : : : : : : : : : : : : : : : : : : Decision tree accuracy for interactions among number of projects in training set and attribute availability. : : : : : : : : : : : : : : : Decision tree accuracy for interactions among tree termination criteria and evaluation function heuristic. : : : : : : : : : : : : : : : : Decision tree accuracy for interactions among number of projects in the training set and dependent variable. : : : : : : : : : : : : : Decision tree complexity for the primary factors: dependent variable, attribute availability, evaluation function heuristic, tree termination criteria, number of projects in the training set, and ordinal grouping of attributes. : : : : : : : : : : : : : : : : : : : : : : : : : Decision tree complexity for attribute availability. : : : : : : : : : : Decision tree complexity for tree termination criteria. : : : : : : : Decision tree complexity for interactions among attribute availability and dependent variable. : : : : : : : : : : : : : : : : : : : : : : Decision tree complexity for interactions among attribute grouping and dependent variable. : : : : : : : : : : : : : : : : : : : : : : : : Decision tree complexity for interactions among tree termination criteria and dependent variable. : : : : : : : : : : : : : : : : : : : : Decision tree complexity for interactions among number of projects in the training set and dependent variable. : : : : : : : : : : : : : iv
34 35 36 37 38 39 40 41 42 43 44 45 46 47 48 49
17 Decision tree complexity for interactions among tree termination criteria and attribute availability. : : : : : : : : : : : : : : : : : : : 18 Decision tree complexity for interactions among number of projects in the training set and attribute availability. : : : : : : : : : : : : : 19 Decision tree complexity for interactions among tree termination criteria and evaluation function heuristic. : : : : : : : : : : : : : : 20 Decision tree complexity for interactions among number of projects in the training set and attribute grouping. : : : : : : : : : : : : : : 21 Decision tree complexity for interactions among tree termination criteria and attribute grouping. : : : : : : : : : : : : : : : : : : : : 22 Decision tree complexity for interactions among number of projects in the training set and tree termination criteria. : : : : : : : : : : 23 Decision trees with highest overall accuracy (% correct). The trees were generated using the following parameters: (i) information theory evaluation function heuristic; (ii) either 25% or 40% tolerance in the tree termination criteria; (iii) between 13{15 projects in the training set; and (iv) octile ordinal groupings of attributes. : : : :
v
50 51 52 53 54 55
56
1 Introduction The search for underlying pattern and regularity in a set of observations is performed routinely in a number of scienti c elds. The large volumes of data commonly encountered render characterization by manual methods ine�cient and prone to error, necessitating the use of automated techniques and procedures. Well-known classi cation techniques include the statistical methods of cluster analysis, factor analysis, or curve tting[Mul72] [Eve80]. Unfortunately, these techniques have limitations in the types of characterizations they can uncover[LF85]. Important relationships such as causation and inductive inference are transparent to the above methods[DM79]. Development of more powerful techniques for automatically generating characterizations of data may facilitate the modeling of relationships among observations. These characterizations may also aid in forecasting some aspects of the behavior of future observations. A variation on this paradigm is the concept of \learning." According to Simon[Sim83], \. . . intuitively, learning is a change in a system such that repeated performance of a task allows the system to perform the same task with increased e�ciency." For example, a person may apply an iterative process to discriminate a class of objects by identifying those attributes of its objects that di�erentiate them from objects not in the class. The discrimination scheme can then be used to determine whether previously unseen objects are members of the class. A commonality among learning activities is that task performance results in acquiring knowledge that can later be put to use. Consequently, one can conjecture that deep understanding of a learning process will bene t a variety of areas, ranging from systematic observation to cognitive psychology. The problem of developing concept descriptions from a series of observations has been well studied in the arti cial intelligence sub eld referred to as machine learning. It is there known as the \learning from examples" problem[CMM83].
Analyzing software systems. E�ective solutions to the learning from exam-
ples problem will have wide applicability because of the problem's generality. Activities that require forecasting based on past data are a common example of the problem. One particularly challenging problem is the characterization of future states of an evolving software system. Software developers would bene t from the ability to characterize and predict | early in development | the portions of the software system that are likely to have high development e�ort or be fault-prone. Available prediction techniques have been studied extensively (e.g., [WF77] [Put78] [Boe81]), but the limitations have been cited as a major problem in software development[TP79]. This type of prediction is a di�cult problem, 1
of course, providing a great deal of challenge to researchers and practitioners. Machine learning researchers have constructed and applied prediction systems to problems in such areas as agriculture[DM79], mathematics[Mit82][MUNB83], chemistry[BFL71], and industrial fuel production[Qui85]. Unfortunately, the full range of applicability of these systems is unknown.
Systematic evaluation. With few exceptions (e.g., [Qui79] [MC80] [Qui85]
[CN86] [QCHL86] [Mic87]), very little attention has been paid to the systematic evaluation of the systems using empirical data. Moreover, there has been very limited empirical validation of the e�ectiveness of proposed learning principles and approaches. Coupled with this is a corresponding lack of empirical information concerning important system parameters with respect to an application area. Thus, for many domains there is little characterization of such necessary information as the amount of data, number and type of attributes, and degree of noise insensitivity required to maximize the performance of these systems. These issues and others (e.g., relationships between the representation language for the attributes and the algorithms applied to derive the learning system) are related to the discussions of forms of \bias" in determining generalizations (see [Mit80] [RST87]). Empirical evaluation can provide insights into these issues and help re ne and enhance the underlying research principles.
Decision trees. This paper presents results from the analysis of one general approach to the learning from examples problem, automatic decision tree generation (or induction). The purpose of the decision trees is to identify certain classes of objects, such as software modules that are likely to be fault-prone or costly to develop. The decision tree leaf nodes contain a \yes" or \no" to indicate whether an object is likely to be in a certain class based on historical data (see Figure 1). Decision trees are useful structures since they are straightforward to build and interpret. Decision trees use di�erent object attributes to classify di�erent subsets of objects; they do not use just one attribute or a xed set of attributes. Decision trees can also be naturally decomposed to form a set of production rules. The rules may then be used to form the basis of a knowledge-based or \expert" system. Since the tree generation process is automated, the cost of knowledge acquisition is greatly reduced. Evaluation of decision trees. The analysis presented is based on the examina-
tion of 9600 di�erent decision trees that were generated from variations in several parameters. Sixteen software projects of moderate to large size were selected from a NASA software production environment for this study. The decision trees were 2
generated based on empirical data from the projects. These data included information about the development e�ort, faults, changes, and static analysis of the software systems. The paper focuses on three areas: � characterization of decision tree accuracy; � characterization of decision tree complexity; and � characterization of decision tree composition. Section 2 outlines some of the research questions that this study addresses. Section 3 presents the decision tree generation approach and background information on previous systems for learning from examples. Section 4 summarizes the selected software production environment. The data analysis methods and tools are described in Section 5. Sections 6, 7, and 8 present the analysis characterizing decision tree accuracy, complexity, and composition, respectively. The conclusions from this work appear in Section 9, which is followed by an appendix that includes sample decision trees.
2 Motivation This study is intended to address a variety of research questions regarding the decision tree solution method for the learning from examples problem. These questions include:
� Is automatic decision tree generation a feasible approach for the learning � � � �
from examples problem? Can decision trees with high accuracy and low complexity be automatically generated for the software resource analysis problem domain? What are the accuracy and complexity of decision trees that are intended to identify software objects (e.g., modules) with high development cost or high faults? What are the accuracy and complexity of the decision trees when many object attributes are available versus just a subset of the attributes (e.g., only attributes having low cost or early availability)? What are the accuracy and complexity of the decision trees when di�erent attribute evaluation heuristics are used to construct the trees? 3
� What are the accuracy and complexity of the decision trees when di�erent � � � �
criteria are used to terminate tree construction (e.g., using di�erent termination tolerances to allow for \noisy" data and natural variation)? What are the accuracy and complexity of the decision trees when di�erent amounts of data are used to generate the trees? What are the accuracy and complexity of the decision trees when di�erent branching factors (i.e., the number of children per node) are used to generate the trees? How can the composition of the decision trees be characterized (e.g., in terms of the attributes frequently selected)? What combination of decision tree generation parameters result in the most accurate and least complex trees?
3 Background Sections 3.1 and 3.2 provide � an overview of one particular system upon which our analysis tools are based, and � an introduction to several di�erent systems for learning from examples.
3.1 An Approach for Learning from Examples 3.1.1 Decision Trees
The analysis tools developed for this study are based on Quinlan's ID3 system, as it was described in [Qui85]. This alternative was selected because the ID3 system allows for e�cient and automatic construction of decision trees. Decision trees are general structures that can be automatically analyzed for accuracy, complexity, and composition. The ability to generate and analyze the structures automatically and e�ciently are important considerations in this study since a large number (i.e., 9600) of parameter combinations are being investigated (see Section 5.2 for explanation of the 9600 combinations). Although decision trees serve as an e�cient representation in this study, we do not imply that this is true for all data sets and tree generation heuristics. \Covers" are an alternate representation mechanism and are used in the AQ system [MC80] [MMHL86]. A comparative study observed 4
that generation of decision trees was more e�cient than generation of covers, while covers tended to be more comprehensible [ORo82]. In the decision tree approach, the members of a set of objects are classi ed as either positive or negative instances (or examples) of some concept. Candidate attributes that may possibly describe the concept are then outlined. A decision tree construction tool then formulates a decision tree, based on the values of measurable attributes, to identify all positive instances of the concept but no negative instances. This decision tree characterization then becomes the basis for forecasting whether an object, previously unseen, is a positive or negative instance of the concept being modeled.
3.1.2 Software Resource Data
With respect to the problem of analyzing software resource data, the following analogies may readily be drawn. In this problem domain, software modules are the objects being classi ed. Attributes that describe the objects are called software metrics in the software engineering eld [Bas80]. In this study, the concepts being modeled are the high resource expenditure or fault-proneness of a software module. The objects to be considered positive instances of the concept will be those software modules that have high development e�ort or several software faults, where \high" means in the uppermost quartile (i.e., 25%) relative to past data. Modules with such properties are useful for software developers to identify because a relatively small portion of a system's modules tends to consume a disproportionately high amount of the development, modi cation, and fault correction resources. This phenomenon is commonly known as the \80:20 rule," which means that 80% of software system's costs are usually associated with roughly 20% of the system. For further discussion of software resource analysis, see [Boe81] [BB81] [WF77] [Bro81]. We now describe the decision tree generation approach to the learning from examples problem.
3.1.3 Decision Tree Generation Approach
The approach constructs a decision tree (or classi cation tree) over the objects in a set, given the following two assumptions: � There exists a universe of objects each of which is characterized by a set of attributes A = fA g with values V = f possible values of A g. The values V are either (a) both discrete and mutually exclusive; or (b) continuous. If an attribute has continuous values, a mapping from the continuous values i
i
i
5
i
to a range of values that are both discrete and mutually exclusive needs to be provided. � Each object in the set can be said to be in one of two mutually exclusive and exhaustive classes P or N . Membership of an object in P or N corresponds to an object's classi cation as a positive or negative instance of a concept, respectively. Decision trees are constructed using the following recursive procedure (see Figure 1). Initially, the \current node" is the root node of the whole decision tree. Let C be the set of objects to be classi ed by the subtree rooted at the current node. Initially, C contains all objects from which the tree will be constructed. 1. If all members of C are of the same class (i.e., positive or negative) or C is empty, then designate the current node as a leaf node, label it according to its class, and end the procedure. Otherwise, proceed through the following steps. 2. Let A be the attribute that has been selected to be used at the current node (see Section 3.1.5 for the description of how attributes are selected). The attribute A has possible values V = fA 1; A 2; . . . ; A g. 3. Use the attribute values to partition the set of objects C into the mutually exclusive and exhaustive subsets fC 1; C 2; . . . ; C g. Each subset C contains those objects in C that have value A for attribute A . 4. Create a child node in the tree for each attribute value A and corresponding subset C . Label the arc from the current node to the child node with the attribute value A . 5. For each child node, call the procedure recursively on the subset C with the set of available attributes fA ? A g. Since the number of available attributes decreases at each level in the decision tree construction, we must prepare for the possibility that the list of attributes becomes empty. In this situation we collapse the remaining sets into leaves and label the leaf nodes in one of three di�erent ways. One method consists of counting the number of positive and negative instances in the set and give the name of the majority to that set. A second method is to assign to the set the name P while indicating a + probability, where p and n are the number of positive and negative instances in the set, respectively. A method third is to label the leaf node as unidenti ed. i
i
i
i
i
i
ij
i
iv
iv
ij
i
ij
ij
ij
ij
i
p
p
n
6
3.1.4 Decision Tree Evaluation
In order to evaluate a decision tree, the objects need to be divided into two mutually exclusive sets before the decision tree is generated. The rst set is the \training set" and it will be used as the basis for the construction of the decision tree. The training set is the initial set of objects C in the procedure in Section 3.1.3. The decision tree generated, therefore, is a characterization of the training set objects. The remaining set of objects, not included in the training set, constitutes the \test set." After constructing the tree from the training set objects, we test its predictive accuracy against those objects in the test set. For each object in the test set, we apply the decision tree to its attribute values and determine if the tree correctly identi es the object as a positive or negative instance. The evaluation of the decision tree accuracy is calculated in terms of the percentage of correctly identi ed test set objects. Preliminary analysis has indicated that attribute selection is pivotal to tree accuracy | a judicious choice can yield greatly improved performance [Lan87a] [Qui83]. Therefore, two attribute selection methods were used in the study, and they are described in the next section.
3.1.5 Attribute Selection
The two attribute selection methods examined in this study both make the following assumptions: � For a set C with p objects in class P and n objects in class N , there is a + probability that an object randomly selected from a uniform distribution of C will be in P . Analogously, the probability that an object will be in N is + . � Decision trees classify objects into one of two classes. Thus, from one perspective we can think of the tree as generating a message \P" or \N". An attribute selection function is intended to assess the degree to which an attribute partitions the objects into subsets that are each either all positive or all negative. The centerpiece of an attribute selection function is its evaluation function. An evaluation function is applied to each subset of objects that resulted from using the attribute as a partition. An evaluation function measures the degree to which a subset is either positive or negative. Values returned by the evaluation functions range from zero (0) to one (1). An evaluation function returns the value zero if the subset is either all positive or all negative instances. An evaluation function returns the value one if the subset contains 50% positive and 50% negative instances. For a situation in between these two extremes, an evaluation function p
p
n
p
n
7
n
returns a value between zero and one. The two evaluation functions considered in this study base the intermediate calculation on di�erent methods. The rst evaluation function is log-based, while the second one is linear-based. The rst evaluation function was examined by Quinlan in [Qui85], and hence, is included here. The second function is included as an experimental control. The purpose of introducing a second evaluation function is to enable quantitative comparisons between its e�ectiveness and that of the log-based function described in [Qui85]. Consequently, the second evaluation function was chosen because of its straightforward nature. The rst evaluation function, derived from information theory and Hu�man coding (which results in optimally short encodings), refers to the amount of \information" needed to generate a \P" or \N" message[Qui85]:
I (p; n) := ? p +p n log2 p +p n ? p +n n log2 p +n n
The second evaluation function is a simple linear percentage: L(p; n) := if p = n then return(1) else if p < n then return( 2+ ) else return( 2+ ). In the second function, the constant 1 is returned when p and n are equal so that both functions return the same value in this case. When p and n are not equal, the function has 2p and 2n in the numerators of the values returned so that the resulting fractions will range throughout the interval [0; 1). Now suppose we have a set of attributes A = fA g. In order to evaluate the use of an attribute A as a root of a decision tree (or as a root of a subtree within a decision tree), the following procedure is undertaken. An attribute A has possible values V = fA 1; A 2; . . . ; A g which are used to partition the set of objects C into the subsets fC 1; C 2; . . . ; C g. Each subset C contains those objects in C that have value A for attribute A . Then the evaluation function applied to a subtree for C is F (p ; n ), where F is either the I or L evaluation function and p and n are the number of positive and negatives instances in C , respectively. The total number of positive and negative instances in the set of objects C are p and n, respectively, and the total number of objects in C is p + n. Hence, the attribute selection function for a tree with root A and based on object set C is: + n F (p ; n ) E (C; A ) = p p + n =1 p
p
n
n
p
n
i
i
i
i
i
i
iv
i
i
iv
ij
ij
ij
ij
i
ij
ij
ij
ij
X v
i
i
ij
ij
ij
ij
j
The attribute selection function E (C; A ) is simply a weighted average across the subtrees, with the weighting factor being the fraction of the total objects in each i
8
subtree.1 If the subtrees (i.e., subsets) resulting from the attribute's partitions are each either all positive instances or all negative (which means that each evaluation function calculation is zero), the attribute selection function returns the value zero. The attribute selection function E (C; A ) is applied to each attribute A . The attribute to be chosen is that which minimizes E (C; A ). For alternate attribute (or feature) selection methods, see [MC80] [MMHL86]. For further discussion, see [Sch86]. i
i
i
3.2 Previous Systems for Learning from Examples
The task of learning concepts from examples is a widely studied problem in machine learning [LC86]. Quite often this task entails the characterization of some concept, given a set of objects preclassi ed as positive or negative instances of that concept. This paradigm has been referred to as \instance-to-class" learning [DM86]. The characterization, to be valid, needs to be both complete and consistent. This is to say that the concept descriptions generated by a learning from examples system are intended to classify correctly all positive instances of a concept as such (completeness), and to not misclassify any of the negative instances (consistency) [LC86]. One of the earliest e�orts to address the learning from examples problem was the Concept Learning System (CLS) developed by Hunt in the 1950's and documented in [HMS66]. Pioneering work was also done in the eld of pattern recognition (for example, see [Wat69] [Mic80]). A large number of systems have been developed to tackle the learning problem. A useful framework for the understanding and comparison of these systems is discussed in [DM83]. Here, Dietterich and Michalski examine the following aspects of learning from examples systems. 1. Representational issues. How are objects represented by the system? How does the system constrain the types of concepts which can be learned? 2. Type of description sought. Descriptions may be characteristic, discriminant, or taxonomic. We are primarily interested in characteristic descriptions. Characteristic descriptions attempt to capture those attributes that di�erentiate objects in the conceptual class from objects not described by the concept. 3. Rules of generalization. What operations are performed by a system to construct and develop concept descriptions? For a thorough description of Since the number of objects p + n in the set C is constant over all the A and C , it may be omitted from the calculations. 1
i
9
ij
rules of generalization see [DM83]. Some common rules of generalization are the following: � Dropping conditions. � Turning constants to variables. � Adding internal disjunction. � Closing intervals. � Climbing generalization tree. 4. Induction techniques. The generalization of descriptions involves constructive and/or selective induction. Constructive induction applies when generalizations produce descriptions containing some descriptors not found in the original description. Selective induction is non-constructive induction. 5. Control strategy. Control in learning from examples systems can proceed in a bottom-up (data driven), top-down (model driven), or mixed manner. Bottom-up systems generally process information one object at a time while generalizing the current set of descriptions. Top-down systems start with a possible description and generalize or specialize the description until some \good" description that covers all the examples is found. Mixed systems incorporate aspects from both top-down and bottom-up strategies. 6. General vs. problem oriented methods. Systems can be contrasted by the scope of problem domains which they can characterize. Theoretically, any learning from examples system could be employed to analyze software resource data. The application of the above framework to a number of existing systems is presented in Figure 2 to better understand possible alternative methods (see also [DM79] and [DM83]). The systems characterized in the gure are Sprouter[Hay75] [Hay76] [HM77] [HM78], Induce[DM79], Arch[Win75] [Win77], Lex[Mit82] [MUNB83], and ID3[Qui85]. Systems examined in the gure re ect by no means the entirety of such systems, but are intended to be a representative sampling. As explained in Section 3.1.1, the ID3 system was selected as the basis for the tools developed in this study. The approach taken by that system allows the e�cient, automatic generation and evaluation of a large number of learning structures (i.e., decision trees) that can be naturally decomposed into production rules. Several other researchers have investigated \instance-to-class" learning problems (e.g., [BM78] [MC80] [MMHL86]). For a summary of current research directions, see [MAL*86] [Lan87b]. 10
4 The Software Environment Sixteen moderate and large size software systems were selected from a NASA software production environment for this study [BZM*77] [CMP*82] [SEL82]. The software is ground support software for unmanned spacecraft control. These systems range in size from 3000 to 112,000 lines of Fortran source code. They took between 5 and 140 person-months to develop over a period of 5 to 25 months. The sta� size ranged from 4 to 23 persons per project. The amount of software either reused or modi ed from previous systems averages 32% per project[Sel87]. There were from 83 to 531 modules in each system. The term modules is used to refer to the subroutines, functions, main programs, and block data in the systems. The 16 projects in the analysis contained over 4700 modules; these modules are the objects on which the analysis in this study is based. There are 74 attributes, or metrics, for each object. The attributes capture a wide range of information about the objects, including development e�ort, faults, changes, design style, implementation style, size, and static complexity[BSP83] [BS85]. The development data spans the beginning of design speci cation to the end of acceptance testing. A subset of the attributes are available early in the development of the objects, speci cally at the end of the design phase. Twenty-nine of the 74 attributes have early availability. The study covers the construction of decision trees using all available attributes as well as just those that are available early in development. A learning system that performs satisfactorily based just on the early attributes would provide a mechanism to forecast the outcome of software projects. Another subset of the available attributes, whose impact on decision tree performance would be useful to characterize, is the set of attributes that have a relatively low cost associated with their collection. Appendix A lists the 74 attributes and indicates the 29 attributes with early availability.
5 Data Analysis Methods and Tools
5.1 Data Collection Methods and Analysis Tools
The data collection and analysis for this study was based on a variety of data collection forms [BZM*77], programmer interviews [BW84], static analysis tools [DT82], and statistical analysis programs [Ins82]. For a discussion of the data validation methods, see [BSP83] and [BW84]. A set of decision tree generation and evaluation tools were developed for this study, including some necessary data manipulation tools. Figure 3 gives a ow diagram outlining the tools developed for the tree generation and analysis process. The tools are straightforward and 11
are intended to be reused in future analyses. In particular, the attribute selection functions are encapsulated within two small routines in the decision tree builder.
5.2 Evaluation Using Analysis of Variance Models
There are a large range of factors that may contribute to the performance of a system for learning from examples. In order to assess their individual contributions, an analysis of variance statistical model was applied. The use of the model required that a total of 9600 decision trees be generated and analyzed. The tree generation and analysis process was completely automated using the tools pictured in Figure 3. Each decision tree was constructed from a particular training set of objects. Each tree also had associated with it a test set of objects. The trees were evaluated by running each object in the test set through the tree until a leaf was encountered. The percentage of objects correctly identi ed was then determined by totaling the matches between the instance classes (positive or negative) at the leaves and those of the test objects. The analysis of variance model was a 24x5x15 full-factorial design [CC50] [BHH78]. Since the tree generation and analysis was automated, the increased sensitivity of a full-factorial design was preferred over a more economical fractionalfactorial design[Sch59]. There were six independent variables and four dependent variables. The data analysis included the 15 two-way interactions among the six independent variables. The independent variables, levels of the independent variables, and dependent variables are listed below.
5.2.1 Independent Variables 1. Dependent variable. Two key classes of objects were selected to indicate
positive instances of objects. In one interpretation, objects with \high" total development e�ort were considered as positive instances, while the remaining objects were negative instances. In a second interpretation, objects with \high" numbers of software faults were considered as positive instances, while the remaining objects were negative. In both interpretations, \high" means that the objects were in the uppermost quartile (i.e., 25%) of the respective measures, relative to all objects in the training set. Both of these classes of objects are useful to characterize, as motivated in Section 3.1.2. In this study, we refer to the class of object characterized by a decision tree as the \dependent variable." This is not to be confused with the dependent variables for the analysis of variance model, which are described in Section 5.2.2. There are two di�erent levels of this variable: 12
� Total development e�ort � Total number of faults 2. Attribute availability. Attributes that are available early in the software
module development process enable the forecasting of project outcome. For more detail on the attributes, see Section 4 and Appendix A. There are two di�erent levels of this variable: � Early attributes � All attributes 3. Evaluation function heuristic. The evaluation function heuristic is a central issue in decision tree construction. See Section 3.1.5. There are two di�erent levels of this variable: � Information theory, log-based � Linear 4. Tree termination criteria. There are a variety of ways to terminate the construction of a decision tree. If tree construction continues until all the leaf nodes have either 100% positive instances or 100% negative instances, that is referred to as 0% tolerance. If termination is allowed when (100{N)% of the objects at a leaf are all of one instance class, that is referred to as N% tolerance. Allowing for tolerance desensitizes a tree to noisy data in the training set and enables the generation of simpler (shorter) production rules. Recall that a decision tree can be naturally decomposed into a set of production rules. An alternative termination method is based on specifying an upper limit to the depth of the decision tree (i.e., for the number of nonterminals (or predicates) between the root and a leaf). This method is motivated by the desire to have explicit control over production rule length. There are ve di�erent levels of this variable: � 0% tolerance � 10% tolerance � 25% tolerance � 40% tolerance � � 10 predicates 13
5. Number of projects in the training set. The training sets were the objects (software modules) in a chronological sequence of projects. The number of projects in the training sets ranged from 1 to 15; recall that there were 16 total projects. The test set for a given training set would be the objects in the next project chronologically after the training set. All possible con gurations of training sets were generated (there were 120). This independent variable is intended to capture the relationship between the number of projects in the training set and decision tree performance. The variable re ects the amount of data in the training sets and the length of the \lifetime" of usefulness for training data. Note that because all projects did not have the same number of objects and same duration, this variable is not a direct measure of the number of training set objects or training data age. There are 15 di�erent levels of this variable: � 15 levels, one level for each training set size (ranging from 1{15 projects); the Nth level corresponds to N projects in the training set 6. Ordinal grouping of attributes. The 74 objects attributes are all quantitative measures. An attribute's numeric values were mapped into symbolic values based on the quartiles or octiles for the data. Quartiles partition a set of values into four subsets, each containing 25% of the values. Octiles partition into eight subsets, each containing 12.5%. Earlier analysis has indicated the appropriateness of quartiles for software resource data[BS85]. However, we did not want to limit unnecessarily the di�erentiation provided by the attributes, and hence, included both mappings. There are two di�erent levels of this variable: � Quartiles (4 ordinal groupings) � Octiles (8 ordinal groupings)
5.2.2 Dependent Variables 1. Accuracy. Percentage of objects in the test set correctly identi ed. 2. Inaccuracy. Percentage of objects in the test set incorrectly identi ed. 3. Undetermined. Percentage of objects in the test set not identi ed (it is
possible for a particular path in the tree generated from the training set to have exhausted all available attributes, without ful lling the tree termination criteria). 14
4. Complexity. The number of unique attributes in the tree in the top ve levels, inclusive (the root is the rst level). The threshold of ve levels was chosen to help provide a meaningful comparison of the upper tree complexity across a variety of shapes and sizes of trees.
6 Characterizing Decision Tree Accuracy The primary measurement of decision tree accuracy is the percentage of objects in the test set that were correctly identi ed. Two sample decision trees are included in Appendix B. The percentage of objects correctly identi ed for the two trees was 96.2% and 98.4%. Figure 4 summarizes the analysis of variance of the factors that contribute to this measure of tree accuracy. Also included are the percentage incorrectly identi ed and the percentage not identi ed. All six primary factors were statistically signi cant at the level of � < .0003. The tree termination criteria of 40% and 25% tolerance were not statistically di�erent, but were both statistically greater than the other criteria (simultaneous � < .05, using Tukey's multiple comparisons[CC50]). The criteria of 10% was statistically greater than the remaining two (simultaneous � < .05). There were several statistically signi cant relationships among the number of projects in the training set. In summary, a smaller number of projects (1{3) resulted in a lower accuracy than the others, while a larger number of projects (13{15) resulted in a higher accuracy (simultaneous � < .05). For the percentage of objects correctly identi ed, eight of the 15 two-way interactions among the factors were statistically signi cant at the � < .05 level (actually, all their signi cant levels were below .0007). Five of the interactions are illustrated in Figures 5, 6, 7, 8, and 9. Since a wide range of signi cant results have emerged from the analysis, visualization of the results is emphasized in the data analysis sections of the paper, through gures such as these. Especially interesting are the tradeo�s, such as between the evaluation function heuristics and tree termination criteria in Figure 8. Also intriguing are the thresholds, such as that around 13 projects for development e�ort in Figure 9. In any of the gures that compare attributes with early availability versus all attributes, one interpretation perspective is the attributes' ability to characterize future states of an evolving system.
15
7 Characterizing Decision Tree Complexity The primary measurement of decision tree complexity is the number of unique attributes in the top ve levels of the tree. This complexity measure is restricted to the top ve levels to enable comparison of the upper tree complexity across a variety of tree shapes and sizes. The attributes in the uppermost tree levels provide the best di�erentiation among the objects, and hence, these attributes are the most useful to obtain. This information together with that pertaining to decision tree composition may provide insight into the number of di�erent attributes which should be collected to insure the greatest descriptive accuracy. It may also help give collection priorities to attributes when data collection resources are very limited. Figure 10 summarizes the analysis of variance of the factors that contribute to this measure of tree complexity. All six primary factors were statistically signi cant at the level of � < .0009. The di�erences for attribute availability and tree termination criteria are illustrated in Figures 11 and 12. The tree termination criteria of 40% tolerance resulted in the least complex trees, second lowest was 25% tolerance, third was 10% tolerance, and most complex were 0% tolerance and � 10 predicates, which were not statistically di�erent (all simultaneous � < .05). There were several statistically signi cant relationships among the number of projects in the training set. In summary, a smaller number of projects (1{3) resulted in a lower complexity than the others, while a more moderate to larger number of projects (7{15) resulted in a higher complexity (simultaneous � < .05). For the number of unique upper tree attributes, almost all (13 out of 15) of the two-way interactions among the factors were statistically signi cant at the � < .05 level (actually, all their signi cant levels were below .008). Ten of the interactions are illustrated in Figures 13, 14, 15, 16, 17, 18, 19, 20, 21, and 22. Interesting tradeo�s surface in the interactions of tree termination criteria with the dependent variable modeled (Figure 15), evaluation heuristic (Figure 19), and ordinal groupings (Figure 21). Also note the drop-o�s in the tree complexity, with respect to the dependent variable (Figure 16) and attribute availability (Figure 18), when approximately 9 projects are in the training set.
8 Characterizing Decision Tree Composition There was a great variety in the attributes selected at various levels of the tree. Eighteen of the 29 attributes that were available early each appeared as the attribute selected rst (at the tree's root) at least once, when development e�ort was the dependent variable. Sixteen of the 29 were selected for the number of 16
faults. There was less diversity in the rst attribute selected when all attributes were considered. Five di�erent attributes (of the 74 total) were chosen for trees modeling development e�ort, and seven di�erent attributes were chosen for those modeling number of faults. Further analysis of the composition of the trees is underway.
9 Conclusions This paper has presented an analysis of a decision tree-based approach to the machine learning problem of learning from examples. Decision trees have the bene t of being general structures that can be automatically generated and evaluated and naturally decomposed into a set of production rules. The attribute evaluation heuristics can result in relatively rapid construction of the trees, as they did in this analysis, but we do not imply that this is the case for all heuristics and data sets. The empirical results presented in this study are intended to provide the basis for analysis of decision tree generation and evaluation | it is not implied that there is a direct extrapolation of these results to other environments and data sets. Further work is underway to expand the scope of analysis and to re ne the underlying principles driving the results. Numerous statistically signi cant results emerged from this work. The highest overall decision tree accuracy , in terms of percentage of test set objects correctly identi ed, was achieved using the following combination of factors: � the log-based, information theory evaluation function heuristic, as opposed to the linear one; � either 25% or 40% tolerance in the tree termination criteria, as opposed to either 0% or 10% tolerance, or a limit of 10 predicates per path; � the full set of all available attributes, as opposed to just the ones available early; � between 13{15 projects in the training set, as opposed to fewer projects; � octile ordinal groupings of attributes, as opposed to quartiles; and � total development e�ort as the dependent variable, as opposed to the number of software faults. See Figure 23 for results obtained from trees constructed with these parameters. 17
The lowest overall decision tree complexity , in terms of the number of unique attributes in the top ve levels of a tree, was achieved using the following combination of factors: � the linear evaluation function heuristic; � 40% tolerance in the tree termination criteria; � the full set of all available attributes; � between 1{3 projects in the training set; � octile ordinal groupings of attributes; and � the number of software faults as the dependent variable. Note that there were several interactions across these primary factors. Some major results from this work are the following. 1. For this data set, three primary factors satis ed both tree generation goals of high accuracy and low complexity: 40% tolerance in the tree termination criteria, full set of all available object attributes, and octile ordinal groupings of attributes. 2. For this data set, the remaining three factors resulted in tradeo�s between the goals of high accuracy and low complexity: evaluation function heuristic, number of projects in the training set, and dependent variable on which positive-negative instance classi cation was based. 3. Decision tree accuracy, complexity, and composition varied widely, indicating the necessity of specifying the key factors that contribute to | and detract from | tree performance. 4. Several individual factors and interactions across factors made a statistically signi cant improvement in either tree accuracy or/and complexity; the interrelationships are illustrated in the paper by graphical plots. 5. The machine learning method of decision tree generation is a useful technology for analyzing software resource data. 6. Empirical characterization and evaluation provides insights into decision tree generation as a solution method for the problem of learning from examples. 18
10 Acknowledgements The authors are grateful to Pat Langley, Paul O'Rorke, and Ross Quinlan for their insights regarding this work.
19
A Attributes The 74 attributes (metrics) for the objects (software modules) are listed below. Twenty-nine of the 74 attributes are available early in development, speci cally by the end of the design phase. These 29 attributes are listed with an asterisk (*).
Fault and Change Attributes errors; errors per 1000 source lines; errors per 1000 executable statements; faults; fault correction e�ort per 1000 source lines; fault correction e�ort per 1000 executable statements; fault correction e�ort; fault implementation e�ort; fault isolation e�ort; faults per 1000 source lines; faults per 1000 executable statements; change correction e�ort; change implementation e�ort; change isolation e�ort; changes; modi cations; multiple module changes; multiple module faults.
Development E�ort Attributes design e�ort (*); code e�ort; design e�ort per module call (*); design e�ort per code e�ort; design e�ort per comment (*); design e�ort per function call (*); design e�ort per function plus module call (*); design e�ort per input-output statement (*); design e�ort per input-output parameter (*); overhead e�ort; percent code e�ort of total development e�ort; percent design e�ort of total development e�ort; test e�ort; total e�ort; total development e�ort per 1000 source lines; total development e�ort per 1000 executable statements.
Design and Implementation Style Attributes assignment statements per 1000 executable statements; module calls per comment (*); module calls per function plus module call (*); module calls per inputoutput statement (*); module calls per input-output parameter (*); comments (*); function calls per module call (*); function calls per comment (*); function calls per function plus module call (*); function calls per input-output statement (*); function calls per input-output parameter (*); function plus module calls per comment (*); function plus module calls per input-output statement (*); function plus module calls per input-output parameter (*); function plus module calls per 1000 source lines; function plus module calls per 1000 executable statements; function plus module calls (*); input-output statements per comment (*); inputoutput statements per input-output parameter (*); input-output statements per 1000 executable statements; input-output parameters per comment (*); source lines; source lines minus comments; cyclomatic complexity; cyclomatic complexity 20
per 1000 source lines; cyclomatic complexity per 1000 executable statements; assignment statements; module calls (*); decisions; format statements; function calls (*); input-output statements (*); input-output parameters (*); operands; operators; origin (*); versions; executable statements; total operands; total operators.
21
B Example Decision Trees Generated Enclosed are two sample decision trees. The rst tree was generated with the following parameters: total e�ort as the dependent variable, early attribute availability, projects 2{15 in the training set, project 16 as the test set, octile groupings for the attributes, 25% tolerance as the tree termination criteria, and linear heuristic. When the test set was applied to the tree, 352 out of 366 objects were correctly identi ed, which was 96.2%. Note that this is using only attributes that are available early in the software development process. The trees are printed with one node per line, where a node is either a nonterminal (an attribute) or a terminal (a positive or negative instance classi cation). On each line, the rst number indicates the level of the node (0 is the level of the root). The second number indicates which child the node is (0 is the rst child, meaning the ordinal grouping that has the smallest values; 7 is the last child for octiles and 3 is the last child for quartiles, meaning the ordinal grouping that has the largest values | note that every ordinal grouping might not be listed as a child if there were several tied values exactly on the break point between ordinal groupings). The third number gives the number of training set objects that followed this path. The fourth number is the percentage of the training objects that were positive instances. Terminal nodes that constitute positive instances have `++++++++' listed before the dependent variable name and those that are negative instances have `||' before the name. If a node is a nonterminal, the attribute is listed. The indentation helps visualize the tree levels; the indentation is three spaces per level. The second tree was generated with the following parameters: total e�ort as the dependent variable, all available attributes, projects 11{15 in the training set, project 16 as the test set, octile groupings for the attributes, 10% tolerance as the tree termination criteria, and information theory heuristic. When the test set was applied to the tree, 360 out of 366 objects were correctly identi ed, which was 98.4%.
22
First sample decision tree: 0
0 1 1 1
1 1
2218 25.1 design effort 0 973 13.9 ---- total_effort 3 293 9.6 ---- total_effort 4 56 33.9 input-output parameters 2 0 3 33.3 module calls per function plus module call 3 0 1 0.0 ---- total_effort 3 2 1 100.0 ++++++++ total_effort 3 3 1 0.0 ---- total_effort 2 1 6 16.7 ---- total_effort 2 2 11 9.1 ---- total_effort 2 3 7 14.3 ---- total_effort 2 4 5 20.0 ---- total_effort 2 5 12 33.3 input-output statements per input-output parameter 3 0 1 0.0 ---- total_effort 3 3 2 0.0 ---- total_effort 3 4 3 0.0 ---- total_effort 3 5 3 66.7 comments 4 2 1 0.0 ---- total_effort 4 3 1 100.0 ++++++++ total_effort 4 6 1 100.0 ++++++++ total_effort 3 6 2 100.0 ++++++++ total_effort 3 7 1 0.0 ---- total_effort 2 6 4 75.0 ++++++++ total_effort 2 7 8 87.5 ++++++++ total_effort 5 320 19.7 ---- total_effort 6 277 28.2 comments 2 0 21 4.8 ---- total_effort 2 1 34 5.9 ---- total_effort 2 2 29 3.4 ---- total_effort 2 3 37 18.9 ---- total_effort 2 4 34 17.6 ---- total_effort 2 5 48 33.3 function calls per module call 3 0 21 33.3 input-output statements per comment 4 0 3 33.3 function plus module calls per input-output statement 5 0 1 0.0 ---- total_effort 5 5 1 100.0 ++++++++ total_effort 5 7 1 0.0 ---- total_effort
23
4 4
3
2
3 3 3 6 3 3
3
2 3
4 3
25.0 66.7
---- total_effort function plus module calls per input-output statement 5 0 1 100.0 ++++++++ total_effort 5 5 1 0.0 ---- total_effort 5 6 1 100.0 ++++++++ total_effort 4 4 3 0.0 ---- total_effort 4 5 4 25.0 ---- total_effort 4 6 2 100.0 ++++++++ total_effort 4 7 2 0.0 ---- total_effort 4 6 33.3 function plus module calls 4 5 1 0.0 ---- total_effort 4 6 2 100.0 ++++++++ total_effort 4 7 3 0.0 ---- total_effort 5 8 25.0 ---- total_effort 6 8 12.5 ---- total_effort 7 5 80.0 ++++++++ total_effort 37 51.4 function plus module calls per comment 0 3 0.0 ---- total_effort 2 7 57.1 input-output statements per comment 4 0 1 100.0 ++++++++ total_effort 4 3 1 0.0 ---- total_effort 4 4 3 66.7 module calls per function plus module call 5 2 1 100.0 ++++++++ total_effort 5 4 1 0.0 ---- total_effort 5 7 1 100.0 ++++++++ total_effort 4 5 1 100.0 ++++++++ total_effort 4 6 1 0.0 ---- total_effort 3 10 70.0 design effort per module call 4 4 1 0.0 ---- total_effort 4 5 6 66.7 function plus module calls per input-output parameter 5 2 3 33.3 input-output statements 6 0 1 0.0 ---- total_effort 6 3 1 100.0 ++++++++ total_effort 6 7 1 0.0 ---- total_effort 5 4 1 100.0 ++++++++ total_effort 5 6 1 100.0 ++++++++ total_effort 5 7 1 100.0 ++++++++ total_effort
24
3 3
2
3 3 7 3
3 3
1
7
3 299
4 4 5 4 4 4 4 6 7 37 0 4 4 4 4 4
4 5 4 4 4 4 4 6
6 3 100.0 ++++++++ total_effort 1 100.0 ++++++++ total_effort 5 40.0 input-output parameters 2 1 0.0 ---- total_effort 3 1 100.0 ++++++++ total_effort 6 2 0.0 ---- total_effort 7 1 100.0 ++++++++ total_effort 5 0.0 ---- total_effort 6 83.3 ++++++++ total_effort 70.3 function calls per function plus module call 12 66.7 design effort per module call 3 1 0.0 ---- total_effort 4 6 100.0 ++++++++ total_effort 5 2 0.0 ---- total_effort 6 1 100.0 ++++++++ total_effort 7 2 50.0 input-output statements per input-output parameter 5 0 1 100.0 ++++++++ total_effort 5 3 1 0.0 ---- total_effort 6 100.0 ++++++++ total_effort 8 37.5 function plus module calls 3 1 100.0 ++++++++ total_effort 4 1 0.0 ---- total_effort 5 1 0.0 ---- total_effort 6 1 100.0 ++++++++ total_effort 7 4 25.0 ---- total_effort 11 81.8 ++++++++ total_effort 77.9 ++++++++ total_effort
25
Second sample decision tree: 0
0 1 1 1 1
1
667 25.3 test effort 0 250 3.2 ---- total_effort 3 85 4.7 ---- total_effort 4 82 3.7 ---- total_effort 5 83 16.9 code effort 2 0 1 0.0 ---- total_effort 2 1 5 0.0 ---- total_effort 2 2 6 0.0 ---- total_effort 2 3 17 5.9 ---- total_effort 2 4 12 0.0 ---- total_effort 2 5 16 6.3 ---- total_effort 2 6 17 17.6 design effort per code effort 3 0 3 0.0 ---- total_effort 3 3 5 0.0 ---- total_effort 3 4 6 0.0 ---- total_effort 3 5 2 100.0 ++++++++ total_effort 3 6 1 100.0 ++++++++ total_effort 2 7 9 100.0 ++++++++ total_effort 6 81 67.9 code effort 2 1 1 0.0 ---- total_effort 2 3 5 20.0 total development effort per 1000 source lines 3 2 1 100.0 ++++++++ total_effort 3 4 1 0.0 ---- total_effort 3 5 1 0.0 ---- total_effort 3 6 2 0.0 ---- total_effort 2 4 8 12.5 design effort per code effort 3 0 3 0.0 ---- total_effort 3 3 1 0.0 ---- total_effort 3 4 1 0.0 ---- total_effort 3 5 1 0.0 ---- total_effort 3 6 1 0.0 ---- total_effort 3 7 1 100.0 ++++++++ total_effort 2 5 19 47.4 design effort per module call 3 0 7 0.0 ---- total_effort 3 3 1 100.0 ++++++++ total_effort 3 4 1 0.0 ---- total_effort 3 5 5 80.0 modifications 4 0 1 100.0 ++++++++ total_effort
26
2
1
2 7
4 4 1 100.0 ++++++++ total_effort 4 5 1 100.0 ++++++++ total_effort 4 6 1 0.0 ---- total_effort 4 7 1 100.0 ++++++++ total_effort 3 6 2 100.0 ++++++++ total_effort 3 7 3 66.7 modifications 4 0 1 100.0 ++++++++ total_effort 4 5 1 100.0 ++++++++ total_effort 4 6 1 0.0 ---- total_effort 6 32 87.5 function plus module calls per 1000 source lines 3 0 3 100.0 ++++++++ total_effort 3 2 6 100.0 ++++++++ total_effort 3 3 3 33.3 errors 4 0 2 0.0 ---- total_effort 4 7 1 100.0 ++++++++ total_effort 3 4 8 100.0 ++++++++ total_effort 3 5 4 100.0 ++++++++ total_effort 3 6 4 100.0 ++++++++ total_effort 3 7 4 50.0 errors 4 0 1 0.0 ---- total_effort 4 5 1 0.0 ---- total_effort 4 6 1 100.0 ++++++++ total_effort 4 7 1 100.0 ++++++++ total_effort 7 16 100.0 ++++++++ total_effort 86 98.8 ++++++++ total_effort
27
References [Bas80]
V. R. Basili. Tutorial on Models and Metrics for Software Management and Engineering. IEEE Computer Society, New York, 1980. [BB81] J. W. Bailey and V. R. Basili. A meta-model for software development resource expenditures. In Proc. Fifth Int. Conf. Software Engr., pages 107{116, San Diego, CA, 1981. [BFL71] B. Buchanan, E. Feigenbaum, and J. Lederberg. A heuristic programming study of theory formation in sciences. In Proceedings of the Second International Joint Conference of Arti cial Intelligence, London, England, 1971. [BHH78] G. E. P. Box, W. G. Hunter, and J. S. Hunter. Statistics for Experimenters. John Wiley & Sons, New York, 1978. [BM78] B. G. Buchanan and T. M. Mitchell. Model-directed learning of production rules. In D. A. Waterman and F. Hayes-Roth, editors, Pattern-Directed Inference Systems, Academic Press, New York, 1978. [Boe81] B. W. Boehm. Software Engineering Economics. Prentice-Hall, Englewood Cli�s, NJ, 1981. [Bro81] W. D. Brooks. Software technology payo�: some statistical evidence. Journal of Systems and Software, 2:3{9, 1981. [BS85] V. R. Basili and R. W. Selby. Calculation and use of an environment's characteristic software metric set. In Proc. Eighth Int. Conf. Software Engr., London, August 28-30, 1985. [BSP83] V. R. Basili, R. W. Selby, and T. Y. Phillips. Metric analysis and data validation across fortran projects. IEEE Transactions on Software Engineering, SE-9(6):652{663, Nov. 1983. [BW84] V. R. Basili and D. M. Weiss. A methodology for collecting valid software engineering data. IEEE Transactions on Software Engineering, SE-10(6):728{738, Nov. 1984. [BZM*77] V. R. Basili, M. V. Zelkowitz, F. E. McGarry, Jr. R. W. Reiter, W. F. Truszkowski, and D. L. Weiss. The Software Engineering Laboratory. Technical Report SEL-77-001, Software Engineering Laboratory, NASA/Goddard Space Flight Center, Greenbelt, MD, May 1977. 28
[CC50]
W. G. Cochran and G. M. Cox. Experimental Designs. John Wiley & Sons, New York, 1950. [CMM83] J. Carbonell, R. Michalski, and T. Mitchell. An overview of machine learning. In R. Michalski, J. Carbonell, and T. Mitchell, editors, Machine Learning : An Arti cial Intelligence Approach, Tioga, Palo Alto, CA, 1983. [CMP*82] D. N. Card, F. E. McGarry, J. Page, S. Eslinger, and V. R. Basili. The Software Engineering Laboratory. Technical Report SEL-81-104, Software Engineering Laboratory, NASA/Goddard Space Flight Center, Greenbelt, MD, Feb. 1982. [CN86] Peter Clark and Tim Niblett. The CN2 Induction Algorithm. Technical Report, The Turing Institute, Glasgow, G1 2AD, U.K., 1986. [DM79] T. Dietterich and R. Michalski. Learning and generalization of characteristic descriptions: evaluation criteria and comparative review of selected methods. In Proceedings of the Sixth International Joint Conference of Arti cial Intelligence, pages 223{231, Tokyo, 1979. [DM83] T. Dietterich and R. Michalski. A comparative review of selected methods of learning from examples. In R. Michalski, J. Carbonell, and T. Mitchell, editors, Machine Learning : An Arti cial Intelligence Approach, Tioga, Palo Alto, CA, 1983. [DM86] T. G. Dietterich and R. S. Michalski. Learning to predict sequences. In R. S. Michalski, J. Carbonell, and T. Mitchell, editors, Machine Learning : An Arti cial Intelligence Approach, Volume II, pages 63{ 106, Morgan Kaufmann, Los Altos, CA, 1986. [DT82] W. J Decker and W. A. Taylor. FORTRAN Static Source Code Analyzer Program (SAP) User's Guide (Revision 1). Technical Report SEL-78-102, Software Engineering Laboratory, NASA/Goddard Space Flight Center, Greenbelt, MD, May 1982. [Eve80] B. S. Everitt. Cluster Analysis, 2nd ed. Heineman Educational Books Ltd., London, 1980. [Hay75] F. Hayes-Roth. Collected Papers on Learning and Recognition of Structured Patterns. Technical Report, Carnegie-Mellon Univ, 1975. 29
[Hay76]
F. Hayes-Roth. Patterns of Induction and Associated Knowledge Acquisition Algorithms. Technical Report, Carnegie-Mellon Univ, 1976. [HM77] F. Hayes-Roth and J. McDermott. Knowledge acquisitions from structure descriptions. In Proceedings of the Fifth International Joint Conference of Arti cial Intelligence, Cambridge, Mass, 1977. [HM78] F. Hayes-Roth and J. McDermott. An interference matching technique for inducing abstractions. Communications of the ACM, 21(5):401{410, 1978. [HMS66] E. B. Hunt, J. Marin, and P. Stone. Experiments in Induction. Academic Press, New York, 1966. [Ins82] SAS Institute. Statistical Analysis System (SAS) User's Guide. Technical Report, SAS Institute Inc., Box 8000, Cary, NC, 27511, 1982. [Lan87a] P. Langley. Personal communication, University of California, Irvine, 1987. [Lan87b] P. Langley, editor. Proceedings of the Fourth International Workshop on Machine Learning. University of California, Irvine, CA, June 1987. [LC86] P. Langley and J. Carbonell. Language Acquisition and Machine Learning. Technical Report 86-12, Univ. Cal., Irvine, 1986. [LF85] P. Langley and D. Fisher. Methods of Conceptual Clustering and their Relation to Numerical Taxonomy. Technical Report 85{26, U.C Irvine, Irvine, Ca., 1985. [MAL*86] R. S. Michalski, S. Amarel, D. B. Lenat, D. Michie, and P. H. Winston. Machine learning: challenges of the eighties. In R. S. Michalski, J. Carbonell, and T. Mitchell, editors, Machine Learning : An Arti cial Intelligence Approach, Volume II, pages 27{41, Morgan Kaufmann, Los Altos, CA, 1986. [MC80] R. S. Michalski and R. L. Chilausky. Learning by being told and learning from examples: an experimental comparison of the two methods of knowledge acquisition in the context of developing an expert system for soybean disease diagnosis. Policy Analysis and Information Systems, 4(2), June 1980. 30
[Mic80]
R. S. Michalski. Pattern recognition as rule guided inductive inference. IEEE Transactions on Pattern Analysis and Machine Intelligence, 2(4), 1980. [Mic87] R. S. Michalski. How to learn imprecise concepts: a method for employing a two-tiered knowledge representation in learning. In Proceedings of the Fourth International Workshop on Machine Learning, pages 50{58, Irvine, CA, June 1987. [Mit80] T. M. Mitchell. The Need for Biases in Learning Generalizations. Technical Report CBM{TR{117, Rutgers University, Dept. of Computer Science, New Brunswick, NJ, 1980. [Mit82] T. Mitchell. Generalization as search. Arti cial Intelligence, 18(2):203{226, 1982. [MMHL86] R. S. Michalski, I. Mozetic, J. Hong, and N. Lavrac. The multipurpose incremental learning system aq15 and its testing application to three medical domains. In Proceedings of the AAAI Conference, Philadelphia, PA, 1986. [Mul72] S. A. Mulaik. The Foundations of Factor Analysis. McGraw-Hill, New York, 1972. [MUNB83] T. Mitchell, P. Utgo�, B. Nudel, and R. Bannerji. Learning by experimentation: acquiring and re ning problem-solving heuristics. In R. Michalski, J. Carbonell, and T. Mitchell, editors, Machine Learning : An Arti cial Intelligence Approach, Tioga, Palo Alto, CA, 1983. [ORo82] P. O'Rorke. A Comparative Study of Inductive Learning Systems AQ11P and ID-3 Using a Chess Endgame Test Problem. Technical Report ISG 82-2, University of Illinois, Dept. of Computer Science, Urbana, IL, September 1982. [Put78] L. Putnam. A general empirical solution to the macro software sizing and estimating problem. IEEE Trans. Software Engr., 4(4), 1978. [QCHL86] J. R. Quinlan, P. J. Compton, K. A. Horn, and L. Lazarus. Inductive knowledge acquisition: a case study. In Proceedings of the Second Australian Conference on Applications of Expert Systems, Sydney, 1986. 31
[Qui79]
[Qui83]
[Qui85] [RST87]
[Sch59] [Sch86] [SEL82]
[Sel87] [Sim83] [TP79] [Wat69]
J. R. Quinlan. Discovering rules by induction from large collections of examples. In D. Michie, editor, Expert Systems in the MicroElectronic Age, pages 168{201, Edinburgh University Press, Edinburgh, 1979. J. R. Quinlan. Learning e�cient classi cation procedures and their application to chess end games. In R. Michalski, J. Carbonell, and T. Mitchell, editors, Machine Learning : An Arti cial Intelligence Approach, Tioga, Palo Alto, CA, 1983. J. Quinlan. Induction of Decision Trees. Technical Report 85.6, New South Wales Institute of Technology, Australia, 1985. L. Rendell, R. Seshu, and D. Tcheng. More robust concept learning using dynamically-variable bias. In Proceedings of the Fourth International Workshop on Machine Learning, pages 66{78, Irvine, CA, June 1987. H. Sche�e. The Analysis of Variance. John Wiley & Sons, New York, 1959. Je� Schlimmer. A Note on Correlational Measures. Technical Report 86-13, University of California, Irvine, CA, May 1986. SEL. Annotated Bibliography of Software Engineering Laboratory (SEL)Literature. Technical Report SEL-82-006, Software Engineering Laboratory, NASA/Goddard Space Flight Center, Greenbelt, MD, Nov. 1982. Richard W. Selby. Characterization of Software Reuse at the Project, Module Design, and Module Implementation Levels. Technical Report TR-87-12, University of California, Irvine, 1987. H. Simon. Why should machines learn. In R. Michalski, J. Carbonell, and T. Mitchell, editors, Machine Learning : An Arti cial Intelligence Approach, Tioga, Palo Alto, CA, 1983. Thayer and Pyster. Twenty problems in software development. In Proceedings of IEEE COMPSAC, 1979. S. Watanabe. Methodologies of Pattern Recognition. Academic Press, New York, 1969. 32
[WF77] [Win75] [Win77]
C. E. Walston and C. P. Felix. A method of programming measurement and estimation. IBM Systems J., 16(1):54{73, 1977. P. Winston. Learning Structural Descriptions from Examples. Mcgraw-Hill, New York, 1975. P. Winston. Arti cial Intelligence. Addison-Wesley, New York, 1977.
33
A1
4{5
0{3
?
10