Learning Implicit User Interest Hierarchy for Context in Personalization Hyoung R. Kim
Philip K. Chan
Department of Computer Sciences Florida Institute of Technology
Department of Computer Sciences Florida Institute of Technology
Melbourne, FL 32901, USA
[email protected]
Melbourne, FL 32901, USA
[email protected]
exhibit different kinds of interests at different times, which provide different contexts underlying a user's behavior. However, different kinds of interests might be motivated by the same kind of interest at a higher abstraction level (computer science research, for example). That is, a user might possess interests at different abstraction levels—the higher-level interests are more general, while the lower-level ones are more specific. Furthermore, more general interests, in some sense, correspond to longer-term interests, while more specific interests correspond to shorter-term interests. During a browsing session, the general interests are back on one's mind, while specific interests are one's current foci. Unlike News Dude [2], which generates a long-term and a short-term model, we model a continuum of long-term to short-term interests. We believe identifying the appropriate context underlying a user's behavior is important in more accurately pinpointing her interests.
ABSTRACT To provide a more robust context for personalization, we desire to extract a continuum of general (long-term) to specific (short-term) interests of a user. Our proposed approach is to learn a user interest hierarchy (UIH) from a set of web pages visited by a user. We devise a divisive hierarchical clustering (DHC) algorithm to group words (topics) into a hierarchy where more general interests are represented by a larger set of words. Each web page can then be assigned to nodes in the hierarchy for further processing in learning and predicting interests. This approach is analogous to building a subject taxonomy for a library catalog system and assigning books to the taxonomy. Our approach does not need user involvement and learns the UIH "implicitly." Furthermore, it allows the original objects, web pages, to be assigned to multiple topics (nodes in the hierarchy). In this paper, we focus on learning the UIH from a set of visited pages. We propose a few similarity functions and dynamic threshold-finding methods, and evaluate the resulting hierarchies according to their meaningfulness and shape.
The web is not static — new documents and new words/phrases are created every day. Most clustering methods cluster objects (documents). This representation is inadequate in a dynamic environment like the web. Consider how a librarian would form taxonomy of the subjects for all the books in the library. She would first identify the subject(s) of a book and then cluster all the books on the bases of the subject. Finally, books are categorized by the taxonomy. STC [15] does not rely on a fixed vector of word features in clustering documents. We use a similar approach—instead of clustering documents, we cluster features in the documents; documents are then assigned to the clusters. We propose to model general/long-term and specific/short-term interests with a concept hierarchy called User Interest Hierarchy (UIH). The resulting hierarchy (UIH) is used to build Page Interest Estimator (PIE)'s [3] as well as providing a context. For each cluster in UIH, the associated documents are used as positive examples for learning a PIE. The constructed UIH and its corresponding learned PIE's are used for estimating interest of a new document. However, current clustering methods do not generate clusters that possess all of the key characteristics we desire in a UIH.
Categories and Subject Descriptors H.3.3 [Information Storage and Retrieval]:Information Search and Retrieval – clustering, information filtering.
General Terms Algorithms.
Keywords user interest hierarchy, user profile, concept clustering, clustering algorithm.
1. INTRODUCTION When a user browses the web, at different times, she could be accessing pages pertaining to different topics. For example, she might be looking for research papers at one time and airfare information for conference travel at another. That is, a user can
Most search engines are not sensitive to a user's interest. An improved interface for the user would rank results according to the user's profile. A UIH represents the user's specific as well as general interests, which can help rank the results returned by a search engine. Pages that match the more specific interests will receive a higher score than those that only match the more general interests. Furthermore, the UIH provides a context to disambiguate words that could have multiple meanings in different contexts. For example, “java” is likely to mean the
Permission to make digital or hard copies of all or part of this work for personal or classroom use is granted without fee provided that copies are not made or distributed for profit or commercial advantage and that copies bear this notice and the full citation on the first page. To copy otherwise, or republish, to post on servers or to redistribute to lists, requires prior specific permission and/or a fee. IUI’03, January 12–15, 2003, Miami, Florida, USA. Copyright 2003 ACM 1-58113-586-6/03/0001…$5.00.
101
clustering of web pages [10]. Our algorithm only needs to cluster strongly connected words, but the K-means algorithm divides whole words into K clusters without removing weak relations. COBWEB is a incremental conceptual clustering algorithm. Each cluster records the probability of each attribute and value, and the probabilities are updated every time an object is added [4]. However, instead of using category utility to determine if child clusters are generated, we use a graph-based method and a different similarity function.
programming language, not the coffee, for a UIH that is learned from a user who has been reading computer science related pages. So this helps a user in searching relevant pages on the web. The most common and obvious solution for building a UIH is for the user to specify their interests explicitly. However, the explicit approach includes these disadvantages: •
Time and effort in specifying her interests.
•
User’s interest may change over time.
To build user interest profiles that can be used for web personalization, Richardson and Domingos [11] enhanced PageRank by using a more intelligent web-surfer. This method collects relevant web pages based only on queries, probabilistically combined page contents, and link structure. Research has also been performed on a method to group web pages into distinct topics and to list the most authoritative/informative web pages in each topic. The similarity metric that is used incorporates comprehensive information regarding text, hyperlink structure, co-citation, and the unsupervised clustering method based on spectral graph partitioning using normalized cut [7]. Our method is only concerned with the text but allows overlapping clusters. A news agent called News Dude, developed by Billsus and Pazzani [2], learns which stories in the news a user is interested in. The news agent uses a multi-strategy machine learning approach to create separate models of a user’s short-term and long-term interests. Unlike News Dude, in our approach we model a continuum of long-term to short-term interests. Syskill & Webert [9] use a predefined profile, which significantly increases the classification accuracy on previously unseen web pages. They emphasize the importance of a user profile. Perkowitz and Etzioni [10] introduced SCML, a concept learning algorithm that only extracts some concepts in a set of data.
Alternatively, an implicit approach can identify a user’s interests by inference. The leaf nodes of the UIH generated by our algorithm represent a list of specific (short-term) user interests. Internal nodes represent more general (longer-term) interests. The main objective of this research is to build UIH’s that capture general to specific interests without the user’s involvement (implicitly). We devise a divisive hierarchical clustering (DHC) algorithm that constructs such a hierarchy and supports overlapping clusters of the original objects (web pages in our case). Note that clustering web pages is not one of our objectives; the overlapping property allows us to associate a web page to (potentially) multiple topics. We believe our approach has significant benefits and possesses interesting challenges. The main contributions of this work are the characterization of a user interest hierarchy, an algorithm that constructs a UIH, similarity functions, dynamic threshold-finding methods, and evaluation of our techniques based on real data collected from our departmental web server. The rest of this paper is as follows: Section 2 discusses related work in clustering algorithms and building user interest profiles; Section 3 introduces user interest hierarchies (UIH’s); Section 4 details our approach towards building implicit UIH’s; Section 5 describes our experiments; Section 6 analyzes the results from the experiments; Section 7 summarizes our findings and suggests possible future work.
3. USER INTEREST HIERARCHY A user interest hierarchy (UIH) organizes a user’s general to specific interests. Towards the root of a UIH, more general (longer-term) interests are represented by larger clusters of words while towards the leaves, more specific (shorter-term) interests are represented by smaller clusters of words. To generate a UIH for a user, our clustering algorithm (details in Sec. 4) accepts a set of web pages visited by the user as input. We use only the words in a web page and ignore link or image information. The web pages are stemmed and filtered by ignoring the most common words listed in a stop list [5].
2. RELATED RESEARCH Agglomerative (bottom-up) hierarchical clustering algorithms initially put every object in its own cluster and then repeatedly merge similar clusters together, resulting in a tree shape structure that contains clustering information on many different levels [13]. Merges are usually binary—merging two entities, which could be clusters or initial data points. Hence, each parent is forced to have two children in the hierarchy. Divisive (top-down) hierarchical clustering algorithms are similar to agglomerative ones, except that initially all objects start in one cluster which is repeatedly split. Splits are usually binary and one usual stopping criterion is the desired number of clusters [4]. Our divisive algorithm does not necessarily generate binary splits and uses a minimum cluster size as one of the stopping criteria. Partitioning clustering algorithms such as the K-means algorithm initially create a partitioning of K clusters. Those initial K clusters are then iteratively refined to achieve the final clustering of K clusters. A major drawback of this approach is that the number of clusters must be specified beforehand as an input parameter, however Perkowitz developed a method to automatically determine the value of K. They ran the K-means algorithm multiple times, starting with a large value and gradually decreasing it. They were able to efficiently determine a good value for K during the
Table 1 has a sample data set. Numbers in the left represent individual web pages; content has words stemmed and filtered through stop list. These words in the web pages can be represented by a UIH as shown in Figure 1. Each cluster node can represent a conceptual relationship, for example ‘perceptron’ and ‘ann’ (in italic) can be categorized as belonging to neural network algorithms, whereas ‘id3’ and ‘c4.5’ (in bold) in another node cannot. Words in these two nodes are mutually related to some other words such as ‘machine’ and ‘learning’. This set of mutual words, ‘machine’ and ‘learning’, performs the role of connecting italic and bold words in sibling clusters and forms the parent cluster. We illustrate this notion in the dashed box in Figure 1.
102
threshold that decides whether two words are strongly related or not. If two words are determined to be strongly related, they will be in the same cluster; otherwise, they will be in different clusters. In the following subsections, we detail our algorithm, similarity functions, threshold-finding techniques, choice of window size, and minimum cluster size for leaves.
Table 1: Sample data set Page 1 2 3 4 5 6 7 8 9 10
Content ai machine learning ann perceptron ai machine learning ann perceptron ai machine learning decision tree id3 c4.5 ai machine learning decision tree id3 c4.5 ai machine learning decision tree hypothesis space ai machine learning decision tree hypothesis space ai searching algorithm bfs ai searching algorithm dfs ai searching algorithm constraint reasoning forward checking ai searching algorithm constraint reasoning forward checking
4.1 Algorithm Our algorithm is a divisive hierarchical clustering method called DHC, that recursively divides clusters into child clusters until it meets the stopping conditions. Figure 2 illustrates the pseudo code for the HDC algorithm. In preparation for our clustering algorithm, we extract words from web pages visited by the user, filter them through a stop list, and stem them [5]. Using a similarity function, we calculate the strength of the relationship between a pair of words. We then build a weighted undirected graph with each vertex representing a word and each weight denoting the similarity between two words. Since related words are more likely to appear in the same document than unrelated terms, we measure co-occurrence of words in a document. Given the graph, called SimilarityMatrix, the clustering algorithm recursively partitions the graph into subgraphs, called Cluster, each of which represents a sibling node in the resulting UIH.
ai, machine, learning, ann, perceptron, decision, tree, id3, c4.5, hypothesis, space, searching, algorithm, bfs, dfs, constraint, reasoning, forward, checking machine, learning, ann, perceptron, decision, tree, id3, c4.5, hypothesis
searching, algorithm, bfs, dfs, constraint, reasoning, forward, checking
ann, perceptron,
constraint, reasoning, forward, checking
decision, tree, id3, c4.5, hypothesis,
Documents that contain words in a cluster are in the cluster. Note that a document can have terms in different clusters, hence, a document can be in more than one cluster. At each partitioning step, edges with “weak” weights are removed and the resulting connected components constitute sibling clusters (we can also consider cliques as clusters, but more computation is required). We treat determining what value is considered to be “strong” or “weak” as another clustering problem (more details in Sec. 4.3). The recursive partitioning process stops when one of the stopping criteria is satisfied. The first criterion is when the current graph does not have any connected components after weak edges are removed. The second criterion is a new child cluster is not formed if the number of words in the cluster falls below a predetermined threshold.
Figure 1: Sample user interest hierarchy
4. APPROACH We desire to learn a hierarchy of topics of interests from web pages visited by a user to provide a context for personalization. The approach we take to generate the hierarchy is similar to clustering pages, but pages may belong to multiple clusters. To allow overlapping clusters of pages, instead of clustering pages directly, we cluster the words in pages and pages can be associated with clusters subsequently. That is, instead of directly clustering the original objects (web pages), we first cluster the features (words) of the objects and then the objects are assigned to the clusters based on the features in each cluster. During clustering, the similarity/distance between features are based on their relationship with the objects. Consequently, objects are clustered based on possessing similar related features and each object may belong to multiple clusters. Since the more challenging step is the initial hierarchical clustering of the features, our primary focus for this paper is on devising and evaluating algorithms for this step.
UIH (Examples, SIMILARITYFUNCTION, FINDTHRESHOLD, WindowSize) Examples: A set of web pages visited by the user. SIMILARITYFUNCTION: A function that calculates the "closeness" of two words. FINDTHRESHOLD: A function that calculates the cutoff value for determining strong and weak similarity values. WindowSize: the maximum distance (in number of words) between two related words in calculating their similarity value. 1. Words are extracted from Examples, stemmed, and filtered through a stop list. 2. Cluster ← distinct words [with information of web page membership] 3. Return DHC(Cluster, SIMILARITYFUNCTION, FINDTHRESHOLD, WindowSize)
Our divisive hierarchical clustering (DHC) algorithm recursively partitions the words into smaller clusters, which represent more related words. We assume words occurring close to each other (within a window size) are related to each other. We investigated a few similarity functions that measure how close two words are related. We also investigated techniques that dynamically locate a
103
AEMI ( A, B) = P(a, b) log
DHC (Cluster, SIMILARITYFUNCTION, FINDTHRESHOLD, WindowSize) 1. SimilarityMatrix ← CalculateSimilarityMatrix (SIMILARITYFUNCTION, Cluster, WindowSize) 2. Threshold ← CalculateThreshold(FINDTHRESHOLD, SimilarityMatrix) 3. If all similarity values are the same or a threshold is not found Return EmptyHierarchy 4. Remove weights that are less than Threshold from SimilarityMatrix 5. While (ChildCluster←NextConnectedComponent (SimiarityMatrix)) If size of ChildCluster >= MinClusterSize ClusterHierarchy←ClusterHierarchy + ChildCluster + DHC(ChildCluster, SIMILARITYFUNCTION, FINDTHRESHOLD, WindowSize) 6. Return ClusterHierarchy
P ( a, b) P( A, B) − P( A, B) log ∑ P(a ) P(b) ( A= a , B =b )( A= a , B =b ) P( A) P( B)
The first term computes supporting evidence that a and b are related and the second term calculates counter-evidence. Using our running example in Figure 1, Table 2 shows a few examples of ‘space’ how AEMI is computed. The AEMI value between ‘searching’ and ‘algorithm’ is 0.36, which is higher than the AEMI value between and ‘constraint’, –0.09.
Table 2: AEMI values
Figure 2: DHC algorithm The CalculateSimilarityMatrix function takes a similarity function (details in Sec. 4.2), cluster, and window size as parameters and return the similarity matrix, where the window size affects how far two words (in terms of number of words) can be to be considered as related. The CalculateThreshold function takes a threshold-finding method and similarity matrix as parameters and returns the threshold. The similarity function and thresholdfinding method greatly influence the clustering algorithm and are discussed next.
P(a)
P (a )
0.4
0.6
0.2
0.8
0.2
0.8
P (b ) P (b ) P(ab) P(ab) P(ab ) AEMI(a,b) a = searching, b = algorithm 0.4 0.6 0.4 0 0 0.36 a = space, b = constraint 0.2 0.8 0 0.2 0.6 -0.09 a = ann, b = perceptron 0.2 0.8 0.2 0 0 0.32
4.2.2 AEMI-SP Inspired by work in the information retrieval community, we would like to enhance AEMI by incorporating a component for inverse document frequency (IDF) in the similarity function. The document frequency of a word calculates the number of documents that contain the word. Words that are commonly used in many documents are usually not informative in characterizing the content of the documents. Hence, the inverse document frequency (the reciprocal of document frequency) measures how informative a word is in characterizing the content. Since our formulation is more sophisticated than IDF and it involves a pair of words rather than one word in IDF, we use a different name and call our function specificity (SP).
4.2 Similarity Functions The similarity function calculates how strongly two words are related. Since related words are more likely to be close to each other than unrelated words, we assume two words co-occurring within a window size are related. To simplify our discussion, we have been assuming the window size to be the entire length of a document (details in Sec. 4.4). That is, two words co-occur if they are in the same document.
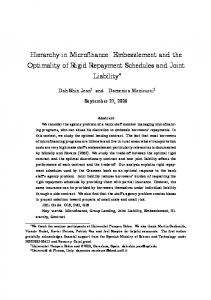
We estimate the probability of word occurrence in documents instead of just document frequency so that we can scale the quantity between 0 and 1. We desire to give high SP values to words with probability below 0.3 (approximately), gradually decreasing values from 0.3 to 0.7, and low values above 0.7. This behavior can be approximated by a sigmoid function, commonly used as a smoother threshold function in neural networks, though ours needs to be smoother. Figure 3 shows the shape of the SP function with respect to m, where m is defined as: MAX (P(a), P(b)). We choose the larger probability so that SP is more conservative. SP(m) is defined as:
4.2.1 AEMI We use AEMI (Augmented Expected Mutual Information) [3] as a similarity function. AEMI is enhanced version of MI (Mutual Information) and EMI (Expected Mutual Information). Unlike MI which considers only one corner of the confusion matrix and EMI which sums the MI of all four corners of the confusion matrix, AEMI sums supporting evidence and subtracts counter-evidence. Chan [3] demonstrates that AEMI could find more meaningful multi-word phrases than MI or EMI. Concretely, consider A and B in AEMI(A,B) are the events for the two words. P ( A = a ) is the probability of a document containing a and P ( A = a ) is the probability of a document not having term a. P ( B = b ) and P ( B = b ) are defined likewise. P ( A = a , B = b ) is the probability of a document containing both terms a and b. These probabilities are estimated from the documents visited by the user. AEMI(A,B) is defined as:
1/(1 + exp(0.6 × (m × 10.5 – 5))), where the factor 0.6 smoothes the curve, and constants 10.5 and – 5 shift the range of m from between 0 and 1 to between -5 and 5.5. The new range of -5 and 5.5 is slightly asymmetrical because we would like to give a small bias to more specific words. For instance, for a = ‘ann’ and b = ‘perceptron’, m is 0.2 and SP(m) is 0.85, but for a=‘machin’ and b=‘ann’, m is 0.6 and SP(m) is 0.31.
104
relationship. Since Jaccard, MIN, and MAX did not generate desirable cluster hierarchies, we excluded them from further experiments.
1
SP(m)
0.8 0.6
4.3 Threshold-finding Methods
0.4
Instead of using a fixed user-provided threshold (as in STC [15]) to differentiate strong from weak similarity values between a pair of words, we examine methods that dynamically determine a reasonable threshold value. Weights with weak similarity are removed from SimilarityMatrix and child clusters are identified (Sec. 3).
0.2 0
0
0.5
1
m
Figure 3: SP Function Our similarity function AEMI-SP is defined as: AEMI × SP/2. The usual range for AEMI is 0.1 – 0.45 and SP is 0 – 1. To scale SP to a similar range as AEMI, we divide SP by 2. For example in Table 3 the AEMI-SP value for ‘searching’ and ‘algorithm’ is lower than the value for ‘ann'’ and ‘perceptron’ because the SP value for ‘ann’ and ‘percetpron’ is higher even though the AEMI value is lower.
4.3.1 Valley To determine the threshold, we would like to find a sparse region that does not have a lot of similar values. That is, the frequency of weights in that region is low. We first determine the highest observed and lowest desirable similarity values and quantize the interval into ten regions of equal width. The lowest desirable similarity value is defined as the value achieved by a pair of words that occur together only in one document. We then determine the frequency of values in each region. Generally, lower weights have a higher frequency and higher weights have a lower frequency. If the frequency monotonically decreases with regions of higher weights, picking the region with the lowest frequency will always be the region with the highest weights. Unfortunately, the threshold will be too high and too many edges will be cut. In this case the threshold is set to be the average plus one standard deviation (biasing to removing more edges with lower weights).
Table 3: AEMI-SP values AEMI
SP
AEMI-SP
a = searching b = algorithm
0.36
0.62
0.113
a = ann b = perceptron
0.32
0.85
0.137
4.2.3 Other Similarity Functions
However, if the frequency does not decrease monotonically, we attempt to identify the “widest and steepest” valley. Steepness can be measured by the slopes of the two sides of a valley and the width of how many regions the valley covers. Since the regions are of equal width, we calculate the “quality” of a valley by: , where i and j are successive regions on freq − freq
We also investigated other existing similarity functions. The Jaccard function [6] is defined as: P ( a , b ) . When a word P (a ∪ b)
describes a more general topic, we expect it to occur quite often and appear with different more specific words. In a sense a general word “connects” more specific but related words. Hence, we desire general (“connecting”) words to exist only at higher levels in the UIH. For example, ‘ai’ is general and preferably should not appear at the lower levels. Using our running example in Figure 1, the Jaccard value between ‘ai’ and ‘machine’ is 0.6 and the value between ‘ai’ and ‘search’ is 0.5. If the threshold is 0.49, both pairs are in the same cluster and ‘ai’ may perform the role to connect ‘machine’ and ‘search’. Even though if the threshold is 0.55, ‘ai’ still remains in the child cluster with ‘machine’ (since their similarity value is over the threshold), which is a wrong decision. which made it hard to make child clusters, which means it is not proper for making hierarchical clusters.
∑
i, j
i
j
the two sides of a valley. Once the widest and steepest valley is located, we identify the threshold in the region that constitutes the bottom (lowest frequency) of the valley.
Table 4: Distribution of frequency and number of children Region 0 1 2 3 4 5 6 7 8 9
The MIN method is defined as MIN(P(a|b), P(b|a)). The idea is that if we assign the same similarity value to connected words and connecting words, they would go together. For instance in Figure 1, ‘ai’ connects ‘machine’ and ‘searching’, so they were grouped together in one cluster. However, when they were divided into child clusters, ‘ai’ should be removed because ‘ai’ is too general. But MIN (P(‘ai’|’machine’), P(‘machine’|’ai’)) still yielded relatively higher value than the average. Alternatively, the MAX function defined as MAX (P(a|b), P(b|a)) did not distinguish the value for ‘ai’ and ‘machine’ and the value for ‘machine’ and ‘learning’, even though the latter pair has a much stronger
Range 0.27