Learning Node Replacement Graph Grammars in Metabolic Pathways Jacek P. Kukluk Dept. of Computer Science and Engineering University of Texas at Arlington
[email protected]
Chang Hun You, Lawrence B. Holder, and Diane J. Cook School of Electrical Engineering and Computer Science Washington State University
[email protected],
[email protected],
[email protected]
Abstract— This paper describes graph-based relational, unsupervised learning algorithm to infer node replacement graph grammar and its application to metabolic pathways. We search for frequent subgraphs and then check for overlap among the instances of the subgraphs in the input graph. If subgraphs overlap by one node, we propose a node replacement graph grammar production. We also can infer a hierarchy of productions by compressing portions of a graph described by a production and then inferring new productions on the compressed graph. We show learning curves and how the learning process changes when we increase the size of a sample set. We examine how computation time changes with an increased number of nodes in the input graphs. We inferred graph grammars from metabolic pathways which do not change more with increased number of graphs in the input set. It indicates that graph grammars found represent the input sets well. Keywords: Biological Data Mining, Graph Grammars, Metabolic Pathways
1. Introduction A biological network, containing various biomolecules and their relationships, is a fundamental way to describe bio-systems. Multi-relational data mining finds the relational patterns in both the entity attributes and relations in the data. A graph consisting of vertices and edges between these vertices is a natural data structure to represent biological networks. This paper describes graph-based relational, unsupervised, learning algorithm to infer node replacement graph grammar and its application to metabolic pathways. Genomics and proteomics, main areas in molecular-level research, have studied the function and structure of macro molecules in organisms, and produced a huge amount of results. However, proteins and genes can play their roles only in harmony with the whole cytoplasmic environment. Molecular-level understanding is definitely a fundamental step, but it is not the final step. A biological organism is a system which is not just composed of various objects, but also has dynamic and interactive relationships between them and therefore a systems-level understanding is
important. Relationships in biological networks include chemical reactions, enzyme activities and signal transductions. The patterns of these relationships can be studied with graph grammars and provide better understanding of biological networks and systems. Noam Chomsky [1] pointed out that one of the main concerns of a linguist is to discover simple grammars for natural languages and study those grammars with the hope of finding a general theory of linguistic structure. While string grammars represent language, we are looking for graph grammars that represent graph properties and can generalize these properties from finite graph examples into generators that can generate an infinite number of graphs. String grammars can be inferred from a finite number of sentences and generalize to an infinite number of sentences. Inferring graph grammars will generalize the knowledge from the examples into a concise form and generalize to an infinite number of entities from the domain. A graph grammar can be the most important feature to distinguish a biological network from another or can be the common property to group of several biological networks. Graph grammar can be used as a rule to construct a new biological network. We study the inference of node replacement graph grammars. We search for frequent subgraphs and then check for overlap among the instances of the subgraphs in the input graph. If subgraphs overlap by one node, we propose a node replacement graph grammar production. We also can infer a hierarchy of productions by compressing portions of a graph described by a production and then inferring new productions on the compressed graph. We validate the approach in experiments. We show the graph grammars found in metabolic pathways and analyze learning curves of the algorithm
2. Metabolic Pathways A cellular system is represented by three kinds of biological networks, such as metabolic pathway, protein-protein interaction and gene regulatory pathway [10]. Our research is currently focused on the metabolic pathways. The metabolic pathway is defined as a network of biochemical reactions catalyzed by enzymes. Biochemical
reaction is a process of interconversion between two biochemical compounds (substrate and product) catalyzed by an enzyme. The metabolic pathway is a complex network of various biochemical processes and their relationships. A fundamental step to study metabolic pathways is the identification of structures covering a variety of biomolecules and their relationships. Dynamics and control methods of metabolic pathways should be also considered, because biological systems are interactive and well-controlled optimized systems. However, our current research is focused on identifying the structure. Our ultimate goal is to make a blueprint for systems-level understanding and its application based on an understanding of the structure, dynamics and control of a biological network. The KEGG PATHWAY is a widely known database which contains information on various kinds of pathways including pathway image files [7]. The KEGG PATHWAY database has 47,141 pathways generated from 314 reference pathways (on February, 2007). The KEGG PATHWAY has two types of pathways: reference pathway and organism-specific pathway. The reference pathway is a standard pathway which is manually generated by biologists and biochemists based on accumulated experimental results. The organism-specific pathway is automatically generated based on organism-specific genes and reference pathways. It has five fundamental categories of pathways: Metabolism, genetic information processing, environmental information processing, cellular processes and human diseases. Recently, drug development has been added as a new category. This database contains not only various information on pathways, but also plentiful information of their components as linked databases. It also has the KGML (KEGG Markup Language) as an exchange format for KEGG metabolic pathways, based on XML. There are three major elements in KGML: Entry, Relation and Reaction Entry represents various biomolecules in the metabolic pathway, such as enzyme, gene and compound. Relation is a relationship between two or more enzymes, genes and other pathways. Reaction is a biochemical reaction between two or more compounds catalyzed by one or more enzymes. Detailed information on KGML is described in [8].
3. Related Work There are several graph-based data mining approaches applied to biological networks. Pathway Miner [9], a graph-mining approach on metabolic pathways, proposes a simplified graph representation consisting of enzyme relationships. It allows for avoiding the NP-hard subgraph isomorphism problem and finding frequent patterns quickly. Mining coherent dense subgraphs uses correlation of graphs, which represent biological networks [4]. This approach compresses a group of graphs into two meta-graphs using correlated occurrences of edges for efficiently clustering. This method also deals with the interaction between proteins and gene products from microarray analysis. Probabilistic
framework [12] builds a Markov model using a graph of metabolic pathway with microarray data, and estimates parameters by EM algorithm. This approach finds the biologically significant paths and patterns from glycolysis pathway. A vast amount of research has been done in inferring grammars. These analyses focus on string grammars where symbols appear in a sequence. We are concerned with graph grammars, which can represent much larger classes of problems than string grammars. Only a few studies can be found in graph grammar inference. Jeltsch and Kreowski [5] did a theoretical study of inferring hyperedge replacement graph grammars from simple undirected, unlabeled graphs. They start the process from a grammar which has all the sample graphs in its productions. Then they transform the initial productions into productions that are more general but can still produce every graph from the sample graphs. Oates, Doshi, and Huang [14] discuss the problem of inferring probabilities of every grammar rule for stochastic hyperedge replacement context free graph grammars. They assume that the grammar is given. Given a structure of a grammar S and a finite set of graphs E generated by grammar S, they ask what are the probabilities θ associated with every rule of the grammar. In terms of similarity to string grammar inference we consider the Sequitur system developed by Nevill-Manning and Witten [13]. Sequitur infers a hierarchical structure by replacing substrings based on grammar rules. The new, compressed string is searched for substrings which can be described by the grammar rules, and they are then compressed with the grammar and the process continues iteratively. Similarly, in our approach we replace the part of a graph described by the inferred graph grammar with a single node and we look for grammar rules on the compressed graph and repeat this process iteratively until the graph is fully compressed. Jonyer et al.’s approach to node-replacement graph grammar inference [6] starts by finding frequently occurring subgraphs in the input graphs. They check if isomorphic instances of the subgraphs that minimize the measure are connected by one edge. If they are, a production S→ PS is proposed, where P is the frequent subgraph. P and S are connected by one edge. Jonyer’s method of testing if subgraphs are adjacent by one edge limits his grammars to descriptions of “chains” of isomorphic subgraphs connected by one edge. Since an edge of a frequent subgraph connecting it to the other isomorphic subgraph can be included to the subgraph structure, testing subgraphs for overlap allows us to propose a class of grammars that have more expressive power than the graph structures covered by Jonyer’s grammars. For example, testing for overlap allows us to propose grammars which can describe tree structures, while Jonyer’s approach does not allow for tree grammars.
4. Definitions We give the definition of a graph and a graph grammar which is relevant to our approach and the implemented system. The defined graph has labels on vertices and edges. Every edge of the graph can be directed or undirected. The definition of a graph grammar describes the class of grammars that can be inferred by our approach. We emphasize the role of recursive productions in the name of the grammar, because the type of inferred productions are such that the non-terminal label on the left side of the production appears one or more times in the node labels of a graph on the right side. This is the main characteristic of our grammar productions. Our approach can also infer non-recursive productions. The embedding mechanism of the grammar consists of connection instructions. Every connection instruction is a pair of vertices that indicate where the production graph can connect to itself in a recursive fashion. A labeled graph G is a 6-tuple, G = (V , E , μ ,ν , η , L ) , where V - is the set of nodes, E ⊆ V × V - is the set of edges, μ : V → L - is a function assigning labels to the nodes, v : E → L - is a function assigning labels to the edges, η : E → { 0, 1} - is a function assigning direction property to edges (0 if undirected, 1 if directed). L - is a set of labels on nodes and edges. A node replacement recursive graph grammar is a tuple
Gr = (∑, Δ, Γ, P ) , where
∑ - is an alphabet of node labels, Δ - is an alphabet of terminal node labels, Δ ⊆ ∑ , Γ - is an alphabet of edge labels, which are all terminals, P - is a finite set of productions of the form (d , G , C ) ,
where d ∈ ∑ − Δ , G is a graph, C is an embedding mechanism with a set of connection instructions, C ⊆ V × V , where V is the set of nodes of G . A connection instruction (vi , v j ) ∈ C implies that derivation can take place by replacing vi in one instance of G with v j in another instance of G . All the edges incident to vi are incident to v j . All the edges incident to v j remain unchanged.
A substructure S of a graph G is a data structure which consists of: (1) graph definition of a substructure SG which is a graph isomorphic to a subgraph of G, (2) list of instances (I1, I2, …, In) where every instance is a subgraph of G isomorphic to SG. A recursive substructure recursiveSub is a data structure which consists of:
(1) graph definition of a substructure SG which is a graph isomorphic to a subgraph of G (2) list of connection instructions which are pairs of integer numbers describing how instances of the substructure can overlap to comprise one instance of the corresponding grammar production rule. (3) List of recursive instances (IR1, IR2, …, IRn) where every instance IRk is a subgraph of G. Every instance IRk consist of one or more isomorphic copies of SG, overlapping by no more than one vertex in the algorithm for node graph grammar inference and no more than two vertices in edge grammar inference. . In our definition of a substructure we refer to subgraph isomorphism. However, in our algorithm we are not solving the subgraph isomorphism problem. We are using a polynomial time beam search to discover substructures and graph isomorphism to collect instances of the substructures.
5. Graph Grammar Inference Algorithm An example in Figure 1 shows a graph composed of three overlapping substructures. The algorithm generates candidate substructures and evaluates them using any one of the learning biases, which are discussed later. The input to our algorithm is a labeled graph G which can be one connected graph or set of graphs. G can have directed or undirected edges. The algorithm begins by creating a list of substructures where every substructure is a single node and its instances are all nodes in the graph with the same node label. Initially, the best substructure is the node with the most instances. The substructures are ranked and placed on the expansion queue Q. It then extends all substructures in Q in all possible ways by a single edge and a node or only by single edge if both nodes are already in the graph definition of the substructure. We keep all extended substructures in newQ. We evaluate substructures in newQ according to the chosen evaluation heuristic. The total number of substructures considered is determined by the input parameter Limit. The best substructure identified becomes the right side of the first grammar production, and the graph G is compressed using this best substructure. Compression replaces every instance of best substructure with a single non-terminal node. This node is labeled with a non-terminal label. The compressed graph is further processed until it cannot be compressed any more, or some user-defined stopping condition is reached (maximum number of productions, for instance). In consecutive iterations the best substructure can have one or more non-terminal labels. It allows us to create a hierarchy of grammar productions. The input parameter Beam specifies the width of the beam search, that is, the length of Q.
Figure 1: A graph with overlapping substructures and a graph grammar representation of it. Recursive productions are identified during the previously described search process by allowing instances to grow and overlap. Any two instances are allowed to overlap by only one vertex. The recursive substructure is evaluated along with non-recursive substructures and is competing with non-recursive substructures for placement on Q. Connection instructions are created by determining which nodes overlapped across instances. Figure 2 shows an example of a substructure that is the right side of a recursive rule, along with its connection instructions [11].
Figure 2: Substructure and its instances while determining connection instructions (continuation of the example from Figure 1). One advantage of our algorithm is its modular design in which the evaluation of candidate grammar rules is done separately from the generation of these candidates. The result is that any evaluation metric can be used to drive the search. Different evaluation metrics are part of the system and can be specified as arguments. We have had great success with the minimum description length (MDL) principle on a wide range of domains. MDL is an information theoretic approach [15]. The description length of the substructure S given the input graph G is calculated as DL(S,G) =DL(S)+DL(G|S), where DL(S) is the description length of the subgraph, and DL(G|S) is the description length of the input graph compressed by the subgraph [2][3]. An alternative measure is the size heuristic which is computed as
size (G ) size (S ) + size (G | S )
where G is the input graph, S is a substructure and G|S is the graph derived from G by compressing each instance of S into a single node. size(t) can be computed simply by summing the number of nodes and edges: size(t) = vertices(t) + edges(t). The third measure is called setcover, which is used for concept learning tasks using sets of disconnected graphs. This measure maximizes the number of positive examples in which the grammar production is found while minimizing the number of such negative examples.
6. Experiments We perform experiments in two different categories: 1) Different biological networks within species, In this category we want to find common patterns for an organism, for instance Salmonella, across different metabolic pathways of this organism. The patterns will show the structure that is repeated in many metabolic pathways of the organism. We can use the inferred grammar understand the building blocks of pathways and to compare one organism to another. 2) Different species for a particular biological network. In this category we want to find common patterns for a specific process, for instance glycolysis, across different organisms. The patterns will show the structure that is repeated in this process across many organisms. We can use the inferred grammar to understand the building blocks of processes and to compare one process to another. We group the graphs into sets which allow us to search for common recursive patterns which can help to understand basic building blocks and hierarchical organization of processes. We analyze the results to evaluate the effectiveness of the algorithms in this domain.
6.1 The Graph Representation Our graph representation has three generic vertices, such as Entry, Relation and Reaction, because we would like to show the systematic view, like a Relation between two Entries (gene or protein), or a Reaction between two Entries (compound) catalyzed by a Entry (enzyme). The graph representation in Figure 3 has five entries which represent enzymes or chemical compounds. Each generic vertex has its own satellite vertices to describe its properties The biological networks used in our experiments were from KEGG. We use a graph representation which has labels on vertices and edges. The label entry represents a molecule, a molecule group or a pathway. A node labeled entry can be connected to a node labeled type. The type can be a value of the set: enzyme, ortholog, gene, group, compound, or map. A reaction is a process where a material is changed to another material catalyzed by an enzyme. A reaction, for example, can have one or more enzyme entries, and one or more compounds. Labels on edges show relationships between
entities. The meanings are: Rct_to_P : reaction to Product , S_to_Rct : substrate to reaction, E_to_Rct : enzyme (gene) to reaction, E_to_Rel : enzyme to relation, Rel_to_E : relation to enzyme. Nodes labeled ECrel indicate an enzyme-enzyme relation meaning that two enzymes catalyze successive reactions.
Figure 3: The graph representation of a metabolic pathway.
sets of different sizes to the original, true, ideal grammar which represents the species. However, such a graph grammar is not known. In the first experiment we adopted as an original grammar the grammar inferred from the last set. From each set we infer four grammar productions which score the highest in the evaluation. We compute the error (distance) of an inferred grammar to the grammar inferred from the set with all networks. The error is the minimal number of edges, vertices, and labels required to be change or removed to transform the structure of graph productions from one grammar to the other. In figures we refer to it as #transformations. In Figure 4 we show the results of the experiment. Every value in the figure is an average from three runs. In every run we randomly shuffle the networks over 11 sets such that sets are different in every run. The very bottom curve in Figure 4 is the average over 11 table entries. Data in Figure 6 is organized in the same way. In Figure 5 we show the graph grammar inferred from a set of thirty and a set of one hundred and ten graphs of Picrophilus torridus (pto).
6.2 Error
16.0
2
1
2
minimal number of operations required to transform g1 to a graph isomorphic to g 2 , or g 2 to a graph isomorphic to g1 . The operations are: insertion of an edge or node, deletion of a node or an edge, or substitution of a node or edge label.
Sets
of
bsu
10.0
dme
8.0
sty
6.0
xcc
4.0
pto
0.0 1
2
3
4
5
6
7
8
9
10
11
set number
25.0
Different
We use ten species in our experiments. The abbreviated names of the species and their meanings are: bsu - Bacillus subtilis, , sty - Salmonella enterica serovar, xcc - Xanthomonas campestris pv. campestris, pto - Picrophilus torridus, mka - Methanopyrus kandleri, pho - Pyrococcus horikoshii, sfx - Shigella flexneri, efa - Enterococcus faecalis, bar - Bacillus anthracis The species we selected randomly from the database. The number of networks is different for each species. We wanted to see how our algorithm performs when we increase sample size of graphs supplied to our inference algorithm. For this purpose we divided all the networks into 11 sets such that the last set (11th) has all the species. Set 10 excludes the 11th portion of all networks. Set 9 excludes 2/11 of all networks and set 1 has 1/11 of all networks. If all networks in the species do not divide by 11 evenly we distribute the remaining networks randomly to the 11 sets. We would like to compare our inferred grammar from
12.0
2.0
#transformations
6.3 Experiments with Biological Networks
14.0
20.0 mka pho
15.0
stx 10.0
efa bar
5.0 0.0 1
2
3
4
5
6
7
8
9
10
11
set number
#transformations
1
#transformations
We use matchCost( g , g ) as a measure of inference error (distance) between two grammars. matchCost( g , g ) is the
12.0 10.0 8.0 6.0 4.0 2.0 0.0
Average
1
2
3
4
5
6
7
8
9
10
11
set num ber
Figure 4: Change in inferred grammar measured in reference to the biggest set in networks of ten species.
6.4 Experiments with Biological Networks from Different Species In this experiment we construct sets of species with the same biological network. We used ten metabolic pathways in
entry type
gene
compound S2
entry
#transformations
net10
50.00
net20
40.00
net30
30.00
net51
20.00
net61
10.00 0.00 10
30
40
50
60
70
80
90
100
110
10.00 8.00
net401 net602
6.00
net730 4.00
net830
2.00
net930
0.00 num ber of graphs in the set
9.00 8.00 7.00 6.00 5.00
Aver age
4.00 3.00 2.00 1.00 0.00 10
20
30
40
50
60
70
80
90
100
110
Figure 6: Change in inferred grammar measured in reference to the biggest set in ten networks. 25000 network 10
20000
network 20 network 30
15000
51 61
10000
401 602
5000
730 0
860 0
20000
40000
60000
80000
100000
(a) 100000
enzyme
network 10
10000
entry
type
compound
time [sec]
S3
type relation maplink Real_to_E subtype entry|S4 1 compound 1-1
network 20 network 30
1000
51 61
100
401
S4
(a)
930
number of vertices
compound
type
20
num ber of graphs in the set
E_to_Rct reaction Rct_to_P S_to_Rct entry entry type type
S1
60.00
#transformations
The first experiment in this section is analogous the first experiment of the previous section. In this experiment we examine the change in pathways. We created 11 sets. Set number 1 has ten networks, set 2 has twenty networks, and so on. We increase the number of networks in every set by ten such that the last set 11 has one hundred and ten networks. We measure the number of transformations required to transform the grammar inferred from the set to the grammar inferred from set 11. We show results in Figure 6. Every value in Figure 6 is an average from three runs. In every run we randomly shuffle the networks over 11 sets such that sets are different in every run. Figure 7 shows how computation time changes when we increase the size of the input set. We collect how many vertices has the graph created from all graphs in the input set and the time needed for graph grammar inference from the set. Figure 8 shows sample graph grammars inferred from the set with ten and seventy graphs of network 00010.
70.00
time [sec]
our experiments. The pathways’ numbers and their meanings are: 00010 Glycolysis / Gluconeogenesis, 00020 Citrate cycle (TCA cycle), 00030 Pentose phosphate pathway, 00051 Fructose and mannose metabolism, 00061 Fatty acid biosynthesis (path 1), 00401 Novobiocin biosynthesis, 00602 Blood group glycolipid biosynthesis-neolactoseries, 00730 Thiamine metabolism, 00830 Retinol metabolism, 00930 Caprolactam degradation
602
10
730 1 1000
(b)
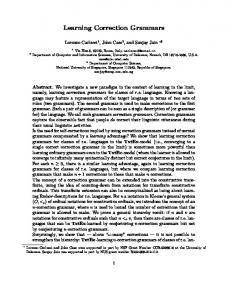
Figure 5: Graph grammar inferred from a set of thirty (a) and one hundred and ten (b) number of graphs in the input set of Picrophilus torridus (pto).
860 10000
100000
930
number of vertices
(b)
Figure 7: Time of grammar inference as a function of number of vertices in the graph in ten networks, linear scale (a) and logarithmic scale (b).
a)
b)
Figure 8: Graph grammar inferred from a set of ten (a) and seventy (b) number of graphs in the input set of network 00010.
7. Conclusion The experiments on the biological network domain give us insight into the performance of the algorithm and to the metabolic pathways. Examining Figure 4 we notice that some species, have a very regular set of metabolic pathways. Increasing the size of the set does not change the inferred grammar much. While in other species, like xcc, the set of metabolic pathways is very diverse resulting in significant changes on the curve. Several curves, pto, pho, efa, gradually decrease with the last values being zero. It shows us that our algorithm performed well and with increasing number of graphs in the input set we find the grammar which does not change more with increased number of graphs which indicates that grammar found represents the input set well. The very bottom chart in Figure 4 shows the average change. We see that with the increasing number of graphs in the input sets the curve declines to zero which tells us that with the increasing number of graphs we infer more accurate grammar. We find confirmation of these observations in experiments with sets of metabolic pathways of different species which describe the same process we show in Figure 6. The average change also declines to zero. We see fewer changes in curves in Figure 6 than in Figure 4. It tells us that there is less diversity in set of species within one network than there is in sets of networks within one species. In Figure 7 we show the computation time as a function of the number of vertices in the input set. We plotted two curves, one in linear, and one in logarithmic scale. The curves in linear scale become almost straight lines in logarithmic scale which confirms experimentally the polynomial complexity of the algorithm. Time curves of network 00010, 00030, and 00401 have a surprising dip towards the right end of the scale where we would expect an increase in computation time, but instead observe a decrease. We suspected that it is because in these cases the input set of graphs gets compressed very well in iteration one or two of
grammar inference and the compressed graph used in iterations three and four is small which results in faster execution time. However, a closer look at the number of vertices in each iteration did not confirm it. We tend towards relating the decreasing time phenomenon to the isomorphism test and the heuristic used in the algorithm. We can use inferred grammar productions not only to provide an abstraction of recognized metabolic pathway for better understanding but also to construct unknown metabolic pathway based on molecular-level experimental data. Future work will be in developing algorithms which allow for learning larger classes of graph grammars (context sensitive), including stochastic graph grammars and applications of these algorithms to biological structures.
8. References [1] N Chomsky,. Three models of language. IRE Transactions in Information Theory 2, 3, 113-24, 1956 [2] D. Cook and L. Holder, “Substructure Discovery Using Minimum Description Length and Background Knowledge.” Journal of Artificial Intelligence Research, Vol 1, (1994), 231-255, 1994 [3] D. Cook and L. Holder, “Graph-Based Data Mining.” IEEE Intelligent Systems, 15(2), pages 32-41, 2000. [4] H. Hu, X. Yan, Y. Huang, J. Han, and X. J. Zhou. Mining coherent dense subgraphs across massive biological networks for functional discovery. Bioinformatics, 21(1):213–221, 2005. [5] E. Jeltsch, H. Kreowski, “Grammatical Inference Based on Hyperedge Replacement. Graph-Grammars.” Lecture Notes in Computer Science 532, 1990: 461-474, 1990 [6] Jonyer. L. Holder, and. D. Cook, “MDL-Based Context-Free Graph Grammar Induction and Applications.” International Journal of Artificial Intelligence Tools, Volume 13, No. 1, 65-79, 2004. [7] M. Kanehisa, S. Goto, S. Kawashima, U. Okuno, and M. Hattori. KEGG resource for deciphering the genome. 32:277–280, 2004. [8] KEGG website. http://www.kegg.com. [9] M. Koyuturk, A. Grama, and W. Szpankowski. An efficient algorithm for detecting frequent subgraphs in biological networks. Bioinformatics, 20:200–207, 2004. [10] E. Klipp, R. Herwig, A. Kowald, C. Wierling, and H. Lehrach. Systems Biology. WILEY-VCH, first edition, 2005. [11] J. Kukluk, L. Holder, and D. Cook, Inference of Node Replacement Recursive Graph Grammars. Sixth SIAM International Conference on Data Mining, 2006 [12] H. Mamitsuka, Y. Okuno and A. Yamaguchi, Mining Biologically Active Patterns in Metabolic Pathways Using Microarray Expression Profiles, ACM SIGKDD Explorations Newsletter, Volume 5 , Issue 2, 113 - 121 [13] G. Nevill-Manning and H. Witten, “Identifying hierarchical structure in sequences: A linear-time algorithm.” Journal of Artificial Intelligence Research, Vol 7, (1997, 1997),67-82 [14] T. Oates, S. Doshi, and F. Huang, “Estimating maximum likelihood parameters for stochastic context-free graph grammars.” volume 2835 of Lecture Notes in Artificial Intelligence. Springer-Verlag, 2003, 281—298 [15] Rissanen, J. Stochastic Complexity in Statistical Inquiry. World Scientific Company. 1989