The Journal of Neuroscience, September 19, 2012 • 32(38):13273–13280 • 13273
Behavioral/Systems/Cognitive
Learning of New Sound Categories Shapes Neural Response Patterns in Human Auditory Cortex Anke Ley,1,2 Jean Vroomen,1 Lars Hausfeld,2 Giancarlo Valente,2 Peter De Weerd,2 and Elia Formisano2 1
Department of Medical Psychology and Neuropsychology, Faculty of Social and Behavioral Sciences, Tilburg University, 5037 AB Tilburg, The Netherlands, and 2Department of Cognitive Neuroscience, Faculty of Psychology and Neuroscience, Maastricht University, 6200 MD Maastricht, The Netherlands
The formation of new sound categories is fundamental to everyday goal-directed behavior. Categorization requires the abstraction of discrete classes from continuous physical features as required by context and task. Electrophysiology in animals has shown that learning to categorize novel sounds alters their spatiotemporal neural representation at the level of early auditory cortex. However, functional magnetic resonance imaging (fMRI) studies so far did not yield insight into the effects of category learning on sound representations in human auditory cortex. This may be due to the use of overlearned speech-like categories and fMRI subtraction paradigms, leading to insufficient sensitivity to distinguish the responses to learning-induced, novel sound categories. Here, we used fMRI pattern analysis to investigate changes in human auditory cortical response patterns induced by category learning. We created complex novel sound categories and analyzed distributed activation patterns during passive listening to a sound continuum before and after category learning. We show that only after training, sound categories could be successfully decoded from early auditory areas and that learning-induced pattern changes were specific to the category-distinctive sound feature (i.e., pitch). Notably, the similarity between fMRI response patterns for the sound continuum mirrored the sigmoid shape of the behavioral category identification function. Our results indicate that perceptual representations of novel sound categories emerge from neural changes at early levels of the human auditory processing hierarchy.
Introduction Categorical perception (CP) refers to the discrepancy between perceptual similarity and physical similarity of stimuli when they are grouped into distinct but meaningful classes (Harnad, 1987). Depending on situation and task, the relevant feature(s) defining the classes might differ. In the course of minimizing withincategory and maximizing between-category differences, continuous physical variations between stimuli are overruled such that seemingly dissimilar stimuli may be considered “same.” In audition, these perceptual transformations likely result in more abstract representations of sound similarity. Several attempts have been made to identify the neural source of these perceptual changes; however, to date, the effects of category learning on sound representations could not be resolved in humans. Previous fMRI studies have relied on subtraction paradigms lacking sufficient sensitivity to distinguish the responses to novel sound categories and allowing only indirect inferences about the underlying changes in representation (Desai et al., 2008; Leech et al., 2009; Liebenthal et al., 2010). Furthermore, the use of speech-
Received Feb. 7, 2012; revised July 13, 2012; accepted July 19, 2012. Author contributions: A.L., J.V., P.D.W., and E.F. designed research; A.L. performed research; L.H. and G.V. contributed unpublished reagents/analytic tools; A.L., L.H., and E.F. analyzed data; A.L. wrote the paper. This work was supported by Tilburg University and Maastricht University, The Netherlands. We thank F. Duecker for valuable discussions. Correspondence should be addressed to Anke Ley, Department of Cognitive Neuroscience, Faculty of Psychology and Neuroscience, Maastricht University, P.O. Box 616, 6200 MD Maastricht, The Netherlands. E-mail:
[email protected]. DOI:10.1523/JNEUROSCI.0584-12.2012 Copyright © 2012 the authors 0270-6474/12/3213273-08$15.00/0
like sounds might obstruct the emergence of novel learninginduced category representations due to interference with existing phoneme representations. In the visual domain, category learning is traditionally assumed to involve at least two different encoding stages: Whereas areas in the inferior temporal cortex are engaged in stimulus specific processes such as feature extraction, activation in the prefrontal cortex (PFC) codes more abstract, categorical information (Freedman et al., 2001, 2003; Seger and Miller, 2010). In contrast, animal electrophysiology in the auditory domain suggests that categorical sound information is encoded in spatiotemporal variations of neural firing already in early auditory cortex (Ohl et al., 2001; Selezneva et al., 2006). These changes in firing patterns might not necessarily lead to increases in overall activation level (Ohl et al., 2001; Schnupp et al., 2006). It has been proposed that multivoxel pattern analysis (MVPA) is sensitive to changes in distributed activation patterns in absence of changes in overall activation level (Haxby et al., 2001). This method has been successfully used to reveal subtle differences in overlapping sound representations (Formisano et al., 2008; Staeren et al., 2009) and purely perceptual processes in the visual (Li et al., 2007, 2009) and auditory (Kilian-Hu¨tten et al., 2011) domain. Here, we used fMRI and MVPA techniques in combination with a recursive feature elimination (RFE) procedure (De Martino et al., 2008) to reveal changes in sound representations in human auditory cortex induced by the formation of new sound categories. Our sound categories comprised complex moving ripples (Kowalski et al., 1996a,b) that share important spectrotemporal properties with natural sounds but cannot be associated
13274 • J. Neurosci., September 19, 2012 • 32(38):13273–13280
Ley et al. • Neural Representations of Learned Sound Categories
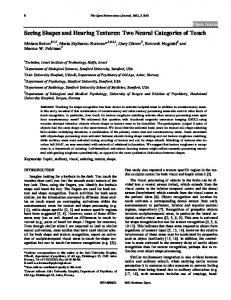
Figure 1. Sound spectrograms and stimulus space. A, Three example spectrograms of moving ripples with low (bottom), medium (middle), and high (top) velocities at constant pitch and density values. B, Multidimensional stimulus space spanning the two categories A and B. The third dimension (density) is only partially indicated for clarity reasons. Similar to previous studies (Smits et al., 2006), pitch categories were defined by two non-overlapping one-dimensional Gaussian probability density functions (pdfs) on a logarithmic frequency scale. The distance between category means (A and B) was determined by individual psychometric measures (see Materials and Methods, Stimulus calibration) to match task difficulty. The category boundary was fixed at 200 Hz ( f0); SDs () were set to one JND. During training, pdfs were linearly sampled resulting in two distinct pitch clusters containing six different values each (gray circles). In line with former behavioral studies on category learning (Smits et al., 2006; Goudbeek et al., 2009), six novel equidistant pitch values lying on a psychophysical continuum between category means were used for scanning and to assess categorization performance outside the scanner (green crosses). Each pitch exemplar was presented with six different velocity and two different density values.
with any preexisting category. Using novel auditory categories, we avoided any confounding effects related to prior experience. We trained subjects to categorize the sounds into two distinct classes and measured fMRI responses to new sounds from the same categories before and after successful category learning during passive listening. We then aimed to decode the novel perceptual sound categories from the auditory response patterns in the absence of an active categorization task.
Materials and Methods Participants. Eight volunteers (three males; mean age, 23.38 years) participated in the study after providing informed consent. Participants reported normal hearing abilities and were naive to sounds and research question. The study procedures were approved by the local ethics committee (Ethische Commissie Psychologie at Maastricht University). Stimuli. Ripple stimuli (Fig. 1 A) have successfully been used in the past for characterizing spectrotemporal response fields in animals and humans (Kowalski et al., 1996a,b; Shamma, 1996; Depireux et al., 2001; Langers et al., 2003). Here, ripples were composed of 50 sinusoids with logarithmically spaced frequencies spanning four octaves. The lowest frequency component ( f0) of the complex was shifted between on average 168 –236 Hz to modulate ripple pitch. To create different ripple densities, their spectral envelope was modulated sinusoidally along the frequency axis on a linear amplitude scale by 0.25 and 0.125 cycles/ octave. Additionally, a constant envelope drift along the frequency axis was introduced by shifting the phase of the sinusoid over time. The angular velocity of this drift was varied in equal steps between 1 and 6 cycles/s. Drift direction was upward with an initial phase of 0. The stimuli were of 1 s duration and their energy was matched by adjusting their root mean square values. Linear amplitude ramps of 5 ms duration were added at ripple onsets and offsets. All stimuli were sampled at 44.1 kHz using 16-bit resolution and processed in Matlab (MathWorks). Stimulus calibration. As previous experiments have shown that intersubject differences in stimulus discrimination ability can be rather large (Guenther et al., 1999), participants underwent a short calibration procedure in which pitch and velocity discrimination sensitivity of the ripple sounds used for category learning were measured to match task difficulty. For this purpose, an adaptive up– down staircase procedure (AX same– different paradigm) was used. Following the procedure devised by Levitt (Wetherill and Levitt, 1965; Levitt, 1971), we estimated a just noticeable difference (JND) at a probability of 71% “different” responses at convergence based on 15 response reversals. Participants were exposed to
a sequence of three sounds, which consisted of two ripple sounds (A and X) separated by a noise burst. The participants were instructed to compare the two ripple sounds and ignore the noise burst, which could be considered a “masker” as it was introduced to interfere with the sensory trace of A and to promote the transformation of the feature-based representations into a categorical percept (Guenther et al., 1999). Importantly, the noise burst did not disrupt the perception of the preceding and following ripple sound. All sound features except the relevant one were kept constant during the calibration procedure. The pitch discrimination threshold measured around the category boundary served as a global estimate for the small range of frequencies used in the experiment. The average JND of ripple pitch [baseline value ( f0), 200 Hz] was 21.76 Hz (SEM, 3.51). The average JND for velocity (baseline value, 1 cycle/s) was 0.21 cycles/s (SEM, 0.04), which was well below the step size of 1 cycle/s used in the construction of the sound categories. We therefore assume that the velocity differences in the sounds are sufficiently salient. Category distributions. To partition a continuous stimulus space (Fig. 1 B) into different categories, we used a combination of several spectral and temporal features (pitch, velocity, and density). We used two distinct sets of sounds for category training and testing. Category training was restricted to one dimension (i.e., “low pitch” vs “high pitch”). The additional spectral and temporal variations were introduced to encourage the extraction of the category-distinctive sound feature under variable stimulus conditions and to promote the abstraction across task-irrelevant features. Categories were named A and B to avoid any explicit cues about the relevant sound feature. Instead, learning of the two pitch categories was encouraged by means of distributional information: For training, pitch values were sampled from two non-overlapping normal distributions with equal variance but different means defined on a logarithmic frequency scale (equivalent rectangular bandwidth) (Glasberg and Moore, 1990). Sampling was denser within categories than at the category border (Fig. 1 B, gray circles). In contrast to pitch, the irrelevant dimensions (velocity and density) were linearly sampled. For fMRI sessions and to assess categorization performance in behavioral sessions outside the scanner, we used new test sounds (Fig. 1 B, green crosses). Crucially, these test sounds were evenly sampled from a psychophysical continuum between category means and therefore conveyed no information about the category boundary in terms of acoustic similarity. Due to the lack of distributional information, the test stimulus space was defined by equal variance in the relevant (i.e., pitch) as well as one of the irrelevant (i.e., velocity) dimensions and therefore allowed two equally feasible category partitions (Fig. 1 B, trained and untrained category boundary).
Ley et al. • Neural Representations of Learned Sound Categories
J. Neurosci., September 19, 2012 • 32(38):13273–13280 • 13275
The division into two “untrained” velocity classes (“slow” vs “fast”) served as a control for the behavioral relevance of our results during the fMRI analysis (see below). Experimental procedure. To ensure compatibility of sound quality during behavioral training and scanning, stimulus calibration and category training were performed inside the scanner room with the same hardware and audio settings as used during fMR imaging. Participants were seated on the scanner bed in comfortable viewing distance from the screen. During behavioral sessions, training and test blocks were interleaved. The latter served to obtain consecutive measures of categorization performance and monitor the level of CP. For this purpose, we adapted a standard procedure from speech research (Liberman et al., 1957) in which subjects labeled the test sounds from the continuum without corrective feedback. Participants always started with a test block, in which they were instructed to group the 72 sounds into two discrete classes (A vs B) in a two-alternative forcedchoice procedure without instructions about the relevant stimulus dimension. The test block was followed by a training block comprising 144 sounds from the normal distributions. During training, visual feedback was provided after each response by means of a small red (incorrect) or green (correct) square appearing for 700 ms in the screen center. One training block lasted 12 min and allowed a short break after one-half of the trails. A test block lasted 6 min and was completed in one run. The number of repetitions and thereby the length of a behavioral training session was determined by the performance level (successful learning was determined by at least 85% correct in one of the test blocks) as well as the motivation and condition of the participant but never exceeded 1 h. We measured fMRI responses to the 72 test sounds before and after successful category learning during passive listening (see Imaging). The first scan session was followed by a variable number (3–7) of behavioral training blocks, spread over 2– 4 d so as to match subjects’ performance before the second scanning session. Curve fitting. We used a curve-fitting procedure (using Matlab’s “fit” function) to describe the learning-induced changes in sound labeling. Previous research (McMurray and Spivey, 2000) has shown that the s-shaped identification function in CP experiments resembles the logistic function, given by Equation 1 as follows:
y ⫽
a 1 ⫹ e
⫺ 共 x-d 兲 c
⫹ b.
(1)
Here, a provides a measure of the amplitude of the function, b corresponds to the y-axis location of the lower asymptote, c reflects the slope of the function, and d indicates the location of the category boundary on the x-axis. We fitted the logistic function to the individual category identification functions. The nonlinear least-squares parameter estimation was subject to the following constraints: 0 ⱕ a ⱕ 100; 0 ⱕ b ⱕ 100; 0.1 ⱕ c ⱕ 10; 1 ⱕ d ⱕ 6. The liberal parameter settings were chosen to achieve a good fit and thereby provide an accurate description of the shape of the curve and the underlying trend in the response data. Imaging. Brain imaging was performed with a 3 tesla Siemens Allegra MR head scanner at the Maastricht Brain Imaging Center. For each subject, there were two scanning sessions, one before and the other after category learning. In both of these sessions, three runs (each consisting of 364 volumes and including the 72 test sounds; total number of sounds: 72 ⫻ 3 ⫽ 216) of functional MRI data were acquired in 30 slices, covering the temporal and parts of the frontal lobe with an eight-channel head coil using a standard echo-planar imaging sequence in a slow event-related design with the following parameters: repetition time (TR), 3.5 s; acquisition time, 2.1 s; field of view, 224 ⫻ 224 mm; matrix size, 112 ⫻ 112; echo time, 30 ms; voxel dimensions, 2 ⫻ 2 ⫻ 2 mm. Additionally, anatomical T1-weighted images (voxel dimensions, 1 ⫻ 1 ⫻ 1 mm) were acquired with optimal gray–white matter contrast for cortex reconstruction purposes. The average intertrial interval between two stimuli was 17.5 s (jittered between 4, 5, and 6 TR). Sounds were delivered binaurally via MRIcompatible headphones (Visual Stim Digital, Resonance Technology; or Sensimetrics S14, Sensimetrics Corporation) in the 1.4 s silent gaps between volume acquisitions. Stimulus order was randomized using the randperm function implemented in Matlab; stimulus delivery was synchronized with MR pulses using Presentation software (Neurobehavioralsystems).
FMRI preprocessing and univariate analysis. MRI data were first analyzed with BrainVoyager QX (Brain Innovations). The first four volumes per run were discarded from the analysis to allow for T1 equilibrium. Functional data preprocessing included three-dimensional head motion correction, slice scan-time correction (using sinc interpolation), temporal high-pass filtering (three cycles), linear trend removal, coregistration to individual structural images, and normalization of anatomical and functional data to Talairach space. Individual cortical surfaces were reconstructed from gray–white matter segmentations and aligned using a moving target-group average approach based on curvature information (cortex-based alignment) (Goebel et al., 2006) to obtain an average 3D surface representation. For univariate statistical analysis of the functional data, a general linear model (GLM) was computed by fitting the blood oxygen level-dependent (BOLD) response time course with the predicted time series for the two pitch classes in the two sessions, pooling pitch levels 1–3 and 4 – 6, respectively, independent of velocity and density values. This trial division corresponded to the trained category boundary (Fig. 1 B). The hemodynamic response delay was corrected for by convolving the predicted time courses with a canonical (double gamma) hemodynamic response function. We performed both single-subject and group (fixed-effects) analyses of the contrast “high pitch” versus “low pitch” both for the prelearning and postlearning session. Thresholds for contrast maps were corrected for multiple comparisons based on false discovery rate (q ⫽ 0.05). Multivariate data analysis. All multivariate pattern analyses were performed on a single-subject basis. Activity patterns were estimated trial by trial (72 ⫻ 3) in an anatomically defined auditory cortex mask, covering the superior temporal gyrus (STG) including Heschl’s gyrus (HG) and its adjacency [i.e., its anterior and posterior borders reaching into planum polare (PP) and planum temporale (PT)] as well as the superior temporal sulcus (STS). Anatomical masks were delineated on an inflated cortex mesh for each subject and hemisphere separately to account for differences in gross anatomy. At each voxel, the trial response was extracted by fitting a GLM with one predictor for the expected BOLD response and one predictor accounting for the trial mean. A multivoxel pattern was defined from the response-related  coefficients (De Martino et al., 2008; Formisano et al., 2008). The shape of the hemodynamic response function was optimized per subject. The multivoxel response patterns to the different sound classes were analyzed by means of linear support vector machines (SVMs) in combination with an iterative voxel selection algorithm (RFE) (De Martino et al., 2008) to derive the most informative voxels. We followed two different strategies to label each single-trial response pattern. In a first approach, trials were divided based on the trained dimension: trials with pitch levels 1–3 and 4 – 6 were assigned to class 1 and class 2, respectively, independent of the other stimulus dimensions. In an alternative control approach, trials were labeled according to the untrained dimension (i.e., velocity), resulting in two classes comprising trials with either slow (1–3 cycles/s) or fast (4 – 6 cycles/s) velocity values, regardless of pitch and density. Both strategies resulted in 36 trials per class in each run. In four of the eight subjects—to estimate the  coefficients in an appropriate time window of four TRs per trial—we needed to remove the last trial of each run due to insufficient data supply. A trial from the respective other class was equally deleted to balance the number of trials per class resulting in 35 trials. For classifier training, trials were divided into a training and a test set using a leave-one run-out approach resulting in three different splits. Two runs (i.e., 72 trials per class) were used for classifier training while the remaining run (i.e., 36 trials per class) was used to assess classifier performance and test its generalization ability. This procedure was repeated for the number of splits. This validation procedure avoids potential overfitting of the model to irrelevant fluctuations in the training data. Final accuracy values at each voxel selection level were computed as the mean over the three splits for the test data set only. Each split of the leave-one run-out cross-validation procedure included a univariate (GLM-based) feature selection based on the training data only. Using one predictor per class, we selected the 5000 most active voxels (overall main effect, F ). This constrains the classification procedure to those voxels that exhibit a general response to the used stimuli and limits the
13276 • J. Neurosci., September 19, 2012 • 32(38):13273–13280
Ley et al. • Neural Representations of Learned Sound Categories
classification to an equal number of voxels in each subject (for details, see De Martino et al., 2008). This was followed by 160 iterations of the RFE algorithm. In each of the iterations, a different subset of the training trials (95%) was used to train the classifier and to retrieve the discriminative weights of the voxels. These weights provide information about the relative contribution of voxels to class discrimination. Classification accuracy at each level was assessed on the independent test data set. After four consecutive trainings, the ranked discrimination weights were averaged and the lowest 10% were discarded while the rest was used to retrain the classifier. This procedure resulted in 40 voxel selection levels per split. To assess whether our classification accura- Figure 2. Group behavioral results (data are represented as mean ⫾ SEM). A, Categorization accuracy in three nonfeedback cies significantly differed from chance level, we test blocks before training, and after 1 and 2/3 training blocks, respectively. B, Identification functions (curve-fitting results and used a permutation test (Nichols and Holmes, original data points before training and after 2/3 training blocks). A logistic function (Eq. 1) was fitted to the mean probabilities to 2002). For this purpose, the same RFE proce- categorize a sound as “B” along the pitch continuum. The derivative of the respective curves is indicated in light gray to highlight dure used for the experimental protocols was the shift and steepening of the category boundary reflected by the maximum of the function. repeated 100 times per subject, session, and trial division (i.e., trained/untrained), with 0.001) with training (Fig. 2 A). Figure 2 B shows that, before scrambled trial labels (using the randperm function in Matlab). Classifilearning, the average sound identification curve was rather flat cation accuracies for permutations are based on the maximum accuracy and had a small amplitude (estimated parameters of the fit: a ⫽ across 40 RFE levels (averaged across splits) in each permutation aver33.51; b ⫽ 40.6; c ⫽ 0.46; d ⫽ 4.22) reflecting the ambiguity of the aged over 100 iterations for each subject and fMRI session separately. classes with respect to the sound dimensions and the continuous This procedure controls for the potential bias in the accuracy estimation introduced by considering the best feature selection level. nature of ripple pitch. With learning, the curve expanded along To investigate the cortical regions involved in discrimination of the the y-axis, indicating that the category extremes were classified newly learned categories, group discriminative maps were visualized on with higher confidence, and changed into a steep sigmoid shape an average cortex reconstruction following cortex-based alignment of with a sharp transition at the category boundary (a ⫽ 98.3; b ⫽ 0; single-subject discrimination maps. In Figure 3B, we display those voxc ⫽ 0.44; d ⫽ 3.41), a characteristic signature of CP (Harnad, els, which consistently survived at least 10 of the 40 RFE selection levels in 1987). Average goodness of fit expressed in adjusted R 2 was 0.96 six of eight subjects. Maps were corrected by applying a cluster size and 0.99 for prelearning and postlearning, respectively. threshold of 25 mm 2. An identical procedure for the fMRI data collected before learning did not lead to consistent voxels. Learning-induced fMRI pattern changes and relationship to behavior. To Imaging results: univariate statistical analysis of fMRI data examine the relationship between learning-induced changes in fMRI patRipple sounds significantly activated extended regions on bilatterns and behavioral changes, we performed the following analysis. First, for eral superior temporal cortex. FMRI responses included large each subject and for both pre- and post-fMRI sessions, we defined a protoparts of the STG, including HG, Heschl’s sulcus (HS), and PT, as typical response pattern for category A and B by considering the average well as smaller portions of the STS and insular cortex. Univariate response pattern (training data) for pitch levels 1–3 and 4 – 6, respectively, in contrasts between trained categories did not yield any significant the 500 voxels with the largest SVM weights in the 10th voxel selection level. response differences for the group (fixed effect) and for each Second, we correlated the prototypical response patterns with the response single subject separately (FDR-corrected threshold, q ⫽ 0.05) patterns for each individual pitch level (1– 6), estimated from the same voxneither before nor after learning. These results are consistent with els and using test trials only. Per subject, thus we obtained four vectors describing the similarity of the response patterns to the prototypical response the hypothesis that learning may induce subtle neural changes to category A and B, before and after learning [i.e., values ci(pA pre), ci(pB pre), without significant changes in overall activation (Ohl et al., 2001; ci(pA post), ci(pA post), where i ⫽ 1. . .6 indicates the pitch level]. To reSchnupp et al., 2006). move the intrinsic correlation between responses, difference scores were calculated in each subject as di pre ⫽ ci(pB pre) ⫺ ci(pA pre), Imaging results: decoding of novel sound categories from di post ⫽ ci(pB post) ⫺ ci(pA post) after all correlation values were transfMRI patterns formed using Fisher’s z. The curve plotted in Figure 5 indicates the We compared pretraining and posttraining classifier performance differences in fMRI pattern similarities between pre- and post-fMRI session, obtained by fitting the difference di post ⫺ di pre (by Eq. 1), averaged across subon unlabeled trials after the algorithm had been trained with a subset jects. Analogously, we computed the post ⫺ pre difference in behavioral identiof trials labeled either according to the trained (pitch) or untrained fication functions (% B responses) to reveal the learning-induced changes in (velocity) sound dimension, regardless of the other sound features. perceptual similarity. For visualization purposes, both fMRI and behavioral We thereby assessed the correspondence of the fMRI pattern discurves were standardized using the z transformation.
Results Behavioral results Average categorization performance reflected successful learning of pitch classes in 2 training days (corresponding on average to 324 feedback trials). Accuracy, as measured in nonfeedback test blocks before training and after one and two/three training blocks, increased gradually and significantly (F(2,14) ⫽ 31.10; p ⬍
crimination with the behavioral learning rule. A repeated-measures ANOVA revealed a significant interaction between fMRI session and trial labels (F(2,14) ⫽ 11.82; p ⫽ 0.001; Fig. 3A). Before category learning, the classifier did not succeed in distinguishing two sound classes based on either dimension. Classification accuracy for test trials did not significantly differ from empirical chance level, estimated with permutation. After subjects were trained, average classification accuracy across eight subjects reached 60.19% for the trained sound classes (pitch) and only 54.47% for the untrained
Ley et al. • Neural Representations of Learned Sound Categories
J. Neurosci., September 19, 2012 • 32(38):13273–13280 • 13277
manner. After category learning, neural response patterns for sounds with higher pitch (pitch levels 4, 5, 6) correlated with the prototypical response pattern for class B more strongly than class A, independent of other acoustic features. The profile of these correlations on the pitch continuum closely reflected the sigmoid shape of the behavioral category identification function (Fig. 5). On average, these learning-induced pattern changes strongly correlated with the changes in behavioral sound categorization (r ⫽ 0.91; p ⫽ 0.01). Imaging results: group discrimination maps Voxel patterns discriminative for the learned pitch classes were distributed bilaterally over the auditory cortex and included regions of the primary and early auditory areas (on HG and adjacent regions). Both hemispheres revealed activation clusters in the posterior lateral portion of HG (corresponding approximately to MNI coordinates ⫾45, ⫺20, 12) extending beyond its posterior border into HS and PT (mainly left hemisphere, ⫺45, ⫺30, 12) and anteriorly into the first transverse sulcus (FTS) (Fig. 3B). Especially in the right hemisphere, additional clusters were found on anterior lateral HG (48, ⫺13, 4) and extended portions of the middle STG/STS (45, ⫺19, ⫺5). These voxels were highly consistent across subjects (six of eight) and stable over at least 10 elimination levels.
Discussion In this fMRI study, we used multivoxel pattern analysis to reveal changes in sound representations induced by the formation of new perceptual categories in Figure 3. Imaging results: fMRI pattern analysis. A, The left panel shows individual peak classification accuracies based on fMRI human auditory cortex. We trained subdata before category training and after successful category learning for the two types of stimulus space divisions (trained vs jects to dissect a multidimensional sound untrained) and the respective trial labeling. Individual subjects are indicated with numbers on the right of each line. Group- space based on one relevant feature and averaged classification accuracies are shown on the right. Mean accuracies are computed from the individual peak values across measured neural responses to the passive voxel elimination levels for each session and trial division. Theoretical and average empirical chance levels (estimated through permutation) are displayed as dashed black and solid black lines, respectively. B, Group discrimination maps based on the postle- exposure to a sound continuum before arning fMRI data for the trained stimulus division (i.e., “low pitch” vs “high pitch”), displayed on an average reconstructed cortical and after successful category learning. Listeners successfully learned the new surface after cortex-based realignment. A certain cortical location (vertex) was color-coded when it survived at least 10 of the sound categories as reflected in their feature elimination levels in at least six of eight subjects (cluster size threshold, 25 mm 2). categorization accuracy and the shape of the category identification function. sound classes (velocity). Two a priori hypotheses were tested with The gradual increase of categorization performance across training Bonferroni-corrected ␣ levels of 0.025. The pairwise comparison of blocks suggests that a sudden insight into the relevant acoustic pitch classification accuracies before and after training revealed a dimension alone was insufficient to achieve precise categorisignificant increase in accuracy with category learning (t(7) ⫽ 5.67; zation. Instead, perceptual learning (Ahissar, 1999) at the catep ⫽ 0.001). In the posttraining session, accuracies for pitch discrimgory boundary was required for optimal classification. In ination were significantly above the empirical chance level of 54% accordance with previous studies (Smits et al., 2006; Goudbeek et (t(7) ⫽ 9.58; p ⬍ 0.001). In seven of eight subjects, the classification al., 2009), categorization performance transferred well from the accuracy for trained pitch classes significantly (p ⱕ 0.05) differed Gaussian training distributions to the continuous stimulus space from accuracies obtained with permuted trial labels (Fig. 4). and persisted despite lack of feedback. This demonstrates the Importantly, category training affected perceptual similarity generalization of the learned categories to novel sounds without expressed in sound identification curves and fMRI pattern similarity derived from correlation measures in an analogous distributional cues indicative of the category structure or direct
13278 • J. Neurosci., September 19, 2012 • 32(38):13273–13280
Ley et al. • Neural Representations of Learned Sound Categories
reinforcement in the form of corrective feedback. This abstraction process is considered fundamental to categorization (Ke´ri, 2003). The sigmoid shape of the category identification function after training resembled the labeling data from natural phoneme categories (Liberman et al., 1957). The formation of the category boundary separating the two pitch classes required the abstraction of discrete classes from continuous pitch information and the mapping of pitches to different labels on either side of the classification boundary. Moreover, subjects had to ignore the additional irrelevant spectral and temporal variations and select only pitch as the basis for the development of abstract representations of pitch classes. Perceptual invariance of sets of objects classified as belonging to the same category (despite variations in some aspects) is considered a vital function underlying object recognition (Ju¨ttner and Rentschler, 2008; Walker et al., 2011). Crucially, before learning, the abstract pitch categories could not be decoded from the auditory cortex. This argues Figure 4. Distribution of classification accuracies obtained with permuted trial labels. The values reflect the maximum against preexisting representations of our classification accuracy across 40 RFE levels (averaged over splits) for 100 permutations for each subject (N ⫽ 8) separately. sound categories and suggests that feature The normal curve is defined by the mean and SD of the underlying distribution. The red shading reflects the 95% confidence mapping alone is insufficient for categor- interval. The red marker indicates the actual accuracy obtained with trial labels according to the trained (i.e., pitch) ical representations. Frequencies discrim- dimension. The p values (extracted from the cumulative distribution function) reflect above-chance ( p ⱕ 0.05) classificainable in tonotopic maps usually lie much tion in seven of eight subjects. further apart and reflect the relative preference of the voxel resulting from best-frequency analysis (i.e., color coding of frequency at which the response is maximum) rather than significant frequency contrasts (Formisano et al., 2003). Furthermore, the pitch classes contrasted in our analysis are characterized by large within-class variability, not only in the irrelevant dimensions (velocity and density) but also along the relevant dimension (three pitch values are grouped into one class). After learning, the classifier correctly assigned activation patterns in the auditory cortex to their corresponding pitch class, independent of the other spectrotemporal variations present in the sounds. These results suggest the development of discriminative response patterns for the pitch classes with learning. It should be noted that category learning did not affect the representation of all sound features but selectively enhanced the differences in the behaviorally relevant dimension at the learned category boundary. This important differentiation therefore excludes repeated stimulus exposure as a potential cause of increased classifier performance (Seitz and Watanabe, 2003) and provides direct evidence for specific representational changes in human auditory cortex with category learning. Figure 5. Changes in pattern similarity and behavioral identification curves. The The widespread activation of auditory areas can be attributed learning-induced change in fMRI pattern similarity along the pitch continuum (levels to the complex spectrotemporal structure of the used rippled 1– 6) is illustrated by correlation difference scores (di) contrasted between postlearning sounds, which engage a multitude of functional processing areas and prelearning sessions (for details, please refer to Materials and Methods). Behavioral (Langers et al., 2003; Scho¨nwiesner and Zatorre, 2009). Given the data analogously correspond to the post ⫺ pre difference in identification functions (% B identical stimulus sets for prelearning and postlearning fMRI sesresponses). Data are visualized in z units and represent the group mean ⫾ SEM. The lines sions and the uniform distribution of the used test sounds, the reflect the fit with the sigmoid function (Eq. 1) used for behavioral data analysis (see changes in sound representations essentially rely on perceptual Materials and Methods, Curve fitting). Markers are displayed with a slight offset to inreinterpretations of the same acoustic input induced by category crease visibility. Pearson’s correlation coefficient (r) indicates strong correspondence between behavioral and neural measures. learning. Our results demonstrate the flexibility of sound repre-
Ley et al. • Neural Representations of Learned Sound Categories
sentations in early auditory areas and the ability of auditory cortical neural populations to adapt relatively quickly to situationdependent changes in the environment. This further supports the notion that these areas serve higher-order sound analysis beyond feature extraction in line with previous reports (Nelken, 2004). The resemblance of the activity pattern similarity and the perceptual sound similarity as reflected in the identification curves obtained outside the scanner suggests a link between perception and neural population coding. The good fit to the specified sigmoid function (adjusted R 2 of 0.78 for the fMRI and 0.99 for the behavioral data), generally used to model categorical data, suggests that continuous pitch information is represented categorically in distributed multivoxel patterns after learning. Discriminative maps resulting from multivariate analyses should be considered as a whole rather than localized hotspots. The essence of pattern analysis using linear classifiers is the weighted contribution of multiple voxels rather than the specialization of a particular cortical region. Yet, relating the most consistently informative locations with previous fMRI reports is useful to integrate our data in current knowledge. The lateral posterior part of HG and the posteriorly adjacent areas have previously been shown to code perceptual states rather than purely acoustic differences of sounds (Kilian-Hu¨tten et al., 2011). Furthermore, these areas have been used to reliably decode speaker information from natural and variable speech sounds (Formisano et al., 2008). Thus, they seem to play an important role in abstract and goal-directed representation of sounds. Activation in the right STS/STG is strongly related to vocal processing (Belin et al., 2000; Belin and Zatorre, 2003; Formisano et al., 2008), specifically the extraction of speaker identity and other paralinguistic information. As our sounds were nonharmonic complexes, the similarity to vocal sounds is rather small; however, voice identification is predominantly based on the extraction of the fundamental frequency (Belin et al., 2004; Baumann and Belin, 2010), which is the underlying acoustic dimension upon which ripple classification was based in our experiment. The right anterior lateral HG has been described to be involved in pitch analysis (Warren and Griffiths, 2003; Barrett and Hall, 2006). The recruitment of areas specialized in pitch processing is in line with the previously proposed concept of reallocation of resources according to task demands (Brechmann and Scheich, 2005). Altered representations of identical visual stimuli depending on the task-relevant features (Mirabella et al., 2007) and increased selectivity for diagnostic features (Sigala and Logothetis, 2002; De Baene et al., 2008) have previously been demonstrated in monkeys during active categorization. Despite the lack of control over the subjects’ performance during scanning, none of our subjects reported to have actively categorized the sounds. The finding of learning-induced modifications of stimulus representations in our study during passive listening suggests that task-related processes shape stimulus representations beyond the scope of the learning environment, yielding a multipurpose enhancement of neural sensitivity for the relevant stimulus differences. This provides neurophysiological support for the effects of “acquired distinctiveness/equivalence,” where relevant stimulus dimensions attain elevated discriminability while perceptual sensitivity for irrelevant dimensions is decreased after category learning (Goldstone, 1994). The emphasis of category-relevant processes at the expense of category-irrelevant processes at the level of the auditory cortex may increase overall efficiency and facilitate readout in higher order regions, conforming with theories of sparse coding (Olshausen and Field, 2004).
J. Neurosci., September 19, 2012 • 32(38):13273–13280 • 13279
Contrary to predictions from earlier reports (Desai et al., 2008; Leech et al., 2009), increased categorical processing of ripple sounds did not engage left posterior STS. This argues against a generic role of these speech-related areas in categorical processing but rather proposes that categorically perceived sounds specifically recruit left STG/STS for mapping onto highly abstract and overlearned phonemic representations if they share spectrotemporal speech characteristics. Despite the prevalent view that the PFC is the main site of category representations, in the visual domain the contribution of frontal and higher occipito-temporal and parietal areas in category learning remains under debate (Kourtzi and Connor, 2011). While comparisons between the auditory and visual domain might be limited by general cortical processing differences, our results provide direct evidence for representations of abstract sound categories already at early levels of the auditory processing hierarchy. While the current experiment cannot exclude the contribution of the PFC in categorical sound processing, recent evidence in humans suggests that the PFC is predominantly involved in rule learning and specifically recruited in the context of an active categorization task (Boettiger and D’Esposito, 2005; Li et al., 2009). The passive design used in the current study seems particularly suitable to reveal learning-dependent changes in the representations of sound categories in early processing areas rather than decision-related processes in the PFC. To conclude, our data present direct evidence in humans for learning-induced formation of categorical sound representations in early auditory areas. While responses to a psychophysical sound continuum could not be distinguished before learning, a few days of category training sufficed to reliably decode newly formed pitch categories from distributed response patterns in pitch-encoding areas in the absence of an active categorization task. Our results are consistent with animal studies and demonstrate that fMRI pattern analyses are eligible to reveal subtle changes in sound representations otherwise inscrutable to conventional contrast-based methods. Furthermore, our findings provide an important demonstration of the plastic nature of sound representations at early processing stages in human auditory cortex.
References Ahissar M (1999) Perceptual learning. Curr Dir Psychol Sci 8:124 –128. Barrett DJ, Hall DA (2006) Response preferences for “what” and “where” in human non-primary auditory cortex. Neuroimage 32:968 –977. Baumann O, Belin P (2010) Perceptual scaling of voice identity: common dimensions for different vowels and speakers. Psychol Res 74:110 –120. Belin P, Zatorre RJ (2003) Adaptation to speaker’s voice in right anterior temporal lobe. Neuroreport 14:2105–2109. Belin P, Zatorre RJ, Lafaille P, Ahad P, Pike B (2000) Voice-selective areas in human auditory cortex. Nature 403:309 –312. Belin P, Fecteau S, Be´dard C (2004) Thinking the voice: neural correlates of voice perception. Trends Cogn Sci 8:129 –135. Boettiger CA, D’Esposito M (2005) Frontal networks for learning and executing arbitrary stimulus-response associations. J Neurosci 25:2723–2732. Brechmann A, Scheich H (2005) Hemispheric shifts of sound representation in auditory cortex with conceptual listening. Cereb Cortex 15:578 –587. De Baene W, Ons B, Wagemans J, Vogels R (2008) Effects of category learning on the stimulus selectivity of macaque inferior temporal neurons. Learn Mem 15:717–727. De Martino F, Valente G, Staeren N, Ashburner J, Goebel R, Formisano E (2008) Combining multivariate voxel selection and support vector machines for mapping and classification of fMRI spatial patterns. Neuroimage 43:44 –58. Depireux DA, Simon JZ, Klein DJ, Shamma SA (2001) Spectro-temporal response field characterization with dynamic ripples in ferret primary auditory cortex. J Neurophysiol 85:1220 –1234.
13280 • J. Neurosci., September 19, 2012 • 32(38):13273–13280 Desai R, Liebenthal E, Waldron E, Binder JR (2008) Left posterior temporal regions are sensitive to auditory categorization. J Cogn Neurosci 20:1174 –1188. Formisano E, Kim DS, Di Salle F, van de Moortele PF, Ugurbil K, Goebel R (2003) Mirror-symmetric tonotopic maps in human primary auditory cortex. Neuron 40:859 – 869. Formisano E, De Martino F, Bonte M, Goebel R (2008) “Who” is saying “what”? Brain-based decoding of human voice and speech. Science 322:970 –973. Freedman DJ, Riesenhuber M, Poggio T, Miller EK (2001) Categorical representation of visual stimuli in the primate prefrontal cortex. Science 291:312–316. Freedman DJ, Riesenhuber M, Poggio T, Miller EK (2003) A comparison of primate prefrontal and inferior temporal cortices during visual categorization. J Neurosci 23:5235–5246. Glasberg BR, Moore BC (1990) Derivation of auditory filter shapes from notched-noise data. Hear Res 47:103–138. Goebel R, Esposito F, Formisano E (2006) Analysis of functional image analysis contest (FIAC) data with Brainvoyager QX: from single-subject to cortically aligned group general linear model analysis and selforganizing group independent component analysis. Hum Brain Mapp 27:392– 401. Goldstone R (1994) Influences of categorization on perceptual discrimination. J Exp Psychol Gen 123:178 –200. Goudbeek M, Swingley D, Smits R (2009) Supervised and unsupervised learning of multidimensional acoustic categories. J Exp Psychol Hum Percept Perform 35:1913–1933. Guenther FH, Husain FT, Cohen MA, Shinn-Cunningham BG (1999) Effects of categorization and discrimination training on auditory perceptual space. J Acoust Soc Am 106:2900 –2912. Harnad S (1987) Categorical perception: the groundwork of cognition (Harnad S, ed). Cambridge, UK: Cambridge UP. Haxby JV, Gobbini MI, Furey ML, Ishai A, Schouten JL, Pietrini P (2001) Distributed and overlapping representations of faces and objects in ventral temporal cortex. Science 293:2425–2430. Ju¨ttner M, Rentschler I (2008) Category learning induces position invariance of pattern recognition across the visual field. Proc Biol Sci 275:403– 410. Ke´ri S (2003) The cognitive neuroscience of category learning. Brain Res Brain Res Rev 43:85–109. Kilian-Hu¨tten N, Valente G, Vroomen J, Formisano E (2011) Auditory cortex encodes the perceptual interpretation of ambiguous sound. J Neurosci 31:1715–1720. Kourtzi Z, Connor CE (2011) Neural representations for object perception: structure, category, and adaptive coding. Annu Rev Neurosci 34:45– 67. Kowalski N, Depireux DA, Shamma SA (1996a) Analysis of dynamic spectra in ferret primary auditory cortex. I. Characteristics of single-unit responses to moving ripple spectra. J Neurophysiol 76:3503–3523. Kowalski N, Depireux DA, Shamma SA (1996b) Analysis of dynamic spectra in ferret primary auditory cortex. II. Prediction of unit responses to arbitrary dynamic spectra. J Neurophysiol 76:3524 –3534. Langers DR, Backes WH, van Dijk P (2003) Spectrotemporal features of the auditory cortex: the activation in response to dynamic ripples. Neuroimage 20:265–275. Leech R, Holt LL, Devlin JT, Dick F (2009) Expertise with artificial nonspeech sounds recruits speech-sensitive cortical regions. J Neurosci 29:5234 –5239.
Ley et al. • Neural Representations of Learned Sound Categories Levitt H (1971) Transformed up-down methods in psychoacoustics. J Acoust Soc Am 49 [Suppl 2]:467⫹. Li S, Ostwald D, Giese M, Kourtzi Z (2007) Flexible coding for categorical decisions in the human brain. J Neurosci 27:12321–12330. Li S, Mayhew SD, Kourtzi Z (2009) Learning shapes the representation of behavioral choice in the human brain. Neuron 62:441– 452. Liberman AM, Harris KS, Hoffman HS, Griffith BC (1957) The discrimination of speech sounds within and across phoneme boundaries. J Exp Psychol 54:358 –368. Liebenthal E, Desai R, Ellingson MM, Ramachandran B, Desai A, Binder JR (2010) Specialization along the left superior temporal sulcus for auditory categorization. Cereb Cortex 20:2958 –2970. McMurray B, Spivey M (2000) The categorical perception of consonants: the interaction of learning and processing. Proceedings of the Chicago Linguistics Society 34:205–220. Mirabella G, Bertini G, Samengo I, Kilavik BE, Frilli D, Della Libera C, Chelazzi L (2007) Neurons in area V4 of the macaque translate attended visual features into behaviorally relevant categories. Neuron 54:303–318. Nelken I (2004) Processing of complex stimuli and natural scenes in the auditory cortex. Curr Opin Neurobiol 14:474 – 480. Nichols TE, Holmes AP (2002) Nonparametric permutation tests for functional neuroimaging: a primer with examples. Hum Brain Mapp 15:1–25. Ohl FW, Scheich H, Freeman WJ (2001) Change in pattern of ongoing cortical activity with auditory category learning. Nature 412:733–736. Olshausen BA, Field DJ (2004) Sparse coding of sensory inputs. Curr Opin Neurobiol 14:481– 487. Schnupp JW, Hall TM, Kokelaar RF, Ahmed B (2006) Plasticity of temporal pattern codes for vocalization stimuli in primary auditory cortex. J Neurosci 26:4785– 4795. Scho¨nwiesner M, Zatorre RJ (2009) Spectro-temporal modulation transfer function of single voxels in the human auditory cortex measured with high-resolution fMRI. Proc Natl Acad Sci U S A 106:14611–14616. Seger CA, Miller EK (2010) Category learning in the brain. Annu Rev Neurosci 33:203–219. Seitz AR, Watanabe T (2003) Is subliminal learning really passive? Nature 422:2003. Selezneva E, Scheich H, Brosch M (2006) Dual time scales for categorical decision making in auditory cortex. Curr Biol 16:2428 –2433. Shamma S (1996) Auditory cortical representation of complex acoustic spectra as inferred from the ripple analysis method. Netw Comput Neural Syst 7:439 – 476. Sigala N, Logothetis NK (2002) Visual categorization shapes feature selectivity in the primate temporal cortex. Nature 415:318 –320. Smits R, Sereno J, Jongman A (2006) Categorization of sounds. J Exp Psychol Hum Percept Perform 32:733–754. Staeren N, Renvall H, De Martino F, Goebel R, Formisano E (2009) Sound categories are represented as distributed patterns in the human auditory cortex. Curr Biol 19:498 –502. Walker KM, Bizley JK, King AJ, Schnupp JW (2011) Cortical encoding of pitch: recent results and open questions. Hear Res 271:74 – 87. Warren JD, Griffiths TD (2003) Distinct mechanisms for processing spatial sequences and pitch sequences in the human auditory brain. J Neurosci 23:5799 –5804. Wetherill GB, Levitt H (1965) Sequential estimation of points on a psychometric function. Br J Math Stat Psychol 18:1–10.