Jun 6, 2017 - b Chongqing Geomatics Centre, Chongqing 401121, China. Commission VI ... model for building detection in single aerial image. As we know ...
The International Archives of the Photogrammetry, Remote Sensing and Spatial Information Sciences, Volume XLII-1/W1, 2017 ISPRS Hannover Workshop: HRIGI 17 – CMRT 17 – ISA 17 – EuroCOW 17, 6–9 June 2017, Hannover, Germany
Learning Oriented Region-based Convolutional Neural Networks for Building Detection in Satellite Remote Sensing Images Chaoyue Chen a, Weiguo Gong a, Yan Hu b, Yongliang Chena, Yi Dingb a
Key Lab of Optoelectronic Technology & Systems of Education Ministry, Chongqing University, Chongqing 400044, China – (chaoyue_chen, wggong, huyan_dl023, chen_yong_liang, dingyi)@cqu.edu.cn b Chongqing Geomatics Centre, Chongqing 401121, China Commission VI, WG VI/4
KEY WORDS: VGG, Building detection, Deep learning, OR-CNN, Satellite remote sensing images
ABSTRACT: The automated building detection in aerial images is a fundamental problem encountered in aerial and satellite images analysis. Recently, thanks to the advances in feature descriptions, Region-based CNN model (R-CNN) for object detection is receiving an increasing attention. Despite the excellent performance in object detection, it is problematic to directly leverage the features of R-CNN model for building detection in single aerial image. As we know, the single aerial image is in vertical view and the buildings possess significant directional feature. However, in R-CNN model, direction of the building is ignored and the detection results are represented by horizontal rectangles. For this reason, the detection results with horizontal rectangle cannot describe the building precisely. To address this problem, in this paper, we proposed a novel model with a key feature related to orientation, namely, Oriented R-CNN (OR-CNN). Our contributions are mainly in the following two aspects: 1) Introducing a new oriented layer network for detecting the rotation angle of building on the basis of the successful VGG-net R-CNN model; 2) the oriented rectangle is proposed to leverage the powerful R-CNN for remote-sensing building detection. In experiments, we establish a complete and bran-new data set for training our oriented R-CNN model and comprehensively evaluate the proposed method on a publicly available building detection data set. We demonstrate State-of-the-art results compared with the previous baseline methods.
1. INTRODUCTION Building detection in aerial images is a fundamental problem encountered in aerial images analysis. In recent years, with rapidly growing urbanization and municipal regions, automatic detection of buildings from satellite remote sensing images is a hot topic and an active field of research. Building detection have been researched in a very large number of studies. In earlier works, researches often based on the shape estimation or contour outlining. (Huertas and Nevatia, 1988) introduced a technique for detecting buildings with rectangular components and shadow information. (Lin and Nevatia, 1998) proposed a line based segmentation technique, which were based on the extraction of line segments, processed with various methods. In the same manner, (Sirmacek and Unsalan, 2008) present a new model (Box-Fit) to fuse shadow and invariant colour features with edge information in the experiments. Following the region-based trend, a segment-merge technique (SM) is introduced (Song et al., 2006), which considered building detection as a region level task and assumed buildings to be homogeneous areas. (Ok et al., 2013) proposed the Grab-Cut algorithm for building detection. The algorithm contains a two level graph partitioning framework and increasing the performance of his previous proposed model (Ok et al., 2013). Research on feature point detectors applied for building detection is an another active field of research. Harris and SUSAN detectors, published in (Harris and Stephens, 1988) and (Smith and Brady, 1997), were validated for distinguishing building versus natural structures. (Sirmacek and Unsalan, 2009)
introduced a graph construction approach for urban area. (Lowe, 2004) presented a method for extracting distinctive invariant features Scale-invariant feature transform (SIFT) key points which is used in building detection. Recently, thanks to the advances in feature descriptions, deep learning for object detection is receiving an increasing attention. In 2006, (Hinton and Salakhutdinov., 2006) describe an effective way of initializing the weights that allows deep auto-encoder networks to learn low-dimensional codes. In 2012, (Krizhevsky et al., 2012) proposed Alex-Net based on convolutional neural network (CNN), which achieve a great success in image recognition on a publicly image data set (ImageNet). After that, (Simonyan et al., 2014) proposed a very deep convolutional networks model (VGG-Net model) and (Szegedy et al., 2015) presented GoogLeNet model. Despite the excellent performance of deep learning model works on the nature image recognition, it is problematic to leverage the model directly for building detection in single aerial image. As we know, the single aerial image is in vertical view and the buildings possess significant directional feature. However, in deep learning model, direction of the building is ignored. To address this problem, we proposed a novel model, namely, Oriented R-CNN (OR-CNN). In our model, we train a new oriented network for detecting the rotation angle of building on the basis of the successful VGG-net R-CNN model and then propose the oriented rectangle to leverage the powerful R-CNN for remote-sensing building detection. The rest of this paper is organized as follows. In Sect..2, we introduction the architecture of our OR-CNN model and how to
This contribution has been peer-reviewed. doi:10.5194/isprs-archives-XLII-1-W1-461-2017
461
The International Archives of the Photogrammetry, Remote Sensing and Spatial Information Sciences, Volume XLII-1/W1, 2017 ISPRS Hannover Workshop: HRIGI 17 – CMRT 17 – ISA 17 – EuroCOW 17, 6–9 June 2017, Hannover, Germany
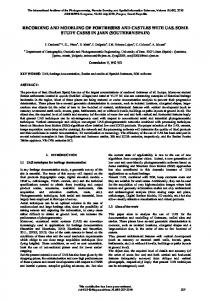
C1
C2
C1
FC6 FC7 FC8
C3
C2
FC6 FC7 FC8
C3
30 degrees 60 degrees 90 degrees
... ...
120 degrees 150 degrees
Conv layers
Input image
FC layers
Conv layers
Building detection network
Result of detection network
FC layers
180 degrees
orientation classifier network
Final result
Figure 1. Overall framework of the proposed building detection system training our model in details. In Sect.3, we report the building detection results with our model. Finally, conclusions are drawn in Sect.4.
in the first layer then increasing by a factor of 2 after each maxpooling layer, until it reaches 512 channels. In the FC layers, the first two (FC6 and FC7) has 4096 channels each and the last FC layer (FC8) contains 2 channel to distinguish between the building and background.
2. PROPOSED METHOD 2.1 Architecture of VGG-Net R-CNN Model The VGG model consists 5 configurations (namely A-E) and differs only in the depth: from 11 weight layers in network A to 19 weight layers in network E. In this Section, we briefly introduce the 16 weight layers of VGG-Net model. In the model, it contains 13 convolutional (conv.) layers and 3 Fully-Connected (FC) layers. In training, the input to the VGG network is a fixed-size 224 * 224 RGB image. The image is passed through the 13 convolutional layers where it uses a 3 * 3 sliding filter window with stride 1. Spatial pooling is carried out by five max-pooling layers, which follow some of the convolutional layers (not all convolutional layers are followed by max-pooling). Max-pooling is carried out over a 2 * 2 sliding filter window, with stride 2. In three FC layers: the first two (FC6 and FC7) has 4096 channels each and the third one (FC8) is the soft-max transform layer which contains 1000 channels for 1000 classes. 2.2 Proposal Oriented R-CNN Model The proposal Oriented R-CNN model contains two parts, building detection network and orientation classifier network, which are both designed on a basis of the successful VGG-net RCNN model. Figure.1 shows the overview of the proposed building detection system. When a test image inputs, the building detection network will find the candidate building areas. Then the candidate areas are set as the input into the orientation classifier network to classify which angle class they are (we set up a total of 6 classes about the orientation of building: 0 to 30 degrees in 30-degrees class, 30 to 60 degrees in 60-degrees class, 60 to 90 degrees in 90-degrees class, 90 to 120 degrees in 120-degrees class, 120 to 150 degrees in 150-degrees class and 150 to 180 degrees in 180-degrees class). In the output, the oriented rectangle is proposed. We rotate the detection box with the angle (detected in orientation classifier network) to make the result more accurate. For building the proposal model, it mainly consists two steps: Step1: Training building detection network In the first step, we design a building detection network. Table.1 shows all of the configuration about the network (the convolutional layer parameters are denoted as “Conv- [number of channels]” and the Fully-Connected layers are denoted as “FC[number of channels]”). It contains 16 weight layers which consists by 13 Conv and 3 FC layers. The width of Conv layers (the number of channel) is rather small, starting from 64 channels
Table 1. Building detection network configuration and orientation classifier network configuration Network Configuration Building detection network
Orientation classifier network Input (224 * 224 RGB Input image (no size image) limitation) Conv-64 Conv-64 Conv-64 Conv-64 Max-pooling layer Conv-128 Conv-128 Conv-128 Conv-128 Max-pooling layer Conv-256 Conv-256 Conv-256 Conv-256 Conv-256 Conv-256 Max-pooling layer Conv-512 Conv-512 Conv-512 Conv-512 Conv-512 Conv-512 Max-pooling layer Conv-512 Conv-512 Conv-512 Conv-512 Conv-512 Conv-512 Max-pooling layer FC-4096 FC-4096 FC-4096 FC-4096 FC-2 FC-6 Soft-max
The training procedure follows as (Krizhevsky et al., 2012). The batch size is set to 256 and momentum to 0.9. In training, the weight parameters of each layer is regularised by weight decay and dropout regularisation. We set the weight decay parameter to 5 ∙ 10−4 and the dropout ratio to 0.5. The learning rate is initially set to 0.01, and then decreased by a factor of 10 when the validation set accuracy stopped improving. Step2: Fine-tuned training orientation classifier network The orientation classifier network configuration is similar to the building detection network except the last FC layer. Table.1 shows all of the configuration about the network. The last FC layer (FC8) contains 6 channels to classify the angle class of building. We set up a total of 6 classes about the orientation of building: 0 to 30 degrees in 30-degrees class, 30 to 60 degrees in
This contribution has been peer-reviewed. doi:10.5194/isprs-archives-XLII-1-W1-461-2017
462
The International Archives of the Photogrammetry, Remote Sensing and Spatial Information Sciences, Volume XLII-1/W1, 2017 ISPRS Hannover Workshop: HRIGI 17 – CMRT 17 – ISA 17 – EuroCOW 17, 6–9 June 2017, Hannover, Germany
60-degrees class, 60 to 90 degrees in 90-degrees class, 90 to 120 degrees in 120-degrees class, 120 to 150 degrees in 150-degrees class and 150 to 180 degrees in 180-degrees class. Then, finetuning train the network with the small learning rate 0.0001.
average precision in our whole test data set (contains 400 images). Figure.3 shows Precision-recall curve of our network in test data set. The AP value is still in a high level, reached to 77.8%.
3. EXPERIMENTS 3.1 Data set design We evaluate the performance of the proposal OR-CNN model on an available data set. The data set contains a total of 2000 satellite remote sensing images with the spatial resolution of 0.2 m. In order to achieve better training effect, the size of each image we choose 224 * 224 in data set. In this way, the input images will not adjust the size to keep the feature of the original image for training (In OR-CNN model, no matter what size of input images are, it will resize the input image to 224 * 224 that will lose some features about the original images). Then, the image data set is divided into 20% for test, 60% for training and 20% for validation, resulting in three independent subsets: a training set containing 1200 images, a validation set containing 400 images and a test set containing 400 images. For fine-tuned training the orientation classifier network of the OR-CNN model, a data set is built with rotation pre-processing. In the data set, it contains 300 images which is also divided into 20% for test, 60% for training and 20% for validation.
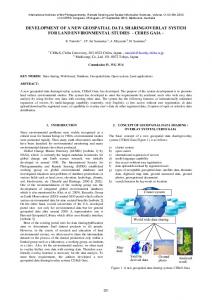
(b) Image 2
(c) Image 3 (d) image 4 Figure 2. A number of building detection results with the building detection network in proposed model Table 2. Evaluation results of the four images
3.2 Evaluation metrics In the work, we adopt two standard and widely used evaluation metrics, precision-recall curve (PRC) and average precision (AP), to evaluate the performance of the proposed OR-CNN building detection model. In precision-recall curve, the Precision metric measures the fraction of detections that are true positives and the Recall metric measures the fraction of positives that are correctly identified. We set TP denote the number of true positives, FP denote the number of false positives, and FN denote the number of false negatives. Precision and Recall can be defined as: Precision = Recall =
(a) Image 1
𝑇𝑃 (𝑇𝑃 + 𝐹𝑃)
𝑇𝑃 (𝑇𝑃 + 𝐹𝑁)
Image
TP
FP
FN
Precision(%)
Recall(%)
Image 1
24
0
2
100
92.3
Image 2
20
0
1
100
95.2
Image 3
14
1
0
93.3
100
Image 4
21
0
0
100
100
98.3
96.9
Average
(1) (2)
Average Precision: The AP computes the average value of Precision over the interval from Recall = 0 to Recall = 1, i.e., the area under the PRC. Therefore, the higher the AP value, the better the performance. 3.3 Results Using the trained building detection network model, we performed building detection on four test satellite remote sensing images. Figure.2 shows building detection results of four test images with the building detection network in proposed model, in which the true positives (TP), false positives (FP), and false negatives (FN) are denoted by red, green, and blue rectangle. Besides visual illustration, the numerical results of the proposed method are listed in Table.2. As shown in Table.2, the proposed building detection network has successfully detected and located most of the buildings. The average precision of the four images reached 98.3%. In addition, to further validate the performance of the proposed building detection network, we compute the
Figure 3. Precision-recall curve of the building detection network In the trained orientation classifier network model, we performed angle detection on the same four test satellite remote sensing images (image 1, 2, 3, 4). Table.3 shows precision of the angles detection in the four images. As shown in Table.3, the precision
This contribution has been peer-reviewed. doi:10.5194/isprs-archives-XLII-1-W1-461-2017
463
The International Archives of the Photogrammetry, Remote Sensing and Spatial Information Sciences, Volume XLII-1/W1, 2017 ISPRS Hannover Workshop: HRIGI 17 – CMRT 17 – ISA 17 – EuroCOW 17, 6–9 June 2017, Hannover, Germany
in image 3 and image 4 have reached to 93.3% and 90.4%. However, the precision in image 1 and image 2 only 73.1% and 76.2%. This is mainly because we only considered the rectangular shape building as the training data set. In our future work, we will consider adopting various shapes of buildings as the training data set to further improve the angles detection performance. Table.3 Precision of building angles classification Image
Precision(%)
Image 1
73.1
Image 2
76.2
Image 3
93.3
Image 4
90.4
Lowe, D.G., 2004. Distinctive image features from scaleinvariant keypoints. Int. J. Comput. Vis. 60 (2), 91–110. Hinton, G.E., Salakhutdinov, R.R., 2006. Reducing the dimensionality of data with neural networks. Science, 313(5786), 504. Krizhevsky, A., Sutskever, I., Hinton, G.E., 2012. ImageNet classification with deep convolutional neural networks. In: International Conference on Neural Information Processing Systems, pp. 1097-1105. Simonyan, K., Zisserman, A., 2014. Very deep convolutional networks for large-scale image recognition. arXiv preprint arXiv:1409.1556. Szegedy, C., Liu, W., Jia, Y., Sermanet, P., 2015. Going deeper with convolutions. In: IEEE International Conference on Computer Vision and Pattern Recognition.
4. CONCLUSIONS In this paper, we proposed a novel and effective OR-CNN model for building and its angles detection. To improve the performance of building detection in images, we 1) adapt the successful object detection network VGG to building detection in remote sensing images and 2) a building orientation classifier network is designed for detecting the building angles. In the verifying experiments, the two designed network have demonstrated excellent performance on the test data set. However, as we know, our two network will introduce additional computational cost compared with one network model. In the future work, we will focus on combined the two network into one network to improve the computational efficiency.
REFERENCES Huertas, A., Nevatia, R., 1988. Detecting buildings in aerial images. Comput. Vis. Graph. Image Process. 41(2), 131-152. Lin, C., Nevatia, R., 1998. Building detection and description from a single intensity image. Computer Vision and Image Understanding, 72(2), 101-121. Sirmacek, B., Unsalan, C., 2008. Building detection from aerial images using invariant color features and shadow information. In: 23rd International Symposium on Computer and Information Sciences, pp. 1-5. Song, Z., Pan, C., Yang, Q., 2006. A region-based approach to building detection in densely build-up high resolution satellite image. In: IEEE International Conference on Image Processing, pp. 3225–3228. Ok, A.O., Senaras, C., Yuksel, B., 2013. Automated detection of arbitrarily shaped buildings in complex environments from monocular VHR optical satellite imagery. IEEE Trans. Geosci. Remote Sens. 51 (3), 1701–1717. Harris, C., Stephens, M., 1988. A combined corner and edge detector. In: Alvey Vision Conference, pp. 147–151. Smith, S.M., Brady, J.M., 1997. SUSAN – a new approach to low level image processing. Int. J. Comput. Vis. 23 (1), 45–78. Sirmacek, B., Unsalan, C., 2009. Urban-area and building detection using SIFT keypoints and graph theory. IEEE Trans. Geosci. Remote Sens. 47 (4), 1156–1167.
This contribution has been peer-reviewed. doi:10.5194/isprs-archives-XLII-1-W1-461-2017
464