Via Giuseppe Moruzzi 1, 56124 Pisa, Italy. Abstract. One of the main claims of the active vision framework is that finding data on the basis of task requirements is ...
Learning to Look in Different Environments: An Active-Vision Model Which Learns and Readapts Visual Routines Dimitri Ognibene1 , Giovanni Pezzulo2 , and Gianluca Baldassare1,� 1
2
Istituto di Scienze e Tecnologie della Cognizione, Consiglio Nazionale delle Ricerche, Via San Martino della Battaglia 44, 00185 Rome, Italy Istituto di Linguistica Computazionale “Antonio Zampolli”, Consiglio Nazionale delle Ricerche, Via Giuseppe Moruzzi 1, 56124 Pisa, Italy
Abstract. One of the main claims of the active vision framework is that finding data on the basis of task requirements is more efficient than reconstructing the whole scene by performing a complete visual scan. To be successful, this approach requires that agents learn visual routines to direct overt attention to locations with the information needed to accomplish the task. In ecological conditions, learning such visual routines is difficult due to the partial observability of the world, the changes in the environment, and the fact that learning signals might be indirect. This paper uses a reinforcement-learning actor-critic model to study how visual routines can be formed, and then adapted when the environment changes, in a system endowed with a controllable gaze and reaching capabilities. The tests of the model show that: (a) the autonomouslydeveloped visual routines are strongly dependent on the task and the statistical properties of the environment; (b) when the statistics of the environment change, the performance of the system remains rather stable thanks to the re-use of previously discovered visual routines while the visual exploration policy remains for long time sub-optimal. We conclude that the model has a robust behaviour but the acquisition of an optimal visual exploration policy is particularly hard given its complex dependence on statistical properties of the environment, showing another of the difficulties that adaptive active vision agents must face.
1
Introduction
The information-processing framework of vision, initiated with Marr’s theory [1], describes attention and vision as processes aimed at building ‘objective’ general-purpose representations of the environment that can be used to guide �
This research was funded by the European Projects HUMANOBS – Humanoids that Learn Socio-Communicative Skills through Observation, contract no FP7-ICTSTREP-231453, and IM-CLeVeR – Intrinsically Motivated Cumulative Learning Versatile Robots, contract no FP7-ICT-IP-231722.
S. Doncieux et al. (Eds.): SAB 2010, LNAI 6226, pp. 199–210, 2010. c Springer-Verlag Berlin Heidelberg 2010 �
200
D. Ognibene, G. Pezzulo, and G. Baldassare
any relevant perceptual process and action [2]. This approach has a strong limit in that building representations totally detached from the specific needs of the system produces scene representations with an overwhelming amount of nonneeded information. The active vision approach [3] proposes instead to use a perceptual system with a highly-sensitive fovea to explore the environment and extract only the information needed to pursue current goals. This dramatically reduces visual computations as these can be performed only on limited portions of the scene, similarly to what happens in humans [4]. Given this strategy, the difficulty of performing complex reconstruction of the environment is in great part transferred to the difficulty of controlling the gaze in an efficient manner. Experiments on overt visual attention in ecological conditions show that eye-movement patterns are organised on the basis of taskdependent visual routines [5,6]. These are stereotyped sequences of elemental operations related to the accomplishment of specific perceptual or sensorimotor tasks, which involve eye movements and specific processing of foveated scene regions (e.g. contour tracing and location storing). Visual routines are a fundamental concept for active vision as they constitute the means through which visual behaviour actually selects only specific portions of the scenes to perform high cost visual-processing operations. Several behavioural studies, on tasks like face recognition [7] and visuo-motor control [8,9], have shown that human are able to readapt their visual routines for task specific demands. In ecological conditions, learning visual routines is difficult due to: (a) the many dimensions of the visual space; (b) the partial observability caused by the environment properties and by the presence of a fovea and a periphery with a limited perception; (c) the need to pursue goals in changing conditions; (d) the fact that the mechanisms learning to control the eye can make leverage only on indirect rewarding signals, for example related to the effects of manipulation actions and not directly to eye movements. Notwithstanding the importance of visual routines and these difficulties, most studies on active perception and autonomous robotics have not studied the processes of learning and re-adaptation related to them. In this respect, the goal of this work is starting to study in a systematic fashion how visual routines are first learned and then re-adapted when the environment changes. To this purpose, we use a reinforcement-learning bio-inspired embodied model controlling a cameraarm robot (some components of the architecture were presented in [10] and [11]). The system has some features which make it well suited for this study within a bio-inspired active vision context: (a) it assumes a strong coupling between visual and arm control; (b) has a simplified bottom-up attention component and a rather sophisticated top-down attention component; (c) is based on neural maps which allow the formation of distributed quantitative internal representations easily studied in a graphical way. Related studies. Previous studies on adaptive active vision have so far focused the previously mentioned topics in isolation. In [12] an artificial fovea is controlled by an adaptive neural controller. Without a teacher, this learns trajectories causing the fovea to find targets in simple visual scenes and to track moving
An Active-Vision Model Which Learns and Readapts Visual Routines
201
targets. In [13] a model is proposed which integrates bottom-up and top-down attention processes. The system used Q-learning to find objects located in fixed positions in crowded rooms. Although interesting, the model needs hand-made knowledge of the target appearance and learning is specific for objects in one specific context, so it has to be retrained when objects move or scenes change. In [14] a model is proposed to solve active sensing problems under uncertainty. A reinforcement learning algorithm allows it to develop active sensing strategies to decide which uncertainties to reduce. However, in this study the model of the task is known a-priori and motor control is hardwired. In [15,16,17] evolutionary learning techniques are used for developing adaptive active vision systems. These approaches are robust to the perceptual aliasing problem, however they do not allow on-line adaptation to changing environments.
2
The Model
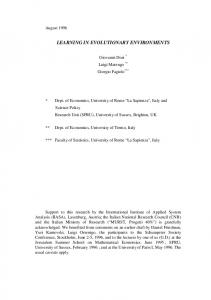
The architecture of the model (Figure 1.a) integrates two components: (a) an attention control component formed by a bottom-up and top-down attention sub-component; (b) an arm control component. These components are based on common bio-inspired computational principles: (a) population codes (here 2D neural maps) used to represent sensorimotor information [18,19]; (b) dynamic neural-field networks used to integrate information and select actions based on neural competitions [20,21]; (c) a progressive development of skills (cf. [11]). We now present an overview of the components and then describe them in detail. The setup used to test the model is a simulated version of a real system presented in [10] (see Figure 1.a), formed by a down-looking camera and a 2-DOFs robotic arm. The arm horizontal working plane is made up by a computer screen where the task stimuli appear. The input image of the model activates a periphery map that implements bottom-up attention. The central part of the input image (fovea) feeds a reinforcement-learning actor-critic component that learns to predict the position of relevant visual elements based on foveated cues (topdown attention). A leaky-neuron potential action map (PAM) integrates in time these predictions. A saliency map sums up the information from the periphery map and the PAM and selects the next eye movement corresponding to the most active neurons (neural competition). Each eye fixation point, encoded in a eye posture map, suggests a potential arm target to an arm posture map which (a) performs the eye posture → arm posture inverse kinematic and (b) implements a second neural competition which triggers reaching movements when the eye fixates the same location for about three consecutive time steps. If the reached target is the correct one (red object), the actor-critic component gets rewarded otherwise it gets slightly punished (as a metaphor of energy consumption). 2.1
Attention Control Components
Periphery Map (Bottom-Up Attention). The input image is a 240 × 320 pixel RGB image. A 30 × 40 gray periphery map pm is extracted from it: first the
202
D. Ognibene, G. Pezzulo, and G. Baldassare eye r.f.
vote map 60×80
body: eye posture
saliency map 60×80
eye r.f. actor eye r.f.
eye posture map 30×40
eye motion
shift
evaluation critic
body r.f.
eye r.f.
Potential Action Map (top-down attention map) 60×80
Bottom-up sal. map 60×80
body r.f. arm posture map 40×40
fovea RGB 2×2
(b)
eye r.f. input image: 480×640
body r.f. arm motor neuron layer 1×4
(c) Camera image = arm working area: 240×320
(a)
Working area of eye: 480×640; central part = CRT screen image; rest of the area = black.
Fig. 1. (a) Eye-arm control architecture. (b) Example of environment from family L, with target (gray = red) on the left, a distractor (dark gray = blue) on the right of a line of 2 to 5 cues (light grey = green). (c) Example of environment from family R, with switched placement of the target and distractor.
input image is divided into 30×40 blocks of 8×8 pixels each, then the RGB color values of the pixels of each block are averaged to obtain a gray value. As objects (uniformly coloured squares) are shown on a black background, the simple gray image is enough to reveal their presence: a more sophisticated bottom-up saliency (e.g. as that of [22]) is not needed for the purposes of this work. Actor-Critic Component (Top-Down Attention) The fovea is composed of a 2 × 2 RGB pixel image (encoded in vector f ) extracted from the centre of the input image. The fovea image is fed into two feedforward neural networks forming a reinforcement-learning actor-critic architecture [23], a biologically plausible model of trial-and-error learning in organisms [24,25]. The critic is a network with a linear output unit vt which learns to evaluate the current state on the basis of the expected future discounted rewards. The system gets a reward rt after the execution of a reaching action, and this, together with vt , is used to compute the surprise signal st (or ‘TD error’, [23]) used to update the critic’s weights (vector wc ) and the actor’s weights (matrix Wa ). The actor is a network whose output layer is a vote map of 60 × 80 sigmoid neurons (encoded in vector vm) which signal to the PAM the possible positions of rewarded targets with respect to the currently foveated visual cue (γ = 0.9; T is the transpose operator): vt = wcT f
st = (rt + γ vt ) − vt−1 a
vm = g [W f ]
g[x] = 1/(1 + e
−x
(1) )
(2)
An Active-Vision Model Which Learns and Readapts Visual Routines
203
The critic is trained on the basis of st , used as error signal, and the input f [23]. The actor is trained with a Hebb rule involving the activation of the saliency map (vector smt ), which encodes the last eye displacement (see below), and the input f , so as to increase or decrease the probability of doing the same saccadic movement again on the basis of the surprise signal st [10] (η c = 10−7 , η a = 10−5 ; • is the entrywise product operator): c = wtc + η c st ft wt+1 a Wt+1
=
Wta
a
+ η st smt • (vmt • (1 −
(3) vmt )) ftT
(4)
Potential Action Map (Top-Down Attention Memory). The PAM is formed by 60 × 80 leaky neurons (vector pam) and accumulates evidence, furnished by the vote map vm via topological connections, on the possible positions of rewarded targets. Importantly, during each saccade the map activation is shifted in the direction opposite to the eye motion to maintain eye-centred representations (as it might happen in real organisms, see [26]). The PAM is reset each time the input image changes (also this might happen in real organisms [27]). Saliency Map. The 60×80 saliency map (encoded in vector sm) selects saccade movements on the basis of the sum of the topological input signals pm and pam. The saccade movement is selected by first identifying the unit with the maximum activation and then by activating the map with a Gaussian population code centred on it (the Gaussian function has a width σ = 1). The eye movement is the average of the winning neurons’ preferred eye displacement (Δx, Δy). This selection mechanism, based on the maximum function, is a computationally fast approximation of a neural dynamic competition process (e.g., cf. [21]). Biology. Empirical evidence indicates that the cortical area of the frontal eye field (FEF) exhibits properties similar to those of the saliency map integrating bottom-up and top-down information to drive overt and covert attention [28]. Another possible location for this integration is the posterior parietal cortex [29]. Bottom-up (pre-attentive) saliency processes take place in a parallel in relation to various aspects of the retina image such as color, orientation, and motion, and the resulting information is then integrated at higher levels such as the FEF and the parietal cortex. These processes are performed with increasing abstraction in the retina, the lateral geniculate nucleus, the visual cortex, and the extrastriate visual cortex. The top down influence on attention control mainly originates from prefrontal cortex based on the subject’s goals and motivations and the environment context. One type of top-down influence reaching FEF neurons is related to a template of the target to which attention must be allocated. Other type is related to the spatial relationship between objects that human can acquire even unconsciously as shown in experiment on contextual cueing [30]. This kind of knowledge might be encoded in the hippocampal system. Neurobiologial data on how and where saliency maps can be implemented in the brain can be found in [31,32,29]. The trial-and-error learning processes performed by the model might correspond to the processes taking place in the portions of the basal ganglia dedicated to the control of the eye (striatum and substantia nigra pars reticulata [33]).
204
2.2
D. Ognibene, G. Pezzulo, and G. Baldassare
Arm Control Components
As the paper is focussed on attention processes, we now illustrate the main aspects of the arm control components and refer the reader to [11] for details. Eye Posture Map. This 30 × 40 neuron map encodes the current eye posture as a Gaussian population code (encoded in vector emp; σ = 0.3). Arm Posture Map. This is a 40 × 40 map (vector apm) which represents the output layer of a neural network whose weights (Wapmk ) are pre-trained with a Kohonen algorithm to encode the arm postures in a 2D space. During tests, a neural neural competition [21] takes place in the map (similarly to what happens in real organisms [20]), selects a target for reaching actions, and triggers them when any neuron achieves a certain threshold. Arm Posture Readout Layer. This is a layer of four sigmoid neurons (vector aprl) that encode the desired arm joint angles issued to the arm simulated servos. The map is activated by the arm posture map through connection weights encoded in the matrix Waprl . Training. The arm components were trained before the experiments illustrated in Section 3. This pre-training is divided in three succeeding learning phases based on random movements of the arm (motor babbling). In these phases the system: (a) performs a vector quantization of postures within the arm posture map on the basis of the Kohonen algorithm; (b) learns with a delta rule the inverse kinematic mapping (Wapm ) between the gaze direction corresponding to the seen hand (epm) and the corresponding arm posture encoded by the Kohonen map (apm) on the basis of Wapmk ; (c) trains the arm posture readout map (Waprl ) with a delta rule.
3
Experimental Setup
In a previous work we showed that the system was able to learn in few trials to interact with several environments sharing an underling structure, like an simplified tree where the target was an apple always under the foliages. To test how the architecture behaves when exposed to environments based on contrasting rules a task was designed where the environment was randomly selected from one of 2 ‘families’ of environments in every trial. We wanted also to study what could happen when the system has to update its knowledge to tackle a new context for which it is good but not optimal. To test this, the two families were presented with unbalanced frequencies and then these frequencies were switched. The objects of both families of environments were uniformly-coloured red/ green/blue rectangles with width 2.96cm and height 2.94cm and were placed on the vertexes of a 5×6 grid spaced 5.2cm and 3.8cm apart. In the family L (which stands for ‘Left’), used in 75% of trials, the red target was on the left of a ‘line’ formed by 2 to 5 green cues (randomly positioned on one of the 2nd, 3rd, 4th or 5th column of vertexes). A blue distractor was set on the right side of the cue line (see Figure 1.b). In the family R (‘Right’), presented in 25% of trials, the placement of the target and distractor was switched with respect to the cue line (see Figure 1.c). The attentional system was first trained for 60,000 steps in this
An Active-Vision Model Which Learns and Readapts Visual Routines
205
condition, and then for further 60,000 steps with the frequency of presentation of environments of family L and R switched to respectively 75% and 25%.
4
Results
Figure 2.a shows the average reward during learning, measured for the two different families of environments separately. The performance with L environments increases quickly and then reaches a stable steady state whereas for R environments increases slower and shows oscillations. Figure 2.b shows the evolution of the average number of saccades per trial during learning divided for the two different families of environments. Learning time looks similar for the two families with some advantages for L, but R shows oscillations. The final average number of saccades is 5.86 for L and 7.08 for R. Both plots reach a steady level, so the final different number of saccades with L in comparison to R (approximately one saccade less on average) does not reflect a different level of skill but rather a different strategy. In this respect, the analysis of the behaviour of the system shows that it learns an exploration policy that initially assumes to tackle an environment from family L. In the presence of an environment from family R this assumption fails, and the system looks directly on the other side of the array rather than exploring the cues again. This strategy allows the system to solve the task with only one additional step. Figure 3 presents an analysis of visual routines. In particular, Figure 3.a shows the most frequent sequences (during learning) of the first three ‘eye actions’ (saccade towards left, saccade towards right, saccade on the current object column) per trial. Figure 3.c shows the evolution of the frequencies of the same sequences during learning. The most frequent action sequence is ‘left, stay, stay’, and is the sequence the model uses when exposed to environments of family L. The second most frequent sequence is ‘stay, stay, stay’. This sequence is the most selected in the first trials, when the system oscillates between cues, whereas its frequency
(a)
(b)
Fig. 2. (a) Average reward of the system (y-axis) during learning (x-axis) measured separately for the two families of environments. Using a moving window of 100 trials, the trials inside the window were separated in two groups corresponding to the two families and the total reward taken for each group was divided by the number of trials in each group. (b) Average number of saccades per trial (y-axis) during learning (x-axis) measured separately for the two families of environments.
206
D. Ognibene, G. Pezzulo, and G. Baldassare
(a)
(b)
(c)
Fig. 3. (a,b) Different eye-action sequences (segmented histogram bars: only three actions per sequence are considered) with the ten highest frequencies (gray bars) exhibited by the system during learning. For each sequence, the colours of the bars represent three different possible eye-actions: saccades towards left (gray), towards right (white), and on the current column (black). Note that the first action of each new trial/scene was removed when the agent gazed the background, and kept when it gazed an object, as the first action depended on the random starting position of the eye. (c) Evolution of eye movement sequences during learning. The plots are sorted by the max frequency they had during learning. Only the first five sequences are shown.
lowers as soon as the system learns to inhibit the entire column of cues, and is then used only when the system reaches the target to trigger the arm movement. The third most frequent sequence, ‘left, right, stay’, has the same first action of the most frequent sequence but then takes the gaze back to the right and then stops: this is the sequence used by the system to solve an environment of family R. This sequence is the last to be learnt, and together with the first and second sequences covers about 90% of all sequences. Overall, this strategy shows that the system initially acts as if it were in an L environment, and when it collects information contrary to this assumption it goes straight from the distractor to the target. The other sequences reach a relatively high frequency after the system learns to inhibit the column of cues, and the system has not yet discovered the relationship between the cues and the target, but then they get a rather low frequency after the system has learned the whole strategy. This policy, acquired by the model to tackle the two environment families is not a composition of the two policies which the system acquires to tackle each family separately. In fact, if a simulation is run with only one of the two families, the family L and the family R lead to the use of respectively the first sequence of Figure 3.a and the first sequence of Figure 3.b with a frequency, in each case, of about 90%. The internal representations of stimuli acquired by the system are not a simple combination of the representations of the strategies for the two families of environments. Figures 4.a,b show the activation patterns of the vote map when the system foveates a cue or a distractor after it has been trained with environments chosen from families L and R with a frequency of respectively 75% and 25%. Figures 4.c,d show the activation patterns of the vote map after the system has been trained with environments drawn from only family L (the patterns after
An Active-Vision Model Which Learns and Readapts Visual Routines
(a)Cue
(c)Cue
(e)Cue
(g)Cue
(b)Distractor
(d)Distractor
(f)Distractor
(h)Distractor
207
Fig. 4. (a,b) Vote map activation patterns in correspondence to a cue or a distractor after 60,000 training steps with environments of both families. (c,d) Vote map activation patterns in correspondence to a cue or a distractor after 60,000 training steps with environments of family L. (e,f) Vote map activation patterns in correspondence to a cue or a distractor after 10,000 training steps with environments of both families. (g,h) Vote maps on the stimuli of the model after 60,000 training step when exposed to both families of environments after changing frequency of family L to 25% and frequency of family R to 75%.
training with only family R have a mirror structure with respect to the vertical axis). Figures 4.a,b show that the patterns developed with both families is not a combination of the maps obtained with the separate training with each family as such combination would have been something like an average of topologically corresponding locations of the patterns related to the two families learned singularly. Rather, it contains features which allow the system to express the visual routines described above. This is shown especially by the activation pattern related to the distractor when the system is trained with only a family. In such pattern, contrary to what happens with the training with both families, there is no coding for the position of the target but rather for a movement back to the cue. The structure of the vote-map activation patterns can also help clarifying the oscillations of performance observed with family R and shown in Figure 2.a. Considering the vote map activation patterns built in the first learning phase (Figure 4.e,f), the final vote map activation patterns (Figure 4.a,b), and the vote map activation patterns developed when the system is exposed only to one family (Figure 4.c,d), it is apparent that the most frequent task interferes with the exploration of the less frequent one during learning (see also Figure 2.b). 4.1
Readapting to New Environment Statistics
After 60,000 steps of training with the families L and R at respectively 75% and 25%, the two frequencies were switched. As we have seen, at this point the
208
D. Ognibene, G. Pezzulo, and G. Baldassare
(a)
(b)
(c)
Fig. 5. (a) Average reward during learning after changing the frequency of family L and R to respectively 25% and 75%. (b) Average number of saccades during learning after changing the frequency of family L and R to respectively 25% and 75%. (c) Frequencies of the five most frequent saccade sequences (first 3 saccades per trial) during learning, after changing the frequency of family L and R to respectively 25% and 75%.
system has already stabilised on its maximum level of performance. Switching the frequencies of the two tasks does not substantially affect the performance, as shown in Figure 5.a. The performance with family L has some decrease whereas the performance with family R has a little increment, but after a transient phase performance with both families is again at about the same maximum level and the performance oscillations with family R are even reduced. Interestingly, Figure 5.b shows that after about 2,000 trials the system becomes faster in solving the tasks of family R than those of family L, so following the switch in frequency of the two families. The nature of this policy shift is revealed by Figure 5.c. This indicates that after switching the former most frequent sequence, ‘left, stay, stay’, progressively decreases to a very low level. The optimal policy for family R, ‘right, stay, stay’, steadily increases until becomes the new most frequent sequence. The sequence ‘right, left, stay’ appears slowly: this is the ‘back-up’ sequence for the new infrequent environments of family L which allows going directly to the target after finding the distractor. The re-adaptation of the policy is quite slow because the difference in performance is rather stable after the shift, and this implies a small error signal for the actor. In particular, right after the shift the distractor (now encountered often) is a predictor of the target, so the value that the critic assigns to it is close to that of the target and the corresponding error is low. Moreover, when the switch takes place the connection weights are already rather high but often with a sign opposite to the required one (compare Figure 4.a,b and Figure 4.g,h).
An Active-Vision Model Which Learns and Readapts Visual Routines
5
209
Conclusions
This work used a bio-inspired reinforcement-learning model for controlling an eye-arm system to study learning and readaptation of visual routines. The model was tested with two contrasting tasks which posed aliasing problems and were presented with different frequencies. The model solved the two tasks by developing visual routines dependent on both on the structure and frequency of the tasks. The analysis of the internal representations revealed how the system organised to support such visual routines. Interestingly, the system starts exploring the environment on the basis of the expectation of tackling the most frequent task. If evidence is collected against this expectation, the system changes it and solves the less frequent task with only one additional saccade. The analysis of representations also indicates that the system has learned the spatial (stochastic) relationships between the elements of the objects useful for finding the taskdependent information within the scene. When after learning the frequency of presentation of the environments is switched the performance of the system does not substantially decrease thanks to the re-use of the previously acquired visual routines, then slowly improved on the basis of the reward feedback. Overall, the study shows that when active vision systems have learning capabilities the discovery and re-adaptation of visual routines generates a number of very interesting phenomena such as the ability to tackle several environments at the same time, and the dependency of the optimal visual exploration policy on the statistical properties of the environment.
References 1. Marr, D.: Vision: A Computational Investigation into the Human Representation and Processing of Visual Information. Freeman, New York (1982) 2. Fermuller, C., Aloimonos, Y.: Vision and action. Image Vision Comput. 13(10), 725–744 (1995) 3. Ballard, D.: Animate vision. AI 48, 57–86 (1991) 4. Treisman, A.M., Gelade, G.: A feature-integration theory of attention. Cognit. Psychol. 12(1), 97–136 (1980) 5. Ullman, S.: Visual routines. Cognition 18(1-3), 97–159 (1984) 6. Hayhoe, M.: Vision using routines: A functional account of vision. Visual Cognition 7(1-2-3), 43–64 (2000) 7. Heisz, J.J., Shore, D.I.: More efficient scanning for familiar faces. J. Vis. 8(1), 1–10 (2008) 8. Sailer, U., Flanagan, J.R., Johansson, R.S.: Eye-hand coordination during learning of a novel visuomotor task. J. Neurosci. 25(39), 8833–8842 (2005) 9. Land, M.F.: Eye movements and the control of actions in everyday life. Prog. Retin. Eye Res. 25(3), 296–324 (2006) 10. Ognibene, D., Balkenius, C., Baldassarre, G.: Integrating epistemic action (active vision) and pragmatic action (reaching): A neural architecture for camera-arm robots. In: Asada, M., Hallam, J.C.T., Meyer, J.-A., Tani, J. (eds.) SAB 2008. LNCS (LNAI), vol. 5040, pp. 220–229. Springer, Heidelberg (2008)
210
D. Ognibene, G. Pezzulo, and G. Baldassare
11. Ognibene, D., Rega, A., Baldassarre, G.: A model of reaching that integrates reinforcement learning and population encoding of postures. In: Nolfi, S., Baldassarre, G., Calabretta, R., Hallam, J., Marocco, D., Meyer, J.-A., Miglino, O., Parisi, D. (eds.) From Animals to Animats 9: Proceedings of the Ninth International Conference on the Simulation of Adaptive Behavior (SAB 2006), September 2006, pp. 381–393. Springer, Heidelberg (2006) 12. Schmidhuber, J., Huber, R.: Learning to generate artificial fovea trajectories for target detection. Int. J. Neural Syst. 2(1-2), 135–141 (1991) 13. Minut, S., Mahadevan, S.: A reinforcement learning model of selective visual attention. In: AGENTS 2001: Proceedings of the Fifth International Conference on Autonomous Agents, pp. 457–464. ACM, New York (2001) 14. Kwok, C., Fox, D.: Reinforcement learning for sensing strategies. In: IEEE/RSJ International Conference on Intelligent Robots and Systems, IROS 2004 (2004) 15. de Croon, G.: Adaptive Active Vision. PhD thesis, Universiteit Maastricht (2008) 16. Suzuki, M., Floreano, D.: Enactive robot vision. Adapt. Behav. 16(2-3), 122–128 (2008) 17. Mirolli, M., Ferrauto, T., Nolfi, S.: Categorisation through evidence accumulation in an active vision system. Connection Science (subm) 18. Pouget, A., Ducom, J.C., Torri, J., Bavelier, D.: Multisensory spatial representations in eye-centered coordinates for reaching. Cognition 83(1), B1–B11 (2002) 19. Pouget, A., Zhang, K., Deneve, S., Latham, P.E.: Statistically efficient estimation using population coding. Neural Comput. 10(2), 373–401 (1998) 20. Cisek, P.: Integrated neural processes for defining potential actions and deciding between them: a computational model. J. Neurosci. 26, 9761–9770 (2006) 21. Erlhagen, W., Sch¨ oner, G.: Dynamic field theory of movement preparation. Psychol. Rev. 109(3), 545–572 (2002) 22. Itti, L., Koch, C.: Feature combination strategies for saliency-based visual attention systems. Journal of Electronic Imaging 10(1), 161–169 (2001) 23. Sutton, R., Barto, A.: Reinforcement Learning: An Introduction. MIT Press, Cambridge (1998) 24. Houk, J., Adams, J., Barto, A.: A model of how the basal ganglia generate and use neural signals that predict reinforcement, pp. 249–270 (1995) 25. Mannella, F., Baldassarre, G.: A neural-network reinforcement-learning model of domestic chicks that learn to localise the centre of closed arenas. Phil. Trans. R. Soc. B 362(383-401), 333–356 (2007) 26. Dominey, P.F., Arbib, M.A.: A cortico-subcortical model for generation of spatially accurate sequential saccades. Cereb. Cortex. 2(2), 153–175 (1992) 27. Klein: Inhibition of return. Trends Cogn. Sci. 4(4), 138–147 (2000) 28. Thompson, K.G., Bichot, N.P.: A visual salience map in the primate frontal eye field. Prog. Brain Res. 147, 251–262 (2005) 29. Treue, S.: Visual attention: the where, what, how and why of saliency. Curr. Opin. Neurobiol. 13(4), 428–432 (2003) 30. Chun: Contextual cueing of visual attention. Trends Cogn. Sci. 4(5), 170–178 (2000) 31. Silver, M.A., Kastner, S.: Topographic maps in human frontal and parietal cortex. Trends Cogn. Sci. 13(11), 488–495 (2009) 32. Cutsuridis, V.: A cognitive model of saliency, attention, and picture scanning. Cognitive Computation 1, 292–299 (2009) 33. Hikosaka, O., Takikawa, Y., Kawagoe, R.: Role of the basal ganglia in the control of purposive saccadic eye movements. Physiol. Rev. 80(3), 953–978 (2000)