Learning with Multiple Representations Supporting students’ translation between representations in a simulation-based learning environment Paper presented at the EARLI conference 2003, Padua, Italy, August 26th
Jan van der Meij and Ton de Jong University of Twente Faculty of Educational Science Department of Instructional Technology
[email protected],
[email protected]
1. Abstract This paper reports a study which examined support the translation between multiple representations in simulation-based learning. We compared three versions of the same simulation-based learning environment: a learning environment with separated representations (control condition), a learning environment with dynamically linked representations, and a learning environment with integrated representations. Ninety learners from four middle vocational training schools (aged 16 to 18) took a pretest on an applied physics domain called ‘moment’, worked with a simulation-based learning environment on the domain, and took a posttest. Subjects were randomly assigned to one of the three experimental conditions. Subjects received an electronic questionnaire five times while working with the learning environment. This questionnaire asked subjects to score their experienced difficulty. The results of this study did not lead to significant results between conditions and thus does not lead to insights into the benefits or drawbacks of a particular measure to support translation. Insights into how the design of the learning environments may have influenced these results as well as research designs are discussed. Implications for future research will also be addressed.
2. Introduction Almost every learning environment offers multiple representations. In textbooks photographic images are used in illustration of texts, and explanatory drawings and diagrams give texts significance. In early computer based learning environments texts and images were applied in the same way as in textbooks. Research done on representations in textbooks was also valid for these early computer based learning environments. Representations, however, were static. In modern, computer-based learning environments a variety of dynamic representations are available, such as: audio, video, animations, and dynamically changing graphs and tables. The dynamic information changes over time, as influenced by varying values of parameters. This gives developers opportunities to link multiple representations within one learning environment in a dynamic way. In practice, scientists coordinate features within and across multiple representations in order to reason about their research and negotiate shared understanding based on underlying entities and process. Students, on the other hand, have difficulty moving across or connecting multiple representations, so their understanding and discourse are constrained by the surface features of individual representations (Kozma, 2003). An environment using multiple linked representations can facilitate novices’ learning even if their understanding of symbolic expressions (i.e., instructional material) draws heavily on an incomplete or inaccurate knowledge of the domain (Kozma, Russell, Jones, Marx, & Davis, 1996). These representations have to be referentially linked in such a way that, when working with the
representations, novices elaborate on their initial understanding to include the conceptual entities and symbolic expressions used by experts. Research with multi-representational learning environments has revealed that learning with multiple representations can lead to deeper understanding but that it can be a demanding process if the environments are not carefully designed (Ainsworth, Wood, & Bibby, 1997; De Jong et al., 1998). In a multi-representational learning environment the learner has to understand the semantics of each representation, has to understand which parts of the domain are represented, has to relate the representations to each other if the representations are (partially) redundant, and has to translate between the representations. One of the main problems learners have with using multiple representations is translating between representations with different modalities (Ainsworth, 1999). This paper seeks to contribute to resent research efforts on the use of multiple representations. It especially seeks to answer how relationships between multiple representations can be shown to learners, and, how to facilitate learners’ translation between the representations. The context in which this study was conduced is a simulation-based learning environment called Moment. Moment was built in the authoring environment SimQuest and is based on discovery learning (see de Jong & van Joolingen, 1998). In discovery based simulation learning environments, learners learn the concepts of the domain which are modelled by a simulation. The goal of the learning environment is for learners to understand the relations between the variables in the simulation model. They explore the simulation model by manipulating values of the variables and observing the outcomes of their actions. By understanding the relations of the variables in the model it is expected that learners acquire a deeper understanding of the domain and are able to transfer their knowledge to similar ‘problems’ in other (real) situations.
2.1 Benefits of multiple representations Many advantages are claimed for multi-representational learning environments. By using multiple representations it is hoped that learners benefit from the properties of each representation and that ultimately this will lead to a deeper understanding of the subject being taught (Labeke & Ainsworth, 2001). Based on a functional taxonomy of multiple representations by Ainsworth (1999), Seufert (2003) distinguishes three functions that multiple representations can serve for learning. First, multiple representations may complement each other with regard to their content. By combining representations that complement each other it is foreseen that learners will benefit from the sum of their advantages. For example, each representation could show different aspects of the domain. Second, multiple representations can complement each other with regard to their representational and computational efficiency. Different types of representations may be useful for different purposes (Larkin & Simon, 1987). If the context of a problem has to be represented the best representations to use are text or pictures. Other representations like graphs or tables are less useful for this type of information. If qualitative information has to be shown, diagrams are the best representations. Diagrams can hold information that supports computational processes by indexing of information (Larkin & Simon, 1987). For showing quantitative information diagrams are less useful; graphs, formulas, and alphanumeric representations are better representations for this type of content. Graphs show trends and interaction more successfully than alphanumeric representations. An example is the distinction between an equation like ‘y=x2+2x+5’ and an informationally equivalent graph. The equation fails to make explicit the variation, which is evident in the graph. According to Cox and Brna (1995) the cognitive effects of graphical (external) representations are to reduce search and working memory load by organising information by location. For example, tables make information explicit and can direct attention to unsolved parts of a problem (e.g., empty cells of a tabular representation). A third function of multiple representations is that one representation can constrain the interpretation of another representation. An animation, for example, can constrain the interpretation of a graph. There is a strong tendency among
Van der Meij & De Jong, Learning with multiple representations, EARLI 2003
2
learners to view graphs as pictures rather than as symbolic representations (Mokros & Tinker, 1987; Kaput, 1989). When the animation shows a car riding up a hill with constant power, it constrains the interpretation of the speed shown in a line graph. The animation can show learners that the line graph is not representing a valley but the speed of the car; they can see that the car slows down going up the hill and that it accelerates going down the hill. In the SkaterWorld learning environment (Pheasley, O’Malley, & Ding, 1997) an animation of a skater is intended to constrain the interpretation of other more abstract and unfamiliar representations like tickertape, force arrows, tables of velocity, and time elapsed. The purpose of the constraining representation is not to provide new information but to support the learners’ reasoning about the less familiar representation (Ainsworth, 1999).
2.2 Costs of multiple representations When learning with multiple representations, learners are faced with four tasks. First, they have to understand the semantics of each representation. They must learn the format and operators of the representations. For example, the format of a graph would include attributes such as lines, labels, and axes. Examples of graph operators are finding the gradients of lines, minima and maxima, and intercepts. Second, learners have to understand which parts of the domain are represented. In a graph, for example, learners have to learn when it is appropriate to examine the slope of a line, the height, and/or the area under the line. In addition, the operators of one representation are often used inappropriately to interpret a different representation. This results in common mistakes such as viewing a graph as a picture (see Mokros & Tinker, 1987). Third learners have to relate the representations to each other if the representations are (partially) redundant. They have to connect the surface features of the representations. When a numerical representation and a graph have to be related, learners must find the corresponding variables. Fourth, learners have to translate between the representations. A number of studies have reported problems that novices have in learning to translate between representations. Tabachneck, Leonardo, and Simon (1994) reported that novices, learning with multiple representations in economics, did not attempt to integrate information between line graphs and written information. This result was found for graph generation and graph interpretation. Experts, in contrast, tied graphical and verbal representations closely together. Similar results were reported by Kozma (2003). In his article Kozma reviewed experimental and naturalistic studies conducted by SRI International which examined the role of multiple representations in understanding science. He looked at the differences between expert chemists and chemistry students in their representational skills and in their use of representations in science laboratories. He described the way scientists used the material features of multiple representations to support their shared understanding and laboratory practices and contrasted this with the way students used representations. Scientists coordinated features within and across multiple representations to reason about their research and negotiated shared understanding based on underlying entities and processes. Students, on the other hand, had difficulty moving across or connecting multiple representations.
2.3 Guidelines There is little research give guidelines for the design of multi-representational learning environments. However a review of the following studies provides insights for this study. According to Ainsworth (1999) it is the role of translation between representations which influences the fit between the design and the learning objective(s). When multiple representations are used to support complementary roles and information, the learning environment should automatically perform translation between the representations if translation is necessary for learning the domain. This frees the learner from trying to perform this task, which might tax working memory. Alternatively, it may be appropriate to present the representations sequentially to discourage attempts at coordination if translation between the representations is not necessary to learn the domain (e.g., when aspects of a domain can be learned separately from others). When multiple representations are used to constrain interpretation the relations between representations should be made very explicit. This could Van der Meij & De Jong, Learning with multiple representations, EARLI 2003
3
be achieved either by automatic translation or dynamic linking. If neither representation is used for these actions, the relations between the representations should be made explicit by visual cues, such as like highlighting correspondent components. If learners are required to link the representations themselves, representations that are easily coordinated should be selected. These are representations with more or less the same modalities (Ainsworth et al., 1998). Van Labeke and Ainsworth (2002) implemented these design principles in the DEMIST learning environment. Kozma (2003) suggests three design principles that could increase connections made between representations and which support student domain understanding: (1) provide at least one representational system that has features that explicitly correspond to the entities and processes that underlie the physical phenomena being taught, (2) have students use multiple, linked representations in the context of collaborative, authentic, laboratory experiments, (3) engage students in collaborative activities in which they generate representations and coordinate the features of representations to confirm and explain the findings of their investigations. They implemented these design principles in one of their early learning environments called 4M:Chem. 4M:Chem uses four different but coordinated symbolic spaces to represent chemical phenomena that students is investigate. These consist of a chemical equation, a dynamic real-time graph, a molecular animation, and a video of a web lab experiment. Color and dynamic linking was used to link the representations. In a pilot study Kozma (2000) looked at the material and social affordances of the environment. Students worked in pairs on simulated experiments and were guided by a manual which asked them to make predictions, record observations, give explanations, and draw conclusions. If students disagreed, they were instructed to try and convince each other of their position, using whatever evidence was available. The pilot study showed how a pair of students engaged in extended discourse to construct shared meaning from observed surface features across multiple representations. They both achieved a scientific understanding of the entities and processes that underlie a scientific phenomenon and they replicated the discourse practices of scientists. The cognitive demand unique to learning with multiple representations is to understand how to translate between representations. To make learning with multiple representations successful learners have to be supported in this translation. In our study we adopted three of the functions described by Ainsworth: complementary roles, complementary information, and constrain interpretation. Additionally, according to Ainsworth, the construction of deeper knowledge is one of the functions of learning with multiple representations. We believe that learning with multiple representations can lead to deeper knowledge, but don’t agree that this is a function of multiple representations. Except for the collaborative aspect, we also adopted the design principles suggested by Kozma (2003).
2.4 Types of support Two types of support for translating relationships between representations are examined in this study: dynamic linking between representations and integration of representations. 2.4.1 Dynamic linking One way to make the relation between different representations explicit for the learner is dynamic linking. When the learner acts on one representation the results of this action is automatically shown in all other representations. If a learner for example changes the value of a force in a numerical representation, the corresponding representation of the force in an animation is updated automatically. It is expected that dynamic linking decreases cognitive load by freeing learners from having to establish the relationships between the representations (e.g., Kaput, 1992; Scaife & Rogers, 1996). However, Ainsworth (1999) writes that a constructivist approach to education might argue that dynamic linking leaves a learner too passive in the process. Dynamic linking may discourage reflection on the nature of the Van der Meij & De Jong, Learning with multiple representations, EARLI 2003
4
translations leading to a concomitant failure by the learner to construct the required understanding (p. 133). Ainsworth argues that we need to understand more about the conditions under which multi-representational learning environments should be designed to support cross-representational translation. 2.4.2 Integrating Cognitive load theory (see Sweller, 1988, 1989) suggests that effective materials facilitate learning by directing cognitive resources toward activities that are relevant to learning rather than toward preliminaries to learning. Ineffective instruction may occur if learners are unnecessarily required to mentally integrate disparate sources of mutually referring information such as separate text and diagrams. Such split-source information may generate a heavy cognitive load, because material must be mentally integrated before learning can commence. For multi-representational learning environment split-attention effects (Chandler & Sweller, 1991) should be considered. In a multi-representational learning environment information is varied over different representations and learners have to relate the representations and translate between them. Designers of these environments should consider if it is necessary to split information over different representations. Chandler and Sweller (1991) suggest that sometimes it is better to integrate different sources of information. By physically integrating information the cognitive effort required to mentally integrate disparate sources of information can be reduced or eliminated. However, it is not always useful to integrate different sources of information, especially when the learning goal is that learners have to find relations between different representations (see Ainsworth, 1999). Additionally, Chandler and Sweller (1991) found that physical integration is important only where the disparate sources of information are unintelligible unless integrated. If it is not necessary to integrate sources of information to understand them, a redundant source of information may need to be removed.
3. Research question and hypotheses The goal of this study was to determine if different ways of relating basically the same representations in three learning environments has a different effect on learning. More specifically the research questions were: 1. What is the effect of dynamic linking? - Does dynamic linking lead to better learning outcomes than non-linking? 2. What is the effect of integrating? - Does integrating help learners more than (linking) separated representations? 3. Is there an interaction effect with the complexity of the learning environment? 4. Is there a differential effect on domain, transfer and representational knowledge? To answer these questions, three versions of the same simulation-based learning environment were compared: a learning environment with separated representations (control condition), a learning environment with dynamically linked representations, and a learning environment with integrated representations. All learning environments contained the same content. The information provided by the representations was the same for all conditions, but the way it was presented differed. In the separated and linked environments the representations were presented separately. The representations in the separated learning environment were not linked. Changing variables in one representation did not lead to changes in the other representations. All representations were standalone representations of the same domain. Subjects needed to make links between the representations themselves. Changing variables in one representation in the linked learning environment led to a change in the other representations as well. In the integrated learning environment the representations were
Van der Meij & De Jong, Learning with multiple representations, EARLI 2003
5
integrated1 as much as possible. Example screenshots of the three learning environments can be found in Appendix A. We expected that dynamic linking would support students in translating between the representations. We expected that linking would help students to recognize variables in unfamiliar representations from examining the same variables in familiar representations and more easily connect the representations not only to the domain but also to each other. Dynamic linking would free the learners from mentally relating the representations. Therefore, we expected to find a learning effect for the dynamically linked learning environment condition compared with the separated learning environment condition. We expected a larger effect with increasing complexity of the learning environment and test items. We expected that the learning environment with integrated representations would lead to the best learning results as long as the integrated representations were not too complex for the learners. In the integrated condition there was no need to translate between most of the representations. But, because integration of representations means that all representations are represented in the same place, the representation could become too complex when the domain has many variables. In this case the advantage of placing the elements close to each other could become a disadvantage.
4. Method 4.1 Subjects One-hundred-twenty-eight Dutch learners from four middle vocational training schools participated in the experiment; 21 learners from ROC Nijmegen, 22 from ROC Ede, 54 from ROC Utrecht, and 31 from ROC Twente+. The age of the experimental group was between 16 and 18 years old. The subjects all followed a course in mechanical engineering. One-hundredtwenty-six subjects did the pretest. Ninety-two subjects worked with the learning environment and did the posttest; 2 of them did not do the pretest. Table 1 shows participation rates of the subjects who took the tests. Table 1. Participation in tests Participation in tests Pretest
Posttest
Pretest and posttest
126
92
90
Number of subjects
Table 2. Distribution of subjects per condition School ROC Nijmegen (m/f) 6 (6/0)
ROC A12 Ede (m/f) 6 (6/0)
ROC Utrecht (m/f) 9 (6/2)
ROC Twente+ (m/f) 9 (9/0)
Linked
7 (7/0)
6 (6/0)
9 (6/3)
8 (9/0)
30 (27/3)
Integrated
6 (6/0)
5 (5/0)
12 (8/4)
8 (8/0)
31 (27/4)
19 (19/0)
17 (17/0)
29 (20/9)
25 (25/0)
90 (81/9)
Condition Separated
Column total m = male, f = female
Row total (m/f) 29 (27/2)
1
Not all representations were integrated. Integration of the animations and graphs was not possible. Van der Meij & De Jong, Learning with multiple representations, EARLI 2003
6
This paper reports analyses done with the 90 subjects who participated in all parts of the experiment (pretest, working with the learning environment, and posttest). Subjects were randomly assigned over the three experimental conditions. Error! Not a valid bookmark self-reference. shows how the subjects were distributed over conditions.
4.2 Materials 4.2.1 Computers The experiments were held in computer classrooms with IBM compatible Pentium III 450 MHz processor and 256 MB RAM computers. During the experiments, all subject actions with the computer program were logged automatically. 4.2.2 SimQuest learning environment Moment Subjects worked with the SimQuest learning environment Moment. Moment is a learning environment built in the authoring environment SimQuest (de Jong & van Joolingen, 1998). Learners studied the behaviour of moments in mechanical engineering. The learning environment is based on guided discovery learning (De Jong, 1996) since the learning environment contains models that are not directly visible for the learner, the learner has to engage in discovery activities in order to learn about the properties of this model, and the learner is guided in the discovery process in the form of ‘cognitive tools’ like model progression, assignments, and explanations. The goal of the learning environment is that learners understand the models underlying the simulations. They explore these models by manipulating (input) variables of the models and observing the behaviour of other (output) variables in a simulation window. The types of assignments used are: Open Answer assignments, investigation assignments, and optimisation assignments. Open Answer assignments are used to stimulate the learner to perform a specific action in the simulation window without specific guidance. They provide context information and encourage the learner to freely explore the simulation and write down their findings during exploration. Investigation assignments ask the learner to explore a specific part of the learning environment. These assignments give two or more variables between which the learner should find a relation. While completing the assignment, the learner is free to perform experiments. The learner selects the relation he thinks is correct from a list of alternatives. Feedback is given on the alternative(s) chosen. In optimisation assignments the goal is for the learner to reach a predefined state in the simulation. In these assignments the learner is informed about the target state that should be reached (values of variables) and constraints that may not be broken in the process (values of other variables or time). In the Moment learning environment learners explore the behavior of moment in two situations: moment on a bolt caused by a force on an open-end spanner, and moment on a hoisting crane caused by a load. The learning environment has three progression levels. In progression level one, learners explore moment caused by force and length by investigating the behavior of moment on a bolt caused by a force on an open-end spanner. They do this in a qualitative way guided by seven assignments. In progression level two learners explore the same simulation in a quantitative way in three stages. In stage one the simulation interface does not contain graphs, in stage two graphs are introduced, and in stage three a second force is introduced. Level two contains 16 assignments. In progression level three learners explore moment caused by force, length and height by investigating moment on a hoisting crane caused by a load. Level three contains seven assignments which support the exploration of one simulation. Figure 1 shows an example of one of the assignments in level three.
Van der Meij & De Jong, Learning with multiple representations, EARLI 2003
7
Assignment
Answer alternatives Simulation window
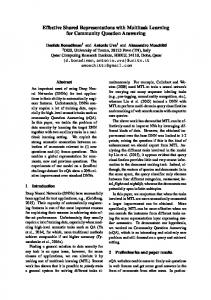
Figure 1. Example of Moment assignment (integrated representations) Learners start exploring a specific aspect of the domain by choosing an assignment from the menu. When opening an assignment a corresponding simulation window opens. Each assignment starts with a short description of an aspect of the domain, asks the learner to explore this aspect, and asks the learner to answer a question about it. The domain is shown from different perspectives through four types of representations: a context representation, an abstract representation, a numerical representation, and two graphs. An example of one of the simulation windows is shown in Figure 2. Diagrammatic representation Numerical representation
Context representation
Graph
Graph
Figure 2. Example of simulation window (separated representations) Van der Meij & De Jong, Learning with multiple representations, EARLI 2003
8
The way the representations are presented differs between the three experimental conditions (see Paragraph 3). The context representation shows the physics system under study; an open-end spanner with a hand tightening a bold. This shows the domain in a way it would appear in a real-world context. This representation can be used into constrain the interpretation of the other representations. Students can manipulate the context representation by dragging the slider which corresponds to the position of the hand. As the context representation does not show all variables of the simulation model it is not informationally equivalent to the other representations. The other representations show all variables of the simulation model. The diagrammatic representation shows the domain as it is usually presented in textbooks. Diagrammatic representations are important representations when reasoning about a domain. By simplifying the representation to a line drawing, learners can concentrate on the mean features of the representation. Learners can manipulate the arm (line) and force (arrow) and observe their effect on the moment (bended arrow). Arm, force, and moment are all represented using different colors, which we used consequently in the simulation. Green is used for arm, red is used for force, and blue is used for moment. By using color references, learners can map the variables in the representations. It is expected that learners develop qualitative insights into the domain through the diagrammatic representations. For example, they can observe what happens with the orientation of the moment, if the orientation of the force changes from negative to positive. Additionally, they can observe what happens to the moment if the length of the arm is doubled. The numerical representation shows the values of the variables. Learners can change the value of the arm and force by up/down buttons or by dragging the corresponding slider. By changing the arm or force, the value of the moment is displayed accordingly. It is expected that learners develop quantitative insights into the domain through the numerical representation. Color labels are used to map the variables shown in the numerical representation to the other representations. Graphs are important tools in enabling learners to predict relationships between variables and to substantiate the nature of these relationships (McKenzie & Padilla, 1984). McKenzie and Padilla suggest a link between student’ graphing skills and their ability to understand scientific relationships. Mokros and Tinker (1987) write that graphing constitutes a key symbol system in science because it summarizes the covariance of two or three variables over a large number of measures. The graphs help learners to see trends and spot subtle differences in shape. In our learning environment graphs are only used in progression levels two and three. In progression level two one graph shows the relationship between force and moment and the other shows the relationship between arm and moment. If the length of the arm is changed, the graphs change correspondingly. In progression level three one graph shows the relationship between arm and moment and the other shows the relationship between height and moment. Both graphs change dynamically over time. The keys in the graphs allow learners to directly map the graphs to the other representations. Additionally, the color of the graph line corresponds to the colors used in the abstract representation and the color labels in the numerical representation. 4.2.3 Tests and questionnaires A paper-and-pencil pretest was designed to assess the subjects’ prior knowledge of the domain. The pretest was administered in the first experimental session which took place a week in advance of working with the learning environment. A paper-and-pencil posttest was used to determine learning effects. The posttest was administered directly after working with the learning environment. Both the pretest and posttest consisted of 38 multiple-choice items with four answer possibilities divided into three item types: items on subject matter content, items on transfer problems, and items on translation between representations. Figure 3 shows examples of two test items.
Van der Meij & De Jong, Learning with multiple representations, EARLI 2003
9
If you tighten a bolt with an open-end spanner, then where is the moment the largest?
a a. b. c. d.
b
c
d
At the bolt Between the hand and the bolt At the hand At the end of the open-end spanner
In the picture you see a hand exercising a negative force on an open-end spanner.
Which of the following figures is the right reproduction of length, force, and moment? a
b
c
d
Figure 3. Examples of two test items The posttest differed slightly from the pretest; some items were the same as the pretest items and some items were not the same. We choose to change some and not all the items to be able to better compare the posttest scores with the pretest scores. Because subjects did not know which test items were changed, subjects could not rely on a memory strategy. Table 3 shows the number of items in the pretest and posttest. Table 3. Number of items in pretest and posttest Pretest and posttest items
Number of test items
Domain
Transfer
Representation
7
17
14
An electronic questionnaire, based on Swaak’s S.O.S. scale (Swaak, 1998) was given five times to students while they worked with the learning environment. This questionnaire asked to students to rate topic, simulation, and assignment complexity at the time they took it. In particular it asked subjects to score the topic as easy, average, or difficult, whether they found working with the simulation easy, average, or difficult, and whether they found the assignments clear and useful (yes or No). Additionally it asked whether students could always find the arm, force and moment in the simulation (yes or No). Van der Meij & De Jong, Learning with multiple representations, EARLI 2003
10
Subjects had to complete the questionnaire before they continued working with the learning environment. It appeared after the last assignment of the first progression level, three times in the second progression level (after each stage), and after the last assignment of the third progression level. Subjects were asked to answer the questions by clicking on their answer. Figure 4 shows an example of the first question of the questionnaire.
Figure 4. Example of electronic questionnaire question.
4.3 Procedure The experiments were held at the four participating schools and consisted of three experimental sessions: pretest, working with the learning environment, and posttest. The pretest session lasted forty-five minutes maximally. Subjects were informed about the experiment and were told that the test was meant to measure their prior knowledge on forces and moment. Subjects were asked whether they were already familiar with the term moment and got a brief description of it when someone did not. Subjects were asked to fill in all test items, even if they were unsure about the right answer. The learning environment session took place a week after the posttest session and lasted a maximum of one hour. Students were randomly assigned to one of the three conditions using their seating placement. Subject did not know beforehand in which condition they were going to be placed. At the start of the session the subject were told their task was to learn with the learning environment. They were told to work on their own and that they could ask questions to the teacher or researcher about operating the learning environment. The researcher gave a short introduction on how to control the learning environment. The electronic questionnaire had to be filled in five times while working with the learning environment. The subjects were asked to work through all the progression levels and were asked to do all the assignments. The subjects could stop if they felt that they had learned enough with the learning environment and could ask to do the posttest. The posttest took place the same day, directly after the learning environment session. The subjects could work a maximum of forty-five minutes on this test. The subjects were not allowed to use the learning environment during the test. Subjects were asked to fill in all test items, even if they were unsure about the right answer.
4.4 Coding and scoring 4.4.1 Coding and scoring of electronic questionnaire For the first two questions in the electronic questionnaire a three point scale was used. Possible answers were: Easy, Average, or Difficult which were coded as 1, 2, or 3. For the other 5 questions a two point scale was used. Possible answers were: Yes or No which were coded as 1 or 2.
Van der Meij & De Jong, Learning with multiple representations, EARLI 2003
11
4.4.2 Coding and scoring of pretest and posttest For each pretest and posttest item a subject received a score of 1 if the item was answered correctly or a score of 0 if the answer was incorrect. The maximum score was 38. The study used a between-subjects design with condition (separated representations, linked representations, and linked integrated representations) as the independent variable and item type (domain items, transfer, and translation between representations items) as the dependent variable. The effects of conditions on item types were assessed with MANOVA analyses.
5. Results The results section presents analyses of the learning outcomes and processes, and consists of three parts. The first part of this section presents the overall results of the pretest and posttest, a comparison of item types on the pretest and posttest, and a comparison of the experimental conditions. In the second part the results of the electronic questionnaire are presented. The third part presents data on the interaction of the subjects with the learning environment.
5.1 Pretest and posttest Both the pretest and posttest consisted of three item types: items on subject matter content, items on transfer problems, and items on translation between representations. Reliability analyses (N = 78; n = 38 items) resulted in a reliability of .58 (Cronbach’s ) for the pretest2. Reliability analyses of the posttest (N = 78; n = 38) resulted in a reliability of .78 (Cronbach’s ). The reliability of the pretest and posttest are acceptable taking into consideration that the tests measured different aspects of the domain. The overall mean score on the pretest was 21.84 out of 38 multiple-choice items, with a standard deviation of 4.12. The data show that the subjects had some prior knowledge in the domain. Table 4 shows the means and standard deviations of the scores on the three different item types in the pretest. There was no multivariate main effect of condition on item type scores (F(6,172) = 1.12, p = .35). This means that the experimental groups did not differ in prior knowledge. One way ANOVA’s showed no significant relations between overall pretest scores and schools and overall pretest scores and gender (F(3,86) = 1.04, p = .38 and F(1,88) = .67, p = .42)3. Therefore, there was no need to correct for these variables. Table 4. Means and standard deviations of pretest and posttest scores Pretest
Posttest
Mean
(SD)
%
Mean
Domain items (max. 7)
4.79
(1.32)
68
Transfer items (max. 17)
9.63
(2.10)
Representation items (max. 14)
7.42 21.84
Total (max. 38) n = 90
(SD)
%
5.42
(1.37)
77
57
10.13
(2.30)
60
(2.08)
53
8.67
(2.76)
62
(4.12)
57
24.22
(5.16)
64
The overall mean score on the posttest was 24.22 out of 38 multiple-choice items, with a standard deviation of 5.16.
2
For all 126 subjects Cronbach’s
3
For all 126 subjects: F(3,122) = .46, p = .71 and F(1,124) = .35, p = .56
was .56
Van der Meij & De Jong, Learning with multiple representations, EARLI 2003
12
A paired-sampled t-test showed that the overall posttest score of the 90 subjects involved in both the pretest and posttest was significantly better than the overall pretest scores (t(89) = 5.01, p < .01). A paired-sampled t-test showed that the posttest score on domain and representation items was significantly better than the pretest scores on this item types (t(89) = 4.12, p < .01 and t(89) = 4.58, p < .01). Subjects’ scores on the transfer posttest items were better than the pretest score, however this was not significant (t(89) = 1.71, p < .10). Table 5 shows the means and standard deviations of the posttest scores for the three different item types per condition. There was no multivariate main effect of condition F(6,172) = .44, p = .85). No interaction effects of condition with item types were found. Table 5. Means (standard deviations) of posttest scores per condition Condition Separated Domain items (max. 7) Transfer items (max. 17) Representation items (max. 14) Total (max. 38) n = 90
Linked
Integrated
5.24
(1.30)
5.33
(1.40)
5.68
(1.40)
10.17
(2.25)
10.20
(2.37)
10.03
(2.36)
8.27
(2.37)
8.67
(2.88)
9.03
(3.01)
23.69
(4.68)
24.20
(5.14)
24.74
(5.69)
5.2 Electronic questionnaire Subjects were asked to fill out the electronic questionnaire five times while working with the simulation. The answers on questions one (I find the topic at this moment: easy, average, difficult) and two (I find working with the simulation at this moment: easy, average, difficult) are shown in Table 6 and Table 7. Table 6. Answers on question 1(I find the topic at this moment…) per condition Number of answers Moment
Condition
Easy
Average
Difficult
Missing
Total
1
Separated
15
12
1
1
29
Linked
16
13
1
0
30
Integrated
18
11
2
0
31
Separated
23
4
0
2
29
Linked
23
5
0
2
30
Integrated
23
5
2
1
31
Separated
12
11
3
3
29
6
11
4
9
30
Integrated
12
12
1
6
31
Separated
7
11
5
6
29
Linked
4
10
8
8
30
Integrated
11
13
1
6
31
Separated
5
13
7
4
29
Linked
10
12
8
0
30
Integrated
14
11
4
2
31
2
3
Linked 4
5
Van der Meij & De Jong, Learning with multiple representations, EARLI 2003
13
Table 7. Answers on question 2(I find working with the simulation at this moment…) per condition Number of answers Moment
Condition
Easy
Average
Difficult
Missing
Total
1
Separated
16
7
1
5
29
Linked
13
14
0
3
30
Integrated
20
7
2
2
31
Separated
21
4
0
4
29
Linked
21
6
0
3
30
Integrated
25
3
1
2
31
Separated
11
12
1
5
29
Linked
10
7
4
9
30
Integrated
18
7
0
2
31
Separated
10
8
4
7
29
4
14
3
9
30
Integrated
16
8
0
7
31
Separated
9
10
5
5
29
Linked
15
9
5
1
30
Integrated
19
9
1
2
31
2
3
4
Linked 5
A mean score of answers to question one (I find the topic at this moment: easy, average, difficult) from all instances that the questionnaire appeared was calculated for all subjects. A one way ANOVA showed no significant effect of the experimental conditions on domain difficulty experience (F(2,56) = 2.34, p = .11). With an alpha level of .01, a one way ANOVA showed no significant effect for the experimental conditions on difficulty experience, however, there was a trend found in the fourth instance the questionnaire was filled out by the subjects. (F(2,81) = 4.30, p = .02). A significant effect was found for the comparison of the linked with the integrated condition (F(1,45) = 9.24, p = < .01). Subjects experienced the integrated condition as more easy when a second force was introduced in the learning environment. No effects were found between the other two conditions. Subjects experienced the complexity of the domain differently throughout the learning environment. The distinction between low and high complexity was made by observing the answers to question one. If subjects scored higher on ‘easy’ than ‘average’ and ‘difficult’ then the complexity was rated as low. If subjects scored higher on ‘average’ and ‘difficult’ than ‘easy’ then the complexity was rated as high. Progression level one and the first stage of progression level two were experienced as low complex. Stages two and three of progression level two and progression level three were experienced as high complex. Based on this complexity experience we divided the corresponding posttest items into low and high complex categories. There was no multivariate main effect of condition on the scores on the three different item types divided into low and high complexity (F(12,166) = .72, p = .73). A mean score of answers to question two (I find working with the simulation at this moment: easy, average, difficult) from all instances that the questionnaire appeared was calculated for all subjects. A one way ANOVA showed a significant effect of the experimental conditions on difficulty experience when working with the simulation (F(2,51) = 6.17, p < .01).
Van der Meij & De Jong, Learning with multiple representations, EARLI 2003
14
With an alpha level of .01, a one way ANOVA showed a significant effect for the experimental conditions on question two for the fourth instance the questionnaire was given (F(2,64) = 2.23, p = < .01). A significant effect was found for the comparison of the linked with the integrated condition (F(1,43) = 15.02, p = < .01). Subjects experienced the integrated condition as more easy when a second force was introduced in the learning environment. No effects were found between the other two conditions. No effects were found for the experimental conditions on question two in the other instances the questionnaire was given.
6. Conclusions The aim of this study was to examine different ways to support learners in the translation between representations in simulation-based learning environments. To answer our research questions, three versions of the same simulation-based learning environment were compared: a learning environment with separated representations (control condition), a learning environment with dynamically linked representations, and a learning environment with integrated representations. We expected that the dynamic linking version would free the subjects from mentally relating the representations and, therefore, we expected to find a learning effect for the dynamically linked learning environment compared with the separated version. We expected that the learning environment with integrated representations would lead to the best learning results as long as the integrated representations were not too complex for the subjects. However, the instant the representation showed many variables, we expected the advantage of placing the elements close to each other would become a disadvantage. The results of this study did not lead to insights into the benefits or drawbacks of a particular measure to support translation. Learning outcomes, as measured with the paper-and-pencil posttest, did not differ between the experimental conditions. In order to account for this finding issues related to the design of the learning environments, the tests, topic complexity, and use of the simulation were examined. In regards to the design of the learning environments, it may have assisted subjects in translating between the different representations. For example, it is plausible that the orientation of the representations and the color coding gave subjects enough support to link the different representations and to translate between them in order to understand the domain. An additional explanation may be that, because the subjects could interact with the representations, the way they were presented did not matter. Perhaps manipulation of the representations was enough to find relations between representations. The design of the assignments could also have helped the subjects to translate between representations. The assignments were the same for all experimental conditions. They could have been too ‘leading’ in that they explained the relations and helped subjects to translate between the representations. In regards to the tests, they may not have been distinguishing enough to find differences between the experimental conditions. Perhaps the test design was not appropriate to distinguish between the types of representational support. Scores on the posttest were higher than pretest scores, but we had expected better results. An alternative explanation may be that the treatment was too short to find learning results and differences between the experimental conditions. Not finding differences may also be explained by the complexity of the topic. The topic may not have been complex enough to distinguish between the conditions. Due to the prior knowledge of the subjects, they could have been able to do the representation integration mentally even in the separated condition. A final explanation may be that the subjects did not relate the representations to respond to the assignments. Perhaps subjects only used the representations as static images or only used one representation. Analyses of the log files may indicate that this was the case.
Van der Meij & De Jong, Learning with multiple representations, EARLI 2003
15
7. References Ainsworth, S.E. (1999). The functions of multiple representations. Computers & Education, 33, 131-152. Ainsworth, S.E., Wood, D.J., & Bibby, P.A. (1997). Information Technology and Multiple Representations: new opportunities – new problems. Journal of Information for Teacher Education, 6(1), 93-104. Ainsworth, S.E., Wood, D.J., & Bibby, P.A. (1998). Analysing the Costs and Benefits of Multi-Representational Learning Environments. In M. van Someren, P. Reimann, H. Boshuizen & T. de Jong (Eds.), Learning with multiple representations (pp. 120-134). Oxford: Elsevier Science. Chandler, P., & Sweller, J. (1991). Cognitive load theory and the format of instruction. Cognition and Instruction, 8, 293-332. Cox, R., & Brna, P. (1995). Supporting the use of external representations in problem solving: The need for flexible learning environments. Journal of Artificial Intelligence in Education, 6(2/3), 239-302. Cox, R., & Brna, P. (1995). Supporting the use of external representations in problem solving: The need for flexible learning environments. Journal of Artificial Intelligence in Education, 6(2/3), 239-302. de Jong, T., & van Joolingen, W. R. (1998). Scientific discovery learning with computer simulations of conceptual domains. Review of Educational Research Summer 1998, 68(2), 179-201. de Jong, T., Ainsworth, S., Dobson, M., van der Hulst, A., Levonen,. J., Reimann, P., Sime, JA., van Someren, M., Spada, H., & Swaak, J. (1998). Acquiring knowledge in science and mathematics: the use of multiple representations in technology based learning environments. In M. van Someren, P. Reimann, H. Boshuizen & T. de Jong (Eds.), Learning with multiple representations (pp. 9-41). Oxford: Elsevier Science. Jong, T., de (1996). Designing integrated computer simulation environments for discovery learning. SERVIVE project (ET 1020), first project progress report. University of Twente. Kaput, J.J. (1989). Linking representations in the symbol systems of algebra. In S. Wagner, & C. Kieran, Research issues in the learning and teaching of algebra (pp. 167-194). Hillsdale, NJ: Erlbaum. Kozma, R.B., Russell, J., Jones, T., Marx, N., & Davis, J. (1996). The use of multiple, linked representations to facilitate science understanding. In S. Vosniadou, R. Glaser, E. DeCorte, & H. Mandel (Eds.), International perspectives on the psychological foundations of technology-based learning environments. Hillsdale, NJ: Erlbaum. Kozma, R. (2003). The material features of multiple representations and their cognitive and social affordances for science understanding. Learning and Instruction, 13(2), 205-226. Larkin, J. H. & Simon, H. A. (1987). Why a diagram is (sometimes) worth ten thousand words. Cognitive Science, 11, 65-99. McKenzie, D., & Padilla, M. (1984). Effect of laboratory activities and written simulations on the acquisition of graphing skills by eighth grade students. Paper presented at the annual meeting of the National Association for Research in Science Teaching, New Orleans, LA. Mokros, J. R., & Tinker, R. F. (1987). The Impact of microcomputer-based labs on children's ability to interpret graphs. Journal of Research in Science Teaching, 24(4), 369-383. Scaife, M., & Rogers, Y. (1996). External cognition: how do graphical representations work? International Journal of Human-Computer Studies, 45, 185-213. Seufert, T. (2003). Supporting coherence formation in learning from multiple representations. Learning and instruction, 13(3), 227-237. Sweller, J. (1988). Cognitive load during problem solving: Effects on learning. Cognitive Science, 12, 257-285. Sweller, J. (1989). Cognitive technology: Some procedures for facilitating learning and problem solving in mathematics and science. Journal of Educational Psychology, 81, 457466. Van der Meij & De Jong, Learning with multiple representations, EARLI 2003
16
Tabachneck, H.J.M., Leonardo, A.M., & Simon, H.A. (1994). How does an expert use a graph? A model of visual and verbal inferencing in economics. In A. Ram, & K. Eiselt (Eds.). 16th Annual Conference of the Cognitive Science Society (pp. 842-847). Hillsdale, NJ: Erlbaum. Van Labeke, N. and Ainsworth, S. (2001). Applying the DeFT Framework to the Design of Multi-Representational Instructional Simulations. AIED'2001 - 10th International Conference on Artificial Intelligence in Education, San Antonio, Texas, IOS Press. Van Labeke, N., & Ainsworth, S. E. (2002). Representational decisions when learning population dynamics with an instructional simulation. In S. A. Cerri & G. Gouardères & F. Paraguaçu (Eds.), Proceedings of the 6th International Conference ITS 2002 (pp. 831840). Berlin: Springer-Verlag.
Van der Meij & De Jong, Learning with multiple representations, EARLI 2003
17