Aug 20, 2014 - visualizing and making evident any relationships between IT projects in ... Our solution, LearnIT, provides predictive analytics for IT projects by ...
LearnIT: Enhanced Search and Visualization of IT Projects Maher Rahmouni, Marianne Hickey, Claudio Bartolini
To cite this version: Maher Rahmouni, Marianne Hickey, Claudio Bartolini. LearnIT: Enhanced Search and Visualization of IT Projects. Burkhard Stiller; Filip Turck. Mechanisms for Autonomous Management of Networks and Services, 6155, Springer, pp.114-117, 2010, Lecture Notes in Computer Science, 978-3-642-13985-7. .
HAL Id: hal-01056639 https://hal.inria.fr/hal-01056639 Submitted on 20 Aug 2014
HAL is a multi-disciplinary open access archive for the deposit and dissemination of scientific research documents, whether they are published or not. The documents may come from teaching and research institutions in France or abroad, or from public or private research centers.
L’archive ouverte pluridisciplinaire HAL, est destin´ee au d´epˆot et `a la diffusion de documents scientifiques de niveau recherche, publi´es ou non, ´emanant des ´etablissements d’enseignement et de recherche fran¸cais ou ´etrangers, des laboratoires publics ou priv´es.
LearnIT: Enhanced Search and Visualization of IT Projects Maher Rahmouni1, Marianne Hickey1 and Claudio Bartolini2, 2
1 HP Labs, Long Down Avenue, Bristol, BS34 8QZ, UK HP Labs, 1501 Page Mill Rd., Palo Alto, California, 94304-1100, USA {Maher.Rahmouni, Marianne.Hickey, Claudio.Bartolini}@hp.com
Abstract. Year over year, the majority of IT projects fail to deliver the required features on time and budget, costing billions of dollars. The task of portfolio managers is to make a selection of prospective projects, given only rough costbenefit estimates for them. In this paper, we present LearnIT, a tool to aid portfolio managers in their portfolio selection job. LearnIT identifies past or current IT projects within a large database on the basis of similarity to a given IT project or proposal. Furthermore, LearnIT is capable of being trained with expert user feedback, via example. LearnIT also provides a means for visualizing and making evident any relationships between IT projects in order to help IT managers design templates for future projects thus increasing their success rate. Keywords: IT Project and Portfolio Management, Similarity, Search, Visualization
1
Introduction
Every year, thousands of IT projects are undertaken to accommodate a business or process change. Alarmingly, a majority of those projects fail to deliver on time and budget with the required functions and features. According to the 2009 Standish Chaos Report [1], 31% of IT projects in the US will be abandoned before completion, 52% will cost 189% of their original estimates and the average time overrun is an unbelievable 222% of the original time estimate. One of the reasons behind those catastrophic results is the lack of mechanisms and tools for identifying related projects, understanding relationships between projects and learning from past experiences. Better estimates of IT project costs and time could be achieved by aggregating data from past similar IT projects. Increased efficiency could be achieved by re-using common components already implemented, tested and delivered successfully. In this paper we describe work that addresses these challenges in two ways. Firstly, by providing a set of similar past IT projects to a given IT project or proposal, so as to enable improved estimates on cost, time and staffing profiles, and furthermore learn from past experiences. Secondly, by visualizing and making evident any relationships between the thousands of projects in an IT organization of a large enterprise. This aspect
2
Maher Rahmouni, Marianne Hickey and Claudio Bartolini
can help IT managers design templates for future IT projects thus minimizing the risk and increasing their chances of success. The rest of the paper is organized as follows. Section 2 presents our solution – LearnIT – a tool that IT managers can use to quickly find similar projects and to visualize large sets of projects and their relationships. Section 3 discusses related work and, finally, we present conclusions and future work in Section 4.
2
Our Solution - LearnIT
Our solution, LearnIT, provides predictive analytics for IT projects by analyzing the similarity between them and between proposals and ongoing and completed projects, with the long term aim of facilitating additional functionality such as resource prediction, staffing profiles, potential risks and values for projects, based on past experiences in similar projects. LearnIT has two facets: One is a project centric view over a database of completed or ongoing projects, allowing a project manager to find past projects that presented similar conditions to the one at hand, or identify patterns that lead to successful outcomes. For instance, by looking at similar projects, a project manager may have a better idea of any likely issues with their project. The second is a big picture view that looks at all projects and the relationships between them, so as to identify clusters and themes and to recognize sets of projects as a first class entity. This will, for example, allow a portfolio manager to rapidly navigate the set of projects, facilitating the portfolio selection task.
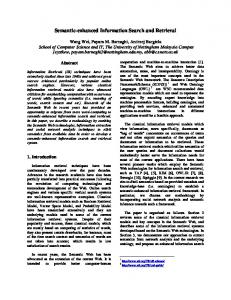
Fig. 1. (a) LearnIT System Architecture
(b) IT Project Similarity Module
The architecture of LearnIT is shown in Fig 1(a). In addition to a database of past and active projects, LearnIT is composed of three main components, which are summarized below: A similarity calculator module used by both the search and the visualization components, which computes the similarity between two IT projects.
LearnIT: Enhanced Search and Visualization of IT Projects
3
A learning module that uses direct feedback from the user to modify and update the weights on which the project similarity module depends. A visualization module where the relationships between projects are shown and projects are clustered, making common themes evident to the user. IT Projects have a list of features such as name, description, staffing profiles, financial information, tasks, etc. As shown in Fig. 1(b), the similarity calculator module takes a pair of projects as input, and outputs a number between 0 and 1 representing the similarity between the two projects. The algorithm takes into account different types of project features, including but not limited to: text (e.g. description), documents (e.g. business justification, presentation, and architecture diagrams), numeric (e.g. cost data), and workflows (e.g. task schedule). For each feature of the project data, a sub-module calculates the similarity of the features. A sub-module may be associated to several features, such that there is a many-to-one mapping between features and sub-modules, for example, a sub-module may be associated to a data type. The similarity of two projects is the weighted sum of individual, feature specific, similarities. Each sub-module may require some tuning. For instance, a text sub-module may be trained with a corpus of data specific to a domain or an enterprise. The weights may also need to be tuned and this is achieved through the learning module. Different solution methods exist for tuning the weights by using a statistical classifier algorithm [2][3]. The weights can be manually set to a sensible default to bootstrap the system. The visualization component makes use of a force directed algorithm for drawing graphs [4]. The main idea behind the algorithm is to draw the graph by simulating a virtual physical model. This model is referred to as the spring model. In this model, a node in the graph is modeled as a ring of steel and an edge is modeled as a spring to form a physical system. This model uses two forces, an attractive force that works along edges and is proportional to the length and weight of the edge and a repulsive force that draws nodes apart that is inversely proportional to the square of the distance between them. Given an initial random layout, the springs and the repulsive forces move the system to a locally minimal energy state, that is, an equilibrium configuration. It has been observed [5] that in such configuration, the resulting graph satisfies some of the most important aesthetic criteria such as distributing vertices evenly, making edge lengths uniform, minimizing edge crossings and reflecting symmetric properties. In our solution, the nodes of the graph represent IT projects, an edge exists between two nodes if the similarity between the corresponding IT projects is greater than or equal to a user defined threshold. The threshold could be updated interactively. Also, the weights on the edges represent the similarity between the corresponding nodes.
3
Related Work
Keyword search (e.g. Google search) could be used to search the project database. If the project information is structured then SQL queries over project attributes could be used. These approaches are less than ideal in that the user needs to know what they are looking for (what search term to use, what attributes to search). A project typically consists of many attributes and pieces of text, and constructing a query based on all of
4
Maher Rahmouni, Marianne Hickey and Claudio Bartolini
these data is cumbersome. Besides, much of the information retrieved may not be relevant, and it is hard to rank results in terms of the importance of different attributes. The state of the art in IT portfolio and project management (PPM) tools, such as HP Portfolio and Project Management [6], does not give a graphical view of the entire set of projects and their relationships. Typically, the available representations are non-graphical representations, such as lists of projects, or riskvalue bubble charts, which do not scale to thousands of projects. With this kind of approach, a lot of projects could be clustered together even if they are not similar. Also, these are limited to numeric attributes.
4
Conclusions and Future Work
Many IT projects fail to deliver on time and budget with the required functions and features. We propose a set of mechanisms and tools, LearnIT, for identifying related projects and understanding the relationships between them, in order to learn from past experiences, thereby improving future project planning and execution and aiding portfolio selection. A prototype of LearnIT has been implemented and initial evaluation with a database of thousands of IT projects indicates positive results. Future work will extend this prototype to include other functionality described in Section 3, particularly learning from domain expert feedback. We also plan to add further similarity sub-modules to include more project attributes in the similarity calculation; in particular, we are exploring graph based similarity distances for project attributes such as work breakdown structure.
5
References
1. CHAOS Summary 2009, Standish Group International, http://www.standishgroup.com/newsroom/chaos_2009.php 2. James, M.: Classification Algorithms, Wiley-Interscience (1995) 3. Rahmouni, M., Bartolini, C.: Learning from Past Experiences to Enhance Decision Support in IT Change Management, Proc. 2010 IEEE/IFIP Network Operations and Management Symposium (NOMS 2010), Osaka, Japan (2010) 4. Di Battista et. al.: Graph Drawing: Algorithms for the Visualization of Graphs, Prentice Hall (1999) 5. Quigley, A., Eades, P.: FADE: Graph Drawing, Clustering, and Visual Abstraction, Proceedings of the 8th International Symposium on Graph Drawing, pp. 197--210 (2001) 6. HP Project and Portfolio Management (PPM) Portfolio Management module, https://h10078.www1.hp.com/cda/hpms/display/main/hpms_content.jsp?zn=bto&cp=1-1116-18%5E1299_4000_100__