LearnPADS: Automatic Tool Generation from Ad Hoc Data Kathleen Fisher
David Walker
Kenny Zhu
AT&T Labs Research
Princeton University
Princeton University
[email protected]
[email protected]
[email protected]
ABSTRACT
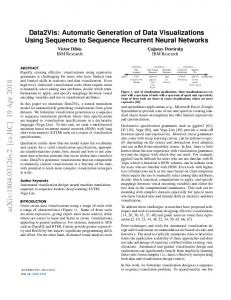
tions. From these descriptions, L EARN PADS generates libraries and the set of tools supported by the PADS system. Analysts can simply use these tools or write their own programs to process the data using the generated parser and printer. The technical details of the inference system appear in our recent paper [6]. The web page http://www.padsproj.org/learning-demo.html has a live demo, which would constitute a portion of our demonstration Space precludes a discussion of related work here; however, our recent paper [6] contains an overview of related work in information extraction, regular expression inference, and schema induction.
In this demonstration, we will present L EARN PADS, a fully automatic system for generating ad hoc data processing tools. When presented with a collection of ad hoc data, the system (1) analyzes the data, (2) infers a PADS [4, 5] description, (3) generates parser, printer, validation and traversal libraries and (4) links these libraries with format-independent tool suites to form stand-alone applications. These applications provide statistical analysis, X ML conversion, CSV conversion, the ability to query with the Galax XQuery engine [3], and the ability to graph selected data elements, all directly from ASCII ad hoc data without human intervention. SIGMOD attendees will see both the user experience with L EARN PADS and the internals of the multi-phase inference algorithm which lies at the heart of the system.
1.
2. USER EXPERIENCE Individual network administrators, systems researchers and large corporations like AT&T must constantly monitor the performance, reliability and security of their systems. In the process, they often have to ingest new kinds of data as new kinds of machines with new log file formats come online. This ingestion process requires understanding the physical layout of the data source and properties of the data such as value ranges and correlations. In this paper, we use a tiny web server log file ai.3000 as a simple example of the kinds of data sources such analysts must develop tools for. A sample record has the form:
INTRODUCTION
An ad hoc data source is any semistructured data source for which useful data analysis and transformation tools are not widely available. XML, HTML and CSV are not ad hoc data sources as there are numerous programming libraries, query languages, manuals and other resources dedicated to helping analysts manipulate data in these formats. Despite the existence of these standard formats, ad hoc data arises often in many fields ranging from computational biology to finance to networking. The goal of the PADS project [8] is to improve the productivity of data analysts who must regularly cope with new and evolving ad hoc data sources. Our core technology is a domain-specific language in which programmers can specify the structure and expected properties of ad hoc data sources, whether they be ASCII, binary, Cobol or a mixture of formats [4, 5]. These specifications, which resemble extended type declarations from conventional programming languages, are compiled into a suite of programming libraries, such as parsers and printers, and end-to-end data processing tools including a query engine and several format translators [2, 3, 7]. Unfortunately, it often takes substantial time and expertise to write a PADS description for a new ad hoc data source – days or even weeks for complex sources. To address this problem, we have developed a multi-phase algorithm that automatically infers the structure of ASCII data sources and produces PADS descrip-
www.proxy.aol.com - - [16/Oct/1997:08:20:45 -0700] "GET /tk/pan.gif HTTP/1.0" 200 15944
To process this data with our system, the user would enter kzhu@myhost> learn data/ai.3000
This command analyzes the web server data and generates a collection of useful artifacts including each of the following. • A complete PADS description that analysts can examine for syntactic information about their data source. This description can be edited, if desired, and used to regenerate any of the tools listed below or to generate a collection of C language libraries for parsing, printing, etc. • An accumulator tool that produces a statistical report about the data source. This tool may be run on any data sharing the format of the original data. It catalogs the number of errors and the distribution of values in all fields of the data. Figure 1 shows the result of applying this program to ai.3000. • A formatting program that converts the ad hoc data into a tabular form with user-defined delimiters such as commas or vertical bars for loading the data into a relational database. • An X ML translator to convert raw data in the original format into a canonical X ML representation. 1
***************************************************************************************************** : struct Struct_149 ***************************************************************************************************** good vals: 3000 bad vals: 0 pcnt-bad: 0.000 [Describing each field of ] ... OMMITTED ... +++++++++++++++++++++++++++++++++++++++++++++++++++++++++++++++++++++++++++++++++++++++++++++++++++++ .var_70 : enum Enum_70 +++++++++++++++++++++++++++++++++++++++++++++++++++++++++++++++++++++++++++++++++++++++++++++++++++++ good vals: 3000 bad vals: 0 pcnt-bad: 0.000 Characterizing enum Enum_70 values: min POST ( 0) max GET ( 1) => distribution of top 2 values out of 2 distinct values: val: GET ( 1) count: 2999 pcnt-of-good-vals: 99.967 val: POST ( 0) count: 1 pcnt-of-good-vals: 0.033 . . . . . . . . . . . . . . . . . . . . . . . . . . . . . . . . . . . . . SUMMING count: 3000 pcnt-of-good-vals: 100.000
Figure 1: A Fragment of the Accumulator Report
• A graphing tool that allows analysts to extract and plot fields of the raw data using GNUPlot. Figure 2 presents a graph of web transaction volume during some time periods in a day, computed from the ai.3000 data.
XML Converter
XML
Accumulator
Analysis Report
Raw Data
Chunked Data
In the demo, we will run the format inferencing engine on a variety of data formats. We will show the resulting PADS descriptions and the output of these generated programs when run on data similar to the training data.
Tokenization
PADS Description
Structure Discovery
IR to PADS Printer
Scoring Function
Format Refinement
PADS Compiler
40000 ai.3000 35000
30000
BTy_67
25000
20000
15000
Figure 3: Architecture of LearnPADS 10000
symbol, a number, a date, a time, or a number of other basic types. Our learning system has a tokenization scheme skewed toward systems data, but users may specify a different scheme for their own domain through a configuration file. For example, computational biologists may want to specify new base types for DNA strings or gene names. When applied to our sample file, this phase produces the following output, in which each line is a chunk and each sequence within brackets is a token:
5000
0 00:00
02:00
04:00
06:00
08:00
10:00
12:00
14:00
16:00
18:00
20:00
22:00
00:00
BTy_25
Figure 2: A graph generated from ai.3000
3.
HOW IT WORKS
[:] [:] [:] [:] [:] [:]
After showing the experience of using our tool, we will demonstrate how it works by walking through the steps of the algorithm on the following simple data file: :123, 14: :721, Harry: :574, Hermione: :9378, 56: :12, Hogwarts: :112, Ron:
[Int] [Int] [Int] [Int] [Int] [Int]
[,] [,] [,] [,] [,] [,]
[White] [White] [White] [White] [White] [White]
[Int] [String] [String] [Int] [String] [String]
[:] [:] [:] [:] [:] [:]
In the structure discovery phase, we use a top-down, divide-andconquer scheme inspired in part by the work of Arasu and GarciaMolina on information extraction from web pages [1]. This scheme calculates frequency distributions for tokens within chunks. It uses this information to decide the top-level structure for the chunks, either a Pstruct, a Parray, or a Punion, corresponding to a tuple, a variable-length sequence, or an alternation in the data. The system then partitions the data accordingly and the algorithm recursively analyzes subchunks. For example, when applied to our sample data file, the first iteration of this process determines that the tokens [White], [:], and [,]
Figure 3 gives an overview of the architecture of the system. The input data, or “training set,” is first partitioned into chunks; each chunk is a piece of recurrent data such as a line, a paragraph, or a file (if the input consists of multiple files). The user specifies this unit of repetition when invoking the tool. Each chunk is then divided into a series of tokens. Each token can be a punctuation 2
120
120
0 times 1 time 2 times
100
0 times 1 time 2 times
100
120
80
80
80
60
60
60
40
40
40
20
20
20
0
0 [white]
[,]
[:]
[string]
[int]
0 times 1 time 2 times
100
0 [int]
[string]
[int]
Figure 4: Histograms calculuated from sample data file (from left to right): (a) first iteration, (b) second iteration (context 1) and (c) second iteration (context 2) have similar frequency distributions (histograms with 100% coverage in one single spike) as shown in Figure 4(a). Hence we group these tokens into a cluster and identify them as a Pstruct. The system then partitions the initial chunks into:
Pstruct(Id = BTy_20 6, raw: 287.759b) [StringConst] ":" (Id = BTy_1 6, raw: 11.044b); [Pint] (Id = BTy_3 6, raw: 65.839b); [StringConst] ", " (Id = BTy_6 6, raw: 17.044b); Punion(Id = BTy_13 6, raw: 175.421b) [Pint] (Id = BTy_15 2, raw: 19.332b); [String] (Id = BTy_10 4, raw: 149.044b); End Punion; [StringConst] ":" (Id = BTy_18 6, raw: 11.044b); End Pstruct
[:] [,] [White] [:]
where [:], [,] [White] and [:] delimit the subchunks. In the second iteration, we compute histograms of the tokens in context 1 and context 2, shown in Figure 4(b) and Figure 4(c) respectively. We can infer context 1 is a simple integer as the token [Int] has 100% coverage. In context 2, the histograms for [String] and [Int] do not show strong struct characteristics, so the algorithm introduces a Punion. We represent the structure inferred by this recursive process in an intermediate representation (IR) that has expressive power similar to the PADS language [5]. We annotate each node in this representation with metadata comprising a unique id, the coverage of the node, and an information-theoretic score labelled “raw” that characterizes how well that part of the description characterizes the data. The IR computed for our example file follows.
Finally, a pretty printer translates the final IR into a legal PADS specification, which the PADS compiler uses to generate a suite of useful tools (Only the XML converter and the accumulator are included in Fig. 3). The PADS description inferred for our sample data source follows: Punion Union_13 { Pint64 var_15; PPstring var_10; }; Precord Pstruct Struct_20 { ’:’; Pint64 var_3; ", "; Union_13 var_13; ’:’; }; Psource Parray entries_t { Struct_20[]; };
Pstruct(Id = BTy_20 6, raw: 432.183b) [Other](:) (Id = BTy_1 6, raw: 50.372b); Pstruct(Id = BTy_5 6, raw: 70.883b) [Pint] (Id = BTy_3 6, raw: 65.839b); End Pstruct; [Other](,) (Id = BTy_6 6, raw: 50.372b); [White] (Id = BTy_8 6, raw: 17.044b); Punion(Id = BTy_13 6, raw: 185.510b) Pstruct(Id = BTy_12 4, raw: 154.089b) [String] (Id = BTy_10 4, raw: 149.044b); End Pstruct; Pstruct(Id = BTy_17 2, raw: 24.377b) [Pint] (Id = BTy_15 2, raw: 19.332b); End Pstruct; End Punion; [Other](:) (Id = BTy_18 6, raw: 50.372b); End Pstruct
4. REFERENCES [1] A. Arasu and H. Garcia-Molina. Extracting structured data from web pages. In SIGMOD, pages 337–348, 2003. [2] M. F. Fern´andez, K. Fisher, J. N. Foster, M. Greenberg, and Y. Mandelbaum. A generic programming toolkit for PADS/ML: First-class upgrades for third-party developers. In PADL, Jan. 2008. [3] M. F. Fern´andez, K. Fisher, R. Gruber, and Y. Mandelbaum. PADX: Querying large-scale ad hoc data with XQuery. In PLAN-X, Jan. 2006. [4] K. Fisher and R. Gruber. PADS: A domain specific language for processing ad hoc data. In PLDI, pages 295–304, June 2005. [5] K. Fisher, Y. Mandelbaum, and D. Walker. The next 700 data description languages. In POPL, Jan. 2006. [6] K. Fisher, D. Walker, K. Zhu, and P. White. From dirt to shovels: Fully automatic tool generation from ad hoc data. In POPL, Jan. 2008. [7] Y. Mandelbaum, K. Fisher, D. Walker, M. Fern´andez, and A. Gleyzer. PADS/ML: A functional data description language. In POPL, Jan. 2007. [8] PADS project. http://www.padsproj.org, 2007.
The format refinement phase analyzes the IR produced by structure discovery and repeatedly applies value-independent and valuedependent rewriting rules. The value-independent rules examine the inferred description to merge or otherwise rearrange components to improve the description. Value-dependent rules introduce constants and enumerations by analyzing the inferred description and the underlying training data looking for fields with little or no variation. The value-dependent rules also infer inter-field dependency information. At any point in the refinement process, many rewriting rules may apply; our algorithm chooses the rule that optimizes an information-theoretic scoring function based on the minimum description length principle. The process stops when no further refinements are possible. The result of this process on our running example is the following refined IR:
3