International Journal of Information and Electronics Engineering, Vol. 3, No. 4, July 2013
Least Squares Interpolation Methods for LTE System Channel Estimation over Extended ITU Channels S. Adegbite, B. G. Stewart, and S. G. McMeekin
Coherence bandwidth and coherence time give the range of frequencies and time duration respectively over which the channel is relatively constant in nature. When signal transmission takes place over a relatively constant channel, the signal does not suffer from severe distortion and hence can be easily recovered at the receiver. Root mean square (RMS) delay spread, RMS, and maximum Doppler shift fD are other channel fading parameters related to Bc and Tc respectively as follows [2].
Abstract—Performance of pilot-aided channel estimation techniques such as the Least Squares (LS) method depends on not only on the signal-to-noise ratio (SNR), channel conditions and pilot ratio, but also on the choice of interpolation method for deriving channel estimates at non-pilot subcarriers. This paper investigates the bit-error-rate (BER) performance of linear, spline and Piecewise Cubic Hermite Interpolating Polynomial (PCHIP) interpolation methods in LS channel estimation over the three extended ITU channel profiles defined for Long Term Evolution (LTE) testing. Simulation results show that applying the linear interpolation method produces the best BER performance over the fading channel with the smallest multipath delay spread. It is also shown that the choice of best interpolation method actually depends on the SNR in some of the fading channel profiles.
Bc 1
RMS
Tc 1
Index Terms—ITU, LS, LTE, PCHIP, spline.
(2)
These parameters determine the extent and nature of channel distortion. Considering a signal with bandwidth Bs and OFDM symbol duration Ts, multipath fading is considered to be frequency-selective i.e. linearly time invariant when Bs >> Bc, otherwise, the frequency-selectivity of multipath fading is flat. On the other hand, in the time-selectivity sense, the time-selectivity of a multipath fading is considered slow when Tc >> Ts. Otherwise, it is termed fast fading [2]. Application of the Least Squares (LS) method is the simplest pilot-aided channel estimation scheme for combating multipath distortion [2]. However, LS is not considered as the best method of channel estimation since its mean square error (MSE) performance is inversely proportional to the SNR. This means LS provides minimum error, i.e. performs best, at high SNR [2]. In OFDM based systems, pilot-aided channel estimation usually involves some form of interpolation for deriving the estimates of channel distortions at non-pilot or data subcarrier locations within the symbol transmissions [2]. In [5] the BER performance over two different channel models for OFDM was investigated. These channels were the Advanced Television Technology Centre (ATTC)/the Grande Alliance DTV laboratory‟s ensemble E channel model and a simplified DVB-T channel model, at Doppler frequency of 70Hz. A 2D channel estimation based on an OFDM architecture with a comb-type pilot arrangement using a data to pilot ratio of eight was considered. The results suggested that a Low Pass Interpolation (LPI) method, an interpolation method based on applying an interpolating low-pass Finite Impulse Response (FIR) filter to obtain channel estimates, gave slightly better BER performance than the spline method at higher SNR over the ATTC/Grande Alliance DTV laboratory‟s ensemble E channel model but
I. INTRODUCTION Orthogonal frequency division multiplexing (OFDM) technology has been adopted in many of the next generation communication systems such as Long Term Evolution (LTE) and Worldwide Interoperability for Microwave Access (WiMAX) [1]. OFDM is preferred not only because it offers high data rate transmission but also because of its flexibility and robustness against multipath fading [1]. Multipath channel fading exists when multiple delayed copies of a transmitted signal are received at the receiver, thereby resulting in the distortion of the transmitted signal. These distortions are collectively termed „channel fading‟, causing reception errors and hence increased bit-error-rate (BER). Channel fading can be broadly classified as time-selective and/or frequency selective, depending on the relationship between the fading channel and the transmitted signal parameters [2]. To combat multipath fading and improve BER, some form of channel estimation method is required in order to estimate the channel distortion effect for each of the active subcarriers within an OFDM symbol [3]. At the receiver side of the LTE physical layer, coherent detection is applied. Coherent detection is based on applying some form of pilot-aided channel estimation for the recovery of transmitted data [2, 4]. Channel fading can be characterised by parameters such as the coherence bandwidth Bc and coherence time Tc. Manuscript received November 10, 2012; revised December 18, 2012. This work was supported by the School of Engineering and Built Environment of Glasgow Caledonian University through a University Sponsored scholarship. S. A. Adegbite, B. G. Stewart, and S. G. McMeekin are with Glasgow Caledonian University, Glasgow, UK (e-mail:
[email protected];
[email protected];
[email protected]).
DOI: 10.7763/IJIEE.2013.V3.347
fD
(1)
414
International Journal of Information and Electronics Engineering, Vol. 3, No. 4, July 2013
the sequence is up-sampled by padding the original complex data-valued sequence with zeros to produce sequence xN, which is an NFFT × 1 vector, where NFFT is a value based to the power 2. This vector is then transformed into a time-domain sequence using the inverse Fast Fourier Transform (IFFT). The length of this time domain sequence is further extended by NG cyclic prefix samples. Cyclic prefixing (CP) copies the last NG samples in xN to the first NG samples of xN, to produce the resulting transmitted OFDM signal. CP insertion creates a guard interval which prevents Inter-Symbol-Interference (ISI) between consecutive OFDM signals. The fading channel is commonly modelled as a linear FIR filter [2] with a frequency response H. In the frequency domain, a wireless transmission model is described in [2] as in (3).
not over the simplified DVB-T channel model. This means BER performance not only depends on SNR, pilot pattern arrangement and interpolation method, but also on the channel model. In the investigation carried out in [6] on 2D channel estimation based also on an OFDM architecture, linear estimation was shown to outperform spline and PCHIP methods over two standard International Telecommunications Union (ITU) channel models; ITU-Pedestrian A (PA) and ITU-Vehicular (VA) for WiMAX based system at Doppler frequencies of 25.56 and 255.56 Hz respectively. Results in [5] and [6] imply it is difficult to label any given interpolation method as an overall best choice method since their performance actually depends on several other variables. LTE has been chosen for the next (4G) mobile communication system standard. However, little information appears to exist on the BER performance when different interpolation methods are applied for channel estimation in LTE. To provide further understanding on this issue, this paper investigates the performance of the one dimensional (1D) application of linear, spline and PCHIP interpolation methods on LS channel estimation over the extended ITU channel models; Extended Pedestrian A (WPA), Extended Vehicular A (EVA) and Extended Typical Urban (ETU), that have been defined for the purpose of LTE system testing [7].
Y XH W
(3)
where: Y is an N × 1 vector the elements being the received (data and pilot) subcarrier complex symbols X is an N × N diagonal matrix whose diagonal elements are the transmitted (data and pilot) subcarrier complex symbols H is an N × 1 vector of the channel frequency response W is an N × 1 zero-mean complex data-valued Additive White Gaussian Noise vector (AWGN) At the receiver of an OFDM system, the first step is the removal of CP samples, followed by the transformation of the remaining sequence into the frequency domain using the Fast Fourier Transform (FFT). The next stage is data recovery which involves channel estimation, to estimate the channel coefficients at the pilot subcarrier locations. This is followed by interpolation, to estimate channel coefficients at data subcarrier locations. Then channel equalization is implemented, to derive an estimate of the transmitted complex data-valued symbols. The final stage involves signal de-mapping or demodulation, which maps the complex symbols to equivalent bit representation.
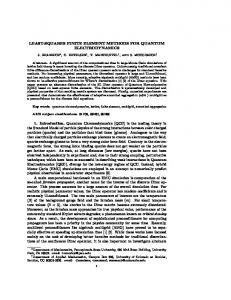
Fig. 1. Block diagram – OFDM transmitter/receiver
II. OFDM SYSTEM DESCRIPTION The investigation carried out in this paper uses the block diagram in Fig. 1 which describes a typical block diagram of an OFDM architecture. Considered in this paper is an OFDM symbol block with N active subcarriers (data and pilots), comprising Nd data subcarriers and Np pilot subcarriers. At the transmitter, the function of each block is summarised as follows; 1. QPSK Modulation: Quadrature Phase Shift Keying (QPSK) modulation is used. The block maps every 2 data bits into 1 complex data-valued symbol according to the bits-to-symbol mapping scheme described in [8]. Each complex data-valued complex symbol is then assigned to a data subcarrier location. 2. Pilot Generation: This involves generating a set of reference complex symbols (or pilots) for pilot-aided channel estimation. Each pilot is inserted at the reserved pilot subcarrier location kp. In LTE, these pilots are generated from a set Gold code sequence described in [8]. The resulting sequence is an N × 1 vector of frequency domain complex symbols. 3. IFFT & INSERT CP: To prevent out-of-band radiation,
III. LEAST SQUARES (LS) CHANNEL ESTIMATION LS channel estimation makes use of the prior knowledge of transmitted pilot symbols and the corresponding received pilot symbols for the evaluation of the channel estimates, Ĥp, at pilot subcarrier locations kp. Equation 4 is used to derive Ĥp (see [2]), Hˆ p ( X k p H X k p ) 1 X k p H Yk p
(4)
where (*)H is the conjugate transpose operation Xkp is an Np × Np diagonal matrix whose elements are the transmitted complex-valued pilot sequence Ykp is an Np × 1 vector of the received complex-valued pilot sequence – after channel distortion 415
International Journal of Information and Electronics Engineering, Vol. 3, No. 4, July 2013
Ĥp is an Np × 1 vector of LS channel estimates at pilot subcarrier locations kp
satisfied for all the channel models. Simulation results show plot of BER performance as a function of the average SNR for each of the interpolation methods over the extended ITU channel models at Doppler frequencies of 0, 1.5, 15, 70 and 150 Hz.
Given that the pilot spacing in the frequency domain is Df, the pilots are inserted in the frequency domain at regular intervals, i.e. at every Df subcarriers, starting from the first subcarrier location. In this paper Df = 6 as shown in Table II. So, the pilot subcarrier locations kp are [1, 7, 13, 19, 25 …].
TABLE II: SIMULATION PARAMETERS (LTE) System Parameter
TABLE I: THE EXTENDED ITU CHANNEL PROFILES EVA ETU EPA
RMS
Tap No.
= 45ns
RMS
Excess Delay (ns)
Relative Power (dB)
1 2
0 30
0.0 -1.0
0 30
3 4 5 6 7 8 9
70 90 110 190 410 NA NA
-2.0 -3.0 -8.0 -17.2 -20.8 NA NA
150 310 370 710 1090 1730 2510
RMS
= 357ns
= 991ns
Value
Bandwidth
10 MHz
Sampling Frequency
15.36 MHz
Number of Active Subcarriers
600
Excess Delay (ns)
Relative Power (dB)
Number of Data Subcarriers
500
Pilot Spacing
6
0.0 -1.5
0 50
-1.0 -1.0
Number of Pilot Subcarriers
100
CP
5.21us
-1.4 -3.6 -0.6 -9.1 -7.0 -12 -16.9
120 200 230 500 1600 2300 5000
-1.0 0.0 0.0 0.0 -3.0 -5.0 -7.0
Modulation Type
QPSK
FFT Size
1024
TX/RX antenna
Single User SISO
Fading/Doppler Spectrum
Rayleigh/Jakes
Excess Relative Delay Power (ns) (dB)
IV. EXTENDED ITU CHANNEL MODEL The extended ITU channel models; EPA, EVA and ETU that were considered in this paper were modelled in Matlab using the power-delay profiles in Table I. This table shows the power-delay profiles and the RMS delay spread of the extended ITU channel models as defined in [7]. As discussed earlier in Section I, the effect of the fading channel on the transmitted signals depends on the delay spread of the channel. Large maximum delay and RMS in the ETU channel implies transmission over this channel would be severely distorted compared to that in EPA, which has the smallest delay spread.
V. SIMULATION Simulation results were obtained using the block diagram in Fig. 1 and simulation parameters in Table II. For simplicity, the LTE specification for largest „normal‟ CP duration i.e. relating to the first OFDM symbol in an LTE slot and the pilot spacing of 6 have been used in this simulation. Also, the values of bandwidth, sampling frequency, number of active subcarriers, number of data subcarriers and FFT size in Table II are all valid LTE system specification.
Fig. 2 shows the BER performance of the three interpolation methods in EPA, EVA and ETU fading channel models at zero Doppler frequency. Results in Fig. 2 shows that the linear interpolation method is the most appropriate scheme for all extended ITU channel models at zero Doppler frequency. Fig. 2 also shows that the spline method gives the worst performance. Fig. 3 shows the performance of the three interpolation methods in the EPA fading channel model at Doppler frequencies of 1.5, 15, 70 and 150 Hz. Similar to the results in Fig. 2, linear interpolation produced the best performance while spline gave the worst performance. Results in Figs. 2 and Fig. 3 suggest that linear interpolation might be most suitable in the case of channel fading with very small delay spread relative to the guard interval duration provided by cyclic prefixing. The possible suitability of linear interpolation in EPA could also be attributed to the much greater proportion of the number of pilots in relation to the delay spread.
VI. SIMULATION RESULTS Using the system parameters in Table II, BER performance of LS channel estimation was calculated over single block transmissions of the OFDM symbol, assuming perfect synchronisation. Since the effectiveness of any pilot-aided channel estimation depends on pilot spacing and the total number of pilots, one of the conditions for effective tracking of the channel is to make sure that the number of pilots is greater the maximum excess delay of the channel [9]. This condition was
Fig. 2. Comparison of BER performance between interpolation methods over EPA, EVA and ETU channel models at zero doppler frequency
Fig. 4 shows the performance of the interpolation methods in the EVA fading channel model at Doppler frequencies of 1.5, 15, 70 and 150 Hz. Here, at higher SNR (> 30 dB), linear interpolation produced the worst performance while PCHIP gave the best performance. In this case, the suitability of interpolation method does not only depend on the channel 416
International Journal of Information and Electronics Engineering, Vol. 3, No. 4, July 2013
condition but also the SNR. At lower SNR, there is no significant difference in performance between interpolation methods but at higher SNR, a significant gain in the application of PCHIP was observed. This dependency on SNR in the EVA fading channel might be attributed to the nature of the EVA power profile where relative power gains in the first 6 taps in EVA are non-linear.
estimation, this paper has focused on LS channel estimation in an LTE system for a standard pilot embedded OFDM LTE symbol over fading channel models that have been defined in LTE standards. The simulation results show that linear interpolation is most suitable in LS channel estimation over both EPA and EVA fading channel models at zero Doppler frequency. At zero Doppler frequency in the ETU fading channel, linear interpolation is only suitable at lower SNR while PCHIP is most suitable at higher SNR. In the EPA fading channel at non-zero Doppler frequencies up to 150 Hz, linear interpolation is the most suitable method out of the three interpolation methods considered. However, in EVA fading, both PCHIP and spline interpolation methods produce similar performance especially at lower SNR values. At higher SNR, PCHIP outperformed the spline interpolation method. In the ETU fading channel, spline interpolation gave the best performance at non-zero Doppler frequencies at higher SNR. The simulation results appear to suggest that the BER performance can be best optimised with a suitable interpolation method for a given channel fading condition and SNR. A form of Adaptive Interpolation Scheme (AIS) may therefore be appropriate towards achieving optimum performance for LS channel estimation. An AIS may also be considered in other channel estimation methods such as Linear Minimum Mean Square Error (MMSE). These topics will form the focus of future research.
Fig. 3. Comparison of BER performance between interpolation methods over EPA channel models at doppler frequencies [1.5, 15, 70, 150 Hz]
REFERENCES [1]
Fig. 4. Comparison of BER performance between interpolation methods over EVA channel models at doppler frequencies [1.5, 15, 70, 150 Hz]
[2]
In Fig. 5, over the ETU fading channel, spline interpolation is the most suitable method while linear interpolation gives the worst performance. As discussed earlier, transmissions in the ETU fading channel are expected to be severely distorted. So, it is not surprising that in Fig. 5, an error floor is reached with increasing SNR. However, the performance may be improved by increasing the number of pilots which increases the effectiveness of channel tracking.
[3]
[4] [5]
[6]
[7]
[8] [9]
M. Ergen, Mobile Broadband: Including WiMAX and LTE, New York: Springer Verlag, 2009. Y. S. Cho, J. Kim, W. Y. Yang, and C. Kang, MIMO-OFDM Wireless Communications with MATLAB, Singapore: IEEE Press, 2010. M. Heinrich, M. Moeneclaey, and S. Fechtel, Digital Communication Receivers: Synchronization, Channel Estimation, and Signal Processing, New York: Wiley, 1998. H. Franz and M. Gerald, Wireless Communications over Rapidly Time-Varying Channels, ch. 4. 2011. S. Coleri, M. Ergen, A. Puri, and A. Bahai, "Channel estimation techniques based on pilot arrangement in OFDM systems," IEEE Transactions on Broadcasting, vol. 48, pp. 223-229, 2002. P. P. T. Thu and W. Tomohisa, "A Channel Estimation Using Least Square Fitting for OFDMA Downlink Partial Usage of Subchannels," International Workshop on Smart Info-Media Systems in Bangkok, Nov. 1 - 2, 2007. 3GPP TS 36.101, version 11.2.0, Evolved Universal Terrestrial Radio Access (E-UTRA), User Equipment (UE) radio transmission and reception, 2012. 3GPP TS 36.211, version 11.0.0, Evolved Universal Terrestrial Radio Access (E-UTRA), Physical Channels and Modulation, 2012. M. K. Ozdemir and H. Arslan, "Channel estimation for wireless OFDM systems,” IEEE Communications Surveys, vol. 9, pp. 18-48, 2007.
S. Adegbite is currently a PhD research student at Glasgow Caledonian University, UK. He graduated with an MEng. (Hons) in 2009 from Heriot-Watt University, Scotland, UK. He worked with STMicroelectronics Limited in the UK between 2009 and 2011. In 2011, he started his PhD at Glasgow Caledonian University, Scotland, UK. His research interest is in the development and implementation of novel signal processing algorithms for improving the system performance of next generation broadband wireless communication systems such as 4G-LTE.
Fig. 5. Comparison of BER performance between interpolation methods over ETU channel models at doppler frequencies [1.5, 15, 70, 150 Hz]
VII. CONCLUSIONS In contrast to existing published papers on the performance of interpolation methods in pilot-aided channel 417
International Journal of Information and Electronics Engineering, Vol. 3, No. 4, July 2013 S. G. McMeekin received his BSc degree from the University of Strathclyde, Glasgow, UK in 1985, his MSc degree from the University of Glasgow, UK in 1986 and his PhD degree from the University of Glasgow, UK in 1989. Professor McMeekin is currently the Associate Dean of research at the Glasgow Caledonian University. His current research interests include the development of condition monitoring systems for energy assets; wireless sensor networks; digital communication systems; software modelling and analysis of complex high voltage systems and the development of photonic sensors. He has over 100 publications and holds a number of patents.
B. G. Stewart graduated with a B. Sc. (Hons) in 1981 and a Ph.D. in 1985, both from the University of Glasgow, Scotland, UK. He also received a B.D. (Hons) in 1994 from the University of Aberdeen, Scotland, UK. In 1985 he became a lecturer in the School of Electronic and Electrical Engineering at the now Robert Gordon University, Aberdeen, UK. In 1998 he joined Glasgow Caledonian University, Scotland, UK, and is currently a Professor in the School of Engineering and Built Environment. His research interests lie in the fields of high voltage insulation diagnostics and communication systems. Professor Stewart is a Chartered Engineer, a Member of the IET, a Member of the IEEE and currently serves on the IEEE DEIS Ad Com.
418