LEAST SQUARES REGRESSION WITH ERRORS IN BOTH VARIABLES: CASE STUDIES Elcio Cruz de Oliveira* Petrobras Transporte S.A., Avenida Presidente Vargas, 328, Centro, 20091-060 Rio de Janeiro – RJ, Brasil / Pontifícia Universidade Católica do Rio de Janeiro,# 22453-900 Rio de Janeiro – RJ, Brasil Paula Fernandes de Aguiar Instituto de Química, Universidade Federal do Rio de Janeiro, 21945-970 Rio de Janeiro – RJ, Brasil Recebido em 29/8/12; aceito em 3/2/13; publicado na web em 4/6/13
Nota Técnica
Quim. Nova, Vol. 36, No. 6, 885-889, 2013
Analytical curves are normally obtained from discrete data by least squares regression. The least squares regression of data involving significant error in both x and y values should not be implemented by ordinary least squares (OLS). In this work, the use of orthogonal distance regression (ODR) is discussed as an alternative approach in order to take into account the error in the x variable. Four examples are presented to illustrate deviation between the results from both regression methods. The examples studied show that, in some situations, ODR coefficients must substitute for those of OLS, and, in other situations, the difference is not significant. Keywords: orthogonal distance regression; least squares regression; error in x and y variables.
INTRODUCTION
METHODOLOGY
Classical univariate regression is the most used regression method in Analytical Chemistry. It is generally implemented by ordinary least squares (OLS) fitting using n points (xi,yi) to a response function, which is usually linear, and handling homoscedastic data.1 In this way, the amount of the unknown (x0) is estimated from one or more measurements of its response (y0). The algorithms for carrying out such analytical curve fitting have been well established in the literature. When working with heteroscedastic data, Analytical Chemistry uses a weighted linear regression. However, a problem remains in the Analytical Chemistry community: error in the x-axis data. Classical linear regression, available in commercial software, assumes that x-variable errors are negligible, i.e., error-free.1,2 Analytical methods must typically be applicable over a wide range of concentrations. Therefore, a new analytical method is often compared with a standard method by the analysis of samples in which the analyte concentration may vary over several orders of magnitude. In this case, it is inappropriate to use the paired t-test because its validity rests on the assumption that any errors, either random or systematic, are independent of concentration.3 Over wide ranges of concentration, this assumption may no longer be true. A second problem for fitting analytical curves appears when certified reference materials having negligible error are not available.4 Therefore, besides the error derived from the signal, the error from the x-axis data must also be considered. In these cases, OLS should not be used and the literature suggests carrying out orthogonal distance regression (ODR).5,6 The aim of this work is to suggest how to handle such cases in which errors in both variables must be considered, and the question of whether ODR and OLS yield metrological differences is evaluated.
General In general, it is assumed that only the response variable, y, is subject to error and that the predictor variable, x, is known with negligible error. However, there are situations for which the assumption that x is error-free is not justified. In these situations, regression methods are required that take the error of both variables into account. These methods are called errors-in-variables regression methods.6 In OLS analysis, the best fit is chosen to minimize the residual errors in the y direction, i.e.,
, for all points.
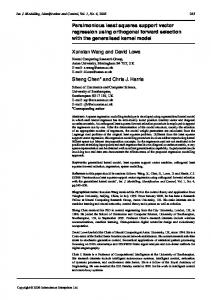
However, for the ODR model, the sum of the squares of the x residual, ^ A2 = (Xi –Xi)2 and the y residual, B2 = (Yi – Ŷi)2, are both minimized. This model results in choosing the line regression that minimizes the sum of the squares of the perpendicular (orthogonal) distances from the data points to the line because, geometrically, C2 = A2 + B2, as shown in Figure 1.7
Figure 1. OLS versus ODR. Adapted from ref. 7 *e-mail:
[email protected] # Programa de Pós-Graduação em Metrologia para Qualidade e Inovação
If hi represents the true value of yi and xi the true value of xi with ei and di representing the experimental errors in each, respectively, then
886
Aguiar and Oliveira
and (1) (2)
The model which describes the straight-line relationship between hi and xi is
Quim. Nova
Deriving this new equation in relation to these three estimators and equalizing the derivatives to zero, which is the approach of Deming,8 estimates b1 (Equation 10) as
. (3)
Consequently, the combination of Equation (3) with Equations (1) and (2) yields
, (4)
where the last term includes the experimental errors. The fitted line is then the one for which the least sum of squares, dis, is obtained, and the method has thus been called orthogonal distance regression (ODR). This is equivalent to finding the first principal component of a data set consisting of two variables and n samples.6 ODR statistics The maximum likelihood method is the most widely used method to solve regressions with errors in both axes; however, the literature quotes other methods.8-12 The expression of the function of the likelihood method for n pairs of values (xi, yi) that includes a multidimensional model suitable for describing experimental data fluctuations is the multivariate normal:13
. (5)
, (10)
where sy2 and sx2 are the variances of the y variable and the x variable, respectively, and cov(y,x) = (S(yi – –y )(xi – x– ))/(n – 1) is the covariance of y and x. Because both variables are affected by random measurement errors with the simplest case being s2e = sd2, an unbiased estimation of the regression coefficients can be obtained by minimizing Sdi2, i.e., the sum of the squares of the perpendicular distances from the data points to the regression line, where the values of di are determined perpendicular to the estimated line.6 The expressions for b1 and b0 are
, (11)
, (12)
with sx2 = S(xi – x– )2, sy2 = S(yi – –y )2, and cov(y,x) = S(xi – x– )(yi – –y ). Confidence intervals
Both variables are affected by random measurement errors: x variable, s2xi = se2i, and y variable, s2yi = sd2i. The parameters a and b are estimated by b0 and b1, respectively. If it is considered that both variances of the variables are constant, s2x = q and its known rate is λ. This ratio can be defined as follows:
To test for bias, i.e., the equivalence of the compared methods, the 95%-confidence intervals of the estimators from the linear equations, y = b0 + b1x, obtained after the orthogonal regression, were used to test whether the optimal estimators of b0 = 0 and b1 = 1 are included in the spanned confidence intervals (CI):15 and
. (6)
. (13)
The standard errors of estimators b0 and b1 are16
and
(14)
Applying Equation (6) into Equation (5) yields the following: , (7)
, (15)
and its logarithm is given by where . (8)
Maximizing (8), the log likelihood function in relation to the disturbing parameters,14 µ^ xi yields
. (9)
Substituting Equation (9) into Equation (8) results in the profiled log likelihood function that is only a function of a, b, and θ.
,
(16)
,
(17)
,
(18)
where t is the Student t-factor with: p = 95%, f = n – 2, and sb0 and sb1 are the standard errors of the estimators b0 and b1. The ideal values of b0 = 0 and b1 = 1 imply no bias between the compared methods, i.e., equivalence in the calibration results. A fail of the test for the axis intercept b0 implies a systematic bias, e.g., a bias caused by a wrong blank correction of one of the methods. If
Least squares regression with errors in both variables: case studies
Vol. 36, No. 6
887
the test fails for the slope b1, this implies a proportional bias. The combinations of the two errors can also appear. OLS versus ODR Mandel17 considers an approximate relationship between the ordinary least squares slope, b1(OLS), and the orthogonal distance regression slope, b1(ODR) as follows:
,
(19) Figure 3. Quadratic regression between
and
where sex2 is the variance of a single x value (which involves replicate observations of the same x) and sx2 is the variance of the x variable. Table 1 shows the relationship between s 2ex and the ratio when a perfect system is considered, i.e., when sx2 is constant and equal to 1. Table 1. Relationship between
and
0.00
1.00
0.01
1.01
0.10
1.11
0.20
1.25
0.25
1.33
0.33
1.50
0.50
2.00
0.70
3.33
0.90
10.0
On the basis of Table 1, Figure 2 shows that and have a behavior that is close to linearity when the variance of a single x value is lower than that of the x variable, i.e., from 0.0 to 0.2.
Figure 4.
tending to infinity
with a photometric technique for the determination of the level of phytic acid in urine samples, and confidence intervals are calculated to evaluate the equivalence between the methods. The instrumentation is described by March.18 Moreover, an inadequate yet frequently used approach, the t-test, is also applied to the same set of data. In the second study, the regression of an analytical curve using a certified reference material (CRM) to build the analytical curve for the determination of the copper content in water by Flame Atomic Absorption Spectrometry (FAAS) is carried out by both OLS and ODR approaches, and the results then are compared. The instrumentation is described by Oliveira.19 The next study involves comparison of potentiometric stripping analysis (PSA) and atomic absorption spectroscopy (AAS) in determining lead in fruit juices and soft drinks. The instrumentation is described by Mannino.20 For the last study, ammonium ions derived from the mainstream smoke of a cigarette is trapped (retained), extracted, and analyzed by ion chromatography equipped with a conductivity detector.21 An analytical curve was built with reference materials (MR) instead of CRM. In this way, ODR is the most recommended regression. RESULTS AND DISCUSSION
Figure 2. Linear relationship between
and
When the increases up to 0.5, the best regression seems to be quadratic, as shown in Figure 3, based on Table 1. As gets close to the unity, grows rapidly to infinity, as shown in Figure 4, also based on Table 1. EXPERIMENTAL Four case studies using ODR are discussed in this work. In these examples, equal errors are considered in both variables. In the first study, a catalytic fluorimetric method is compared
All data were tested for normality assumption by the Shapiro– Wilk test, homoscedastic behavior based on the Cochran test, independence by the Durbin–Watson test, and for lack of fit by ANOVA.6 All calculations were conducted by Microsoft Excel. Case study 1 The level of phytic acid in urine samples was determined by a catalytic fluorimetric (CF) method and the results were compared with those obtained using an established extraction photometric (EP) technique. The results, in mg/L, are the means of triplicate measurements, as shown in Table 2. ODR line: ŷ = –0.056 + 0.996x CI(b0) = –0.056 ± 0.090 (–0.147, 0.034) CI(b1) = 0.996 ± 0.040 (0.955, 1.036)
888
Aguiar and Oliveira
Table 2. Comparison of CF versus EP
Quim. Nova
Table 4. Comparison of results from PSA and AAS
EP
CF
EP
CF
AAS
PSA
1.98
1.87
0.13
0.14
0.035
0.035
2.31
2.20
3.15
3.20
0.075
0.070
3.29
3.15
2.72
2.70
0.075
0.080
3.56
3.42
2.31
2.43
0.080
0.080
1.23
1.10
1.92
1.78
0.125
0.120
1.57
1.41
1.56
1.53
0.205
0.200
2.05
1.84
0.94
0.84
0.205
0.220
0.66
0.68
2.27
2.21
0.215
0.200
0.31
0.27
3.17
3.10
0.240
0.250
2.82
2.80
2.36
2.34
0.350
0.330
On the basis of Equation (13), the confidence intervals include the optimal estimators for the slope b1 and intercept b0, which are one and zero, respectively, showing equivalence between the two methods. If the t-test3 was used, which is incorrect, the comparison of the methods would not be considered equivalent, because, to the 95% confidence level, the value of t calculated (3.59) is higher than the value of t critical (2.09).
variable) with a reference flameless AAS method (x variable) for the determination of Pb in fruit juices and soft drinks. The results, in mg/dm3, are based on three replicate determinations for AAS and five replicate determinations for PSA, as shown in Table 5. Table 5. Analytical curve data built with MR Concentration (mg mL-1)
Signal (mV s-1)
0.261
109
1.003
439
2.481
1096
5.000
2216
10.004
4441
Case study 2 Table 3 presents the concentrations and replicate measurements for the determination of copper in water by FAAS. Data regression shows that there is no difference between the ODR coefficients (see equations below) and those derived from OLS. As a CRM was used, s2ex is negligible when it is compared to sx2, so sex2 /s2x is very close to zero. Therefore, in this case, the error in the x-axis can be considered negligible in the regression of the analytical curve. Table 3. Data from an analytical curve for the determination of copper content in waters by FAAS Concentration, mg mL-1
Absorbance
0.10
0.0081
0.0079
0.0080
0.25
0.0206
0.0205
0.0202
0.50
0.0391
0.0394
0.0398
0.75
0.0596
0.0591
0.0590
1.00
0.0782
0.0790
0.0792
OLS line: ŷ = 0.0004 + 0.0784x ODR line: ŷ = 0.0004 + 0.0784x CI(b1ODR) = 0.0784 ± 0.0007 (0.0778, 0.0790) There is no significant difference between the two approaches when a certified reference material (CRM) is used to build the analytical curve. However, when a CRM is not available or it is too expensive, a reference sample cannot be used. Under these conditions, the x-axis error must be taken into account in the regression line. In these cases, the OLS line can be different from that derived from ODR. For this example, from an examination of the value of sex, Table 4 indicates that the ODR line must be considered rather than the OLS line using the Deming approach given in Equation (19). Standard deviations of a single x value higher than 0.030 mg/mL causes b1(ODR) to exceed the confidence interval (0.0778, 0.0790). Case study 3 This case study compares a new potentiometric method (y
ODR line: ŷ = –0.0030 + 0.9686x CI(b0) = –0.0030 ± 0.0154 (–0.0109, 0.0170) CI(b1) = 0.9686 ± 0.0828 (0.8933, 1.0489) On the basis of Equations 13, 14, and 15, the confidence intervals include the optimal estimators for the slope b1 and the intercept b0, which are one and zero, respectively, showing equivalence between the methods. By the t-test, the comparison of the methods is also considered equivalent because, to the 95% confidence level, the value of t calculated (0.597) is higher than t critical (2.262). Case study 4 Five reference materials are measured one time each, providing the results in Table 6. Table 6. Impact of the sex in b1(ODR) sex
b1(ODR)
0.001
0.0784
0.005
0.0784
0.010
0.0785
0.020
0.0787
0.030
0.0790
0.040
0.0795
Considering the variance ratio between each MR and the x-axis as 10%, the b1(ODR) coefficient can be estimated by b1(OLS) regression and calculated using Equation 19 as follows:
Vol. 36, No. 6
Least squares regression with errors in both variables: case studies
b1(ODR) = 444.59
.
CONCLUSIONS From the studied examples, it was possible to observe that when the errors involving x-axis data can be considered metrologically negligible, one should apply the OLS. Otherwise, the ODR should be used. It should be emphasized that the difference between the ODR and OLS results significantly increases in proportion to different ratios of . Furthermore, classical comparison between the methods must be done by the ODR rather than the t-test owing to errors residing in both axes. There is a need to evaluate the impact of error in the x-axis data before performing linear regression because the inadequate application of regression may lead to substantially different conclusions. REFERENCES 1. Tellinghuisen, J.; The Analyst 2010, 135, 1961. 2. Synek, V.; Accred. Qual. Assur. 2001, 6, 360. 3. Miller, J. N., Miller, J. C.; Statistics and Chemometrics for Analytical Chemistry, 4th ed., Prentice Hall: Harlow, UK, 2000. 4. Martinez, A.; Riu, J.; Ruis, F. X.; Chemom. Intell. Lab. Syst. 2000, 54, 61.
889
5. Boggs, P. T.; Spiegelman, C. H.; Donaldson, J. R.; Schnabel, R. B.; J. Econometrics 1988, 38,169 . 6. Massart, D. L.; Vandeginste, B. G. M.; Buydens, S. J.; Lewi, P. J.; Smeyers-Verbeke, J.; Handbook of Chemometrics and Qualimetrics: Parte A, Elsevier: Amsterdam, 1997. 7. Cornbleet, P. J.; Gochman; N.; Clin. Chem. 1979, 25, 432. 8. Poch, J.; Villaescusa, I.; J. Chem. Eng. 2012, 57, 490. 9. Kane, M.; Mroch, A.; Appl. Meas. Educ. 2010, 23, 215. 10. Riu, J.; Rius, F. X.; J. Chemom. 1995, 9, 343. 11. Riu, J.; Rius, F. X.; Anal. Chem. 1996, 68, 1851. 12. Sousa, J. A.; Reynolds, A. M.; Ribeiro, A. S.; Accred. Qual. Assur. 2012, 17, 207. 13. Danzer, K.; Wagner, M.; Fischbacher, C.; Fresenius J. Anal. Chem. 1995, 352, 407. 14. Garthwaite, P. H.; Jolliffe, I. T.; Jones, B.; Statistical Inference, Prentice Hall International Limited: UK, 1995. 15. Wienold, J.; Traub, H.; Lange, L.; Giray, T.; Recknagel, S.; Kipphardt, H.; Matschat, R.; Panne, U.; J. Anal. At. Spectrom., 2009, 24, 1570. 16. Mandel, J.; J. Qual. Techn. 1984, 16, 1. 17. Mandel, J.; The Statistical Analysis of Experimental Data, Dover Publications: New York, 1964. 18. March, J. G.; Simonet, B. M.; Grases, F.; Analyst 1999, 124, 897. 19. Oliveira, E. C.; Monteiro, M. I. C.; Pontes, F. V. M.; Almeida, M. D.; Carneiro, M. C.; Silva, L. I. D.; Neto, A. A.; J. AOAC Int. 2012, 95, 560. 20. Mannino, S.; Analyst 1982, 107, 1466. 21. Oliveira, E. C.; Muller, E. I.; Abad, F.; Dallarosa, J.; Adriano, C. Quim. Nova 2010, 33, 984.