Data compression refers to the process of reducing the amount of data required
... •Data redundancy is the central concept in image compression and can be.
EE-583: Digital Image Processing
Image Compression Compression Fundamentals • Data compression refers to the process of reducing the amount of data required to represent given quantity of information. •Note that data and information are not the same. Data refers to the means by which the information is conveyed. •Various amounts of data can represent the same amount of information. •Sometimes the given data contains some data which has no relevant information, or restates/repeats the known information. It is thus said to contain data redundancy. •Data redundancy is the central concept in image compression and can be mathematically defined.
Prepared By: Dr. Hasan Demirel, PhD
EE-583: Digital Image Processing
Image Compression Compression Fundamentals • Information versus Data
REDUNDANT DATA IMAGE
INFORMATION
IMAGE = INFORMATION + REDUNDANT DATA Prepared By: Dr. Hasan Demirel, PhD
EE-583: Digital Image Processing
Image Compression Compression Fundamentals •Given n1 and n2 denoting the information-carrying units in two data sets that represent the same information/image. •The Relative data redundancy RD of the first data set, n1 ,is defined by:
1 RD 1 CR •CR refers to the compression ratio and is defined by:
n1 CR n2
•If n1 = n2 , then CR=1 and RD=0, indicating that the first representation of the information contains no redundant data. •A typical compression ratio around 10 or(10:1) indicates that 90% (RD=0.9) of the data in the first data set is redundant.
Prepared By: Dr. Hasan Demirel, PhD
EE-583: Digital Image Processing
Image Compression Data Redundancy •There are three main data redundancies used in image compression. •Coding redundancy •Interpixel redundancy •Psychovisual redundancy • Coding Redundancy : A code is a system of symbols (i.e. bytes, bits) that represents information. Each piece of information is represented by a set of code symbols. •The gray level histogram of an image can be used in construction of codes to reduce the data used to represent it. Given the normalized histogram of a gray level image where,
nk pr (rk ) n
k 0,1, 2,...., L 1
• rk is the pixel values defined in the interval [0,1] and pr(k) is the probability of occurrence of rk. L is the number of gray levels. nk is the number of times that kth gray level appears and n is the total number of pixels. Prepared By: Dr. Hasan Demirel, PhD
EE-583: Digital Image Processing
Image Compression Data Redundancy •Coding Redundancy •Average number of bits required to represent each pixel is given by: L 1
Lavg l (rk ) pr (rk ) k 1
•Where, l(rk) is the number of bits used to represent each value of rk. •An 8 gray level image has the following gray level distribution.
8 gray levels
Fixed 3-bit code
Variable length code Prepared By: Dr. Hasan Demirel, PhD
EE-583: Digital Image Processing
Image Compression Data Redundancy •Coding Redundancy •The average number of bit used for fixed 3-bit code: 7
7
k 0
k 0
Lavg l1 (rk ) pr (rk ) 3 pr (rk ) 3.1 3 bits •The average number of bits used for variable-length code in this particular example: 7
Lavg
l (r ) p (r ) 2(0.19) 2(0.25) 2(0.21) 1
k
r
k
k 0
3(0.16) 4(0.08) 5(0.06) 6(0.03) 6(0.02) 2.7bits •The compression ratio:
3 CR 1.11 2.7
•The relative Data Redundancy: R 1 D
1 0.099 ~ %10 1.11
Prepared By: Dr. Hasan Demirel, PhD
EE-583: Digital Image Processing
Image Compression Data Redundancy •Coding Redundancy •In this example the suggested variable-length coding gets rid of the ~10% redundant data of the fixed 3-bit code. •The following graph shows the relationship between the histogram of an image, pr(rk) and l2(rk) which are inversely proportional. •The shortest code words are assigned to the most frequent (high probability) gray levels •The longest code words are assigned to the least frequent (low probability) gray levels Data compression is achieved by assigning fewer bits to more probable gray levels than the less probable gray levels.
Prepared By: Dr. Hasan Demirel, PhD
EE-583: Digital Image Processing
Image Compression Data Redundancy •Interpixel Redundancy •This type of redundancy is related with the interpixel correlations within an image. •Much of the visual contribution of a single pixel is redundant and can be guessed from the values of its neighbors. •Given a 1024x343 binary image •Consider a line crossing the image at line 100 •The respective line of 1024 bits can be represented by the Run-length code given at the bottom. •Note that in this line there is 8 regions that are 1 or 0 with the specified run-length. Total of 11 bits (1 bit for thresholded value and 10 bit for the run length) can be used to represent each of these 8 neighborhoods.
Line 100: (1,63)(0,87)(1,37)(0,5)(1,4)(0,556)(1,62)(0,210)
Prepared By: Dr. Hasan Demirel, PhD
EE-583: Digital Image Processing
Image Compression Data Redundancy •Interpixel Redundancy •The resulting compression ratio and respective relative redundancy is given by: 1-bit for each pixel
(1024)(343)(1) CR 2.63 (12166)(11) Determined by thresholding each line and counting the run-length regions
1 RD 1 0.62 2.63 •The relative redundancy is %62 obtained only by using correlation among the pixels (interpixel dependencies) in the given image. •This method can be extended to gray level images. Prepared By: Dr. Hasan Demirel, PhD
EE-583: Digital Image Processing
Image Compression Data Redundancy •Psychovisual Redundancy •Certain information has relatively less importance for the quality of image perception. This information is said to be psychovisually redundant. •Unlike coding and interpixel redundancies, the psychovisual redundancy is related with the real/quantifiable visual information. Its elimination results a loss of quantitative information. However psychovisually the loss is negligible. •Removing this type of redundancy is a lossy process and the lost information cannot be recovered. •The method used to remove this type of redundancy is called quantization which means the mapping of a broad range of input values to a limited number of output values.
Prepared By: Dr. Hasan Demirel, PhD
EE-583: Digital Image Processing
Image Compression Data Redundancy •Psychovisual Redundancy •The following example shows how an 8-bit image can be reduced to 4-bit image.
8-bit image
4-bit image Uniform quantization Undesired contouring effect
4-bit image IGS quantization No contouring effect Prepared By: Dr. Hasan Demirel, PhD
EE-583: Digital Image Processing
Image Compression Data Redundancy •Psychovisual Redundancy •The improved gray-scale quantization (IGS) is one of the possible quantization procedures and summarized in the following table.
Add Add
•The IGS Quantization Procedure: •Add the Least Significant Nibble (4 bits) of the previous sum to the current 8-bit pixel value. •If the MSN of a given 8-bit pixel is 11112 than add zero instead. •Declare the Most Significant Nibble of the sum to be the 4-bit IGS code.
Prepared By: Dr. Hasan Demirel, PhD
EE-583: Digital Image Processing
Image Compression Data Redundancy •Quality Measure of a Compressed Image (Fidelity Criteria): •The removal of psychovisual redundancy removes real/quantitative information and provides lossy image compression. •The quality of such images can be evaluated by objective and subjective methods. •The objective quality measures: •The mean-square-error between 2 images (original versus the compressed) eMSE
1 MN
fˆ ( x, y) f ( x, y)
M 1 N 1
2
x 0 y 0
•The root mean-square-error:
eRMSE
1 MN
fˆ ( x, y) f ( x, y)
M 1 N 1
2
x 0 y 0
Prepared By: Dr. Hasan Demirel, PhD
EE-583: Digital Image Processing
Image Compression Data Redundancy •Quality Measure of a Compressed Image: •The objective quality measures: •Peak Signal to Noise Ratio (PSNR) – in decibel (dB): (2 B 1) 2 PSNR 10 log10 eMSE
B is the number of bits used for each pixel. (i.e.8 bits)
( for 8 bit images PSNR 10 log10
(255) 2 255 20 log10 eMSE eRMSE
•The mean-square signal-to-noise-ratio: M 1 N 1
SNRms
fˆ ( x, y)
x 0 y 0 M 1 N 1
x 0 y 0
2
ˆf ( x, y ) f ( x, y ) 2 Prepared By: Dr. Hasan Demirel, PhD
EE-583: Digital Image Processing
Image Compression Data Redundancy • Subjective evaluations used for Image quality rating. • Human observers can be used to provide subjective evaluations.
Prepared By: Dr. Hasan Demirel, PhD
EE-583: Digital Image Processing
Image Compression Image Compression Models •The Source Encoder and Decoder:
•The Source Encoder reduces/eliminates any coding, interpixel or psychovisual redundancies. The Source Encoder contains 3 processes: •Mapper: Transforms the image into array of coefficients reducing interpixel redundancies. This is a reversible process which is not lossy. •Quantizer: This process reduces the accuracy and hence psychovisual redundancies of a given image. This process is irreversible and therefore lossy. •Symbol Encoder: This is the source encoding process where fixed or variable-length code is used to represent mapped and quantized data sets. This is a reversible process (not lossy). Removes coding redundancy by Prepared By: Dr. Hasan Demirel, PhD assigning shortest codes for the most frequently occurring output values.
EE-583: Digital Image Processing
Image Compression Image Compression Models •The Source Encoder and Decoder:
•The Source Decoder contains two components. •Symbol Decoder: This is the inverse of the symbol encoder and reverse of the variable-length coding is applied. •Inverse Mapper : Inverse of the removal of the interpixel redundancy. •The only lossy element is the Quantizer which removes the psychovisual redundancies causing irreversible loss. Every Lossy Compression methods contains the quantizer module. •If error-free compression is desired the quantizer module is removed. Prepared By: Dr. Hasan Demirel, PhD
EE-583: Digital Image Processing
Image Compression Information Theory-Entropy •Measuring Information: The information in an image can be modeled as a probabilistic process, where we first develop a statistical model of the image generation process. The information content (entropy) can be estimated based on this model. •The information per source (symbol or pixel), which is also referred as entropy is calculated by: J
E P(a j ) log P(a j ) j 1
•Where P(aj) refers to the source symbol/pixel probabilities. J refers to the number of symbols or different pixel values. •For example, given the following Image segment: 21
21
21
95
169
243
243
243
21
21
21
95
169
243
243
243
21
21
21
95
169
243
243
243
21
21
21
95
169
243
243
243
Prepared By: Dr. Hasan Demirel, PhD
EE-583: Digital Image Processing
Image Compression Information Theory-Entropy •Measuring Information: The entropy of the given 8-bit image segment can be calculated by: Gray Level
Count
Probability
21
12
3/8
95
4
1/8
169
4
1/8
243
12
3/8
•The entropy of this image is calculated by: J
E P(a j ) log P(a j ) [(3 / 8) log( 3 / 8) (1 / 8) log(1 / 8) j 1
(1 / 8) log(1 / 8) (3 / 8) log( 3 / 8)] 1.81 bits / pixel (bps)
Prepared By: Dr. Hasan Demirel, PhD
EE-583: Digital Image Processing
Image Compression Error-Free Compression •Error-free compression is generally composed of two relatively independent operations: (1) reduce the interpixel redundancies and (2) introduce a coding method to reduce the coding redundancies. •The coding redundancy can be minimized by using a variable-length coding method where the shortest codes are assigned to most probable gray levels. •The most popular variable-length coding method is the Huffman Coding. •Huffman Coding: The Huffman coding involves the following 2 steps. •1) Create a series of source reductions by ordering the probabilities of the symbols and combining the lowest probability symbols into a single symbol and replace in the next source reduction. •2) Code each reduced source starting with the smallest source and working back to the original source. Use 0 and 1 to code the simplest 2 symbol source.
Prepared By: Dr. Hasan Demirel, PhD
EE-583: Digital Image Processing
Image Compression Error-Free Compression •Huffman Coding: 1) Huffman source reductions: ai’s corresponds to the available gray levels in a given image.
2) Huffman code assignments:
The first code assignment is done for a2 with the highest probability and the last assignments are done for a3 and a5 with the lowest probabilities.
First code
Last code
Prepared By: Dr. Hasan Demirel, PhD
EE-583: Digital Image Processing
Image Compression Error-Free Compression •Huffman Coding: Note that the shortest codeword (1) is given for the symbol/pixel with the highest probability (a2). The longest codeword (01011) is given for the symbol/pixel with the lowest probability (a5). •The average length of the code is given by:
Lavg (0.4)(1) (0.3)(2) (0.1)(3) (0.1)(4) (0.06)(5) (0.04)(5) 2.2 bits / symbol •The entropy of the source is given by: J
E P(a j ) log P(a j ) 2.14 bits / symbol. j 1
•The resulting Huffman coding efficiency is %97.3 (2.14/2.2). Note that Huffman Coding is not optimal and many more efficient versions of it as well as other variable-length coding methods can be used. Prepared By: Dr. Hasan Demirel, PhD
EE-583: Digital Image Processing
Image Compression Lossy Compression • Unlike the error-free compression, lossy encoding is based on the concept of compromising the accuracy of the reconstructed image in exchange for increased compression. •The lossy compression method produces distortion which is irreversible. On the other hand, very high compression ratios ranging between 10:1 to 50:1 can be achieved with visually indistinguishable from the original. The error-free methods rarely give results more than 3:1. •Transform Coding: Transform coding is the most popular lossy image compression method which operates directly on the pixels of an image. • The method uses a reversible transform (i.e. Fourier, Cosine transform) to map the image into a set of transform coefficients which are then quantized and coded. •The goal of the transformation is to decorrelate the pixels of a given image block such the most of the information is packed into smallest number of transform coefficients. Prepared By: Dr. Hasan Demirel, PhD
EE-583: Digital Image Processing
Image Compression Lossy Compression •Transform Coding:
A Transform Coding System: encoder and decoder.
•Transform Selection: The system is based on discrete 2D transforms. The choice of a transform in a given application depends on the amount of the reconstruction error that can be tolerated and computational resources available. •Consider an NxN image f(x,y), where the forward discrete transform T(u,v) is given by: N 1 N 1
T (u, v) f ( x, y) g ( x, y, u, v) x 0 y 0
•For u, v=0,1,2,3,..,N-1. Prepared By: Dr. Hasan Demirel, PhD
EE-583: Digital Image Processing
Image Compression Lossy Compression •Transform Selection : •The inverse transform is defined by: N 1 N 1
f ( x, y ) T (u, v)h( x, y, u, v) u 0 v 0
• The g(x,y,u,v) and h(x,y,u,v) are called the forward and inverse transformation kernels respectively. •The most well known transform kernel pair is the Discrete Fourier Transform (DFT) pair:
1 g ( x, y, u, v) 2 e j 2 (uxvy ) / N N
h( x, y, u, v) e j 2 (uxvy ) / N
and
• Another computationally simpler transformation is called the Walsh-Hadamard Transform (WHT), which is derived from the following identical kernels: m1
bi ( x ) pi (u )bi ( y ) pi ( v ) 1 g ( x, y, u, v) h( x, y, u, v) (1) i0 N Prepared By: Dr. Hasan Demirel, PhD
EE-583: Digital Image Processing
Image Compression Lossy Compression •Transform Selection : •In WHT, N=2m. The summation in the exponent is performed in modulo 2 arithmetic and bk(z) is the kth bit (from right to left) in the binary representation of z. •For example if m=3 and z=6 (1102), then b0(z)=0, b1(z)=1, b2(z)=1. Then the pi(u) values are computed by:
p0 (u ) bm 1 (u ) p1 (u ) bm 1 (u ) bm 2 (u ) p2 (u ) bm 2 (u ) bm 3 (u ) pm 1 (u ) b1 (u ) b0 (u ) • The sums are performed in modulo 2 arithmetic. The pi(v) values are computed similarly. Prepared By: Dr. Hasan Demirel, PhD
EE-583: Digital Image Processing
Image Compression Lossy Compression •Transform Selection : •Unlike the kernels of DFT , which are the sums of the sines and cosines, the Wlash-Hadamard kernels consists of alternating plus and minus 1’s arranged in a checkboard pattern. • Each block consists of 4x4=16 elements (n=4). White denotes +1 and black denotes -1.
•When u=v=0 g(x,y,0,0) for x,y=0,1,2,3. All values are +1. •The importance of WHT is its simplicity of its implementation. All kernel values are +1 or -1.
Prepared By: Dr. Hasan Demirel, PhD
EE-583: Digital Image Processing
Image Compression Lossy Compression •Transform Selection : •One of the most frequently used transformation for image compression is the discrete cosine transform (DCT). The kernels pairs are equal and given by:
(2 x 1)u (2 y 1)v g ( x, y, u, v) h( x, y, u, v) (u ) cos cos 2N 2N 1 •Where, for u 0 (u ) N 2 for u 1,2,..., N 1 N (v) • (v) is similarly determined. Unlike WHT the values of g are not integer values (-1 and +1), the DCT contains intermediate gray level values.
Prepared By: Dr. Hasan Demirel, PhD
EE-583: Digital Image Processing
Image Compression Lossy Compression •Transform Selection : •discrete cosine transform (DCT). The g(x,y,u,v) kernels (basis images) for N=4 is given below.
DC Component
High frequency Basis images Low frequency Basis images
Prepared By: Dr. Hasan Demirel, PhD
EE-583: Digital Image Processing
Image Compression Lossy Compression •Transform Selection : Given a 512x512 image . The image is divided into 8x8 sub-images and the respective transforms are applied. After truncating 50% of the transform coefficients and inverse transformation the following results are obtained for DFT, WHT and DCT. •Note that the first 32 coefficients with lowest magnitudes are eliminated/truncated. DFT based reconstruction and error image, erms=1.28
WHT based reconstruction and error image, erms=0.86
•Their contribution to the image is small and this causes some error on the reconstructed image. •DCT is the best among the given 3 transforms where DCT better describes the image than the WHT.
•DFT causes blocking artifacts at the borders which makes it worse than the DCT. Furthermore, DFT uses complex DCT based reconstruction and coefficients that is more computationally error image, erms=0.68 expensive to implement. Prepared By: Dr. Hasan Demirel, PhD
EE-583: Digital Image Processing
Image Compression DCT-based JPEG (Joint Photographic Expert Group) Standard
Original image
8X8 DCT
Quantizer
Coefficients-to-Symbols Map
Entropy Coder
Compressed image
Encoder
Prepared By: Dr. Hasan Demirel, PhD
EE-583: Digital Image Processing
Image Compression DCT-based JPEG Standard Consider the following 8-bit image with size 512 x 512 pixels.
Prepared By: Dr. Hasan Demirel, PhD
EE-583: Digital Image Processing Image Close-up
Image Compression
Block to be studied
DCT-based JPEG Standard
8x8 Block to be processed
Prepared By: Dr. Hasan Demirel, PhD
EE-583: Digital Image Processing Image Close-up
Block to be studied
Image Compression DCT-based JPEG Standard
Lowest frequency
Hihgest frequency
DCT
69
71
74
76
89
106
111
122
717.6
0.2
0.4
-19.8
-2.1
-6.2
-5.7
-7.6
59
70
61
61
68
76
88
94
-99.0
-35.8
27.4
19.4
-2.6
-3.8
9.0
2.7
82
70
77
67
65
63
57
70
51.8
-60.8
3.9
-11.8
1.9
4.1
1.0
6.4
97
99
87
83
72
72
68
63
30.0
-25.1
-6.7
6.2
-4.4
-10.7
-4.2
-8.0
91
105
90
95
85
84
79
75
22.6
2.7
4.9
3.4
-3.6
8.7
-2.7
0.9
92
110
101
106
100
94
87
93
15.6
4.9
-7.0
1.1
2.3
-2.2
6.6
-1.7
89
113
115
124
113
105
100
110
0.0
5.9
2.3
0.5
5.8
3.1
8.0
4.8
104
110
124
125
107
95
117
116
-0.7
-2.3
-5.2
-1.0
3.6
-0.5
5.1
-0.1
Step 1:Discrete Cosine Transform (DCT) Prepared By: Dr. Hasan Demirel, PhD
EE-583: Digital Image Processing Image Close-up
Block to be studied
Image Compression DCT-based JPEG Standard
Step 2:Quantization Procedure Quantization Matrix 717.6
0.2
0.4
-19.8
-2.1
-6.2
-5.7
-7.6
-99.0
-35.8
27.4
19.4
-2.6
-3.8
9.0
2.7
51.8
-60.8
3.9
-11.8
1.9
4.1
1.0
6.4
30.0
-25.1
-6.7
6.2
-4.4
-10.7
-4.2
-8.0
22.6
2.7
4.9
3.4
-3.6
8.7
-2.7
0.9
15.6
4.9
-7.0
1.1
2.3
-2.2
6.6
-1.7
0.0
5.9
2.3
0.5
5.8
3.1
8.0
4.8
-0.7
-2.3
-5.2
-1.0
3.6
-0.5
5.1
-0.1
Q
16 11 10 16 24
40
51
61
12 12 14 19 26
58
60
55
14 13 16 24 40
57
69
56
14 17 22 29 51
87
80
62
18 22 37 56 68
109 103 77
24 35 55 64 81
104 113 92
49 64 78 87 103 121 120 101 72 92 95 98 112 100 103 99
45
0
0
-1
0
0
0
0
-8
-3
2
1
0
0
0
0
4
-5
0
0
0
0
0
0
2
-1
0
0
0
0
0
0
1
0
0
0
0
0
0
0
1
0
0
0
0
0
0
0
0
0
0
0
0
0
0
0
0
0
0
0
0
0
0
0
Quantized 8x8 block
Prepared By: Dr. Hasan Demirel, PhD
EE-583: Digital Image Processing Image Close-up
Image Compression DCT-based JPEG Standard Step3: Coefficient-to-Symbol Mapping 45
0
0
-1
0
0
0
0
-8
-3
2
1
0
0
0
0
4
-5
0
0
0
0
0
0
2
-1
0
0
0
0
0
0
1
0
0
0
0
0
0
0
1
0
0
0
0
0
0
0
0
0
0
0
0
0
0
0
0
0
0
0
0
0
0
0
Input
Zigzag scan procedure
Result = 45,0,-8,4,-3,0,-1,2,-5,2,1,-1,0,1,0,0,0,0,0,0,1,EOB
EOB symbol denotes the end-of-block condition Prepared By: Dr. Hasan Demirel, PhD
EE-583: Digital Image Processing Image Close-up
Image Compression DCT-based JPEG Standard
Given the symbols below, Result = 45,0,-8,4,-3,0,-1,2,-5,2,1,-1,0,1,0,0,0,0,0,0,1,EOB
Step 4: Entropy Coding • Symbols are encoded using mostly Huffman coding. • Huffman coding is a method of variable length coding in which shorter codewords are assigned to the more frequently occurring symbols.
1110101101 010 1011000 ……………..…………1010
Prepared By: Dr. Hasan Demirel, PhD
EE-583: Digital Image Processing Image Close-up
Image Compression DCT-based JPEG Standard •Once the encoded file is received the decoding is the inverse process given below.
Compressed image Symbol decoder
Merging 8x8 subimages
Inverse DCT
Decompressed image
Decoder
Prepared By: Dr. Hasan Demirel, PhD
EE-583: Digital Image Processing Image Close-up
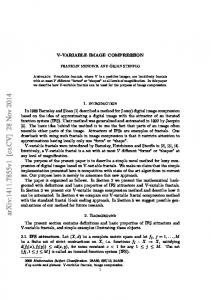
Image Compression DCT-based JPEG Standard •Compressed image examples for changing compression ratios.
Size: 263224Bytes
Size: 5728 Bytes CR = 46
Size: 11956 Bytes CR = 22
Size: 15159 Bytes CR = 17
Size: 18032 Bytes CR = 15
Size: 20922 Bytes CR = 13
Prepared By: Dr. Hasan Demirel, PhD