Lessons Learned From NARCCAP on Archiving Data and Meeting User Needs Seth A. McGinnis, Larry R. McDaniel, and Linda O. Mearns GC21A -0127
ISSE, National Center for Atmospheric Research, Boulder, CO email:
[email protected]
website: http://www.narccap.ucar.edu
LESSONS LEARNED
ABSTRACT The North American Regional Climate Change Assessment Program (NARCCAP) is an international program to produce high resolution climate change scenarios and investigate uncertainties in regional scale projections of future climate by nesting multiple regional climate models (RCMs) within multiple atmosphere-ocean general circulation models (AOGCMs) forced with the A2 SRES scenario over a domain covering the conterminous United States and most of Canada. The resulting datasets will total more than 40 terabytes in size and must be archived for distributed storage and made available to global change impacts researchers worldwide via the Earth System Grid (ESG). This presentation will describe the steps necessary to accomplish these geoscience data management goals and lessons we have learned along the way about handling such an enormous flux of data, maintaining its quality and integrity, and ensuring that the final product is usable by the impacts community, GIS practitioners, climate analysts, modelers, policy-makers, and other end users. The importance of data formats, metadata standards, and flexible tools for visualization, checking, and automation will be discussed, as well as social and other significant factors.
HOW MUCH DATA IS IT? Communicate 15 RCM/GCM combinations + 6 NCEP-driven runs
Communication is a large source of friction in a collaborative endeavor. Because it's extra work, it gets neglected, and silence is often taken to mean 'no progress'. Shared information can prevent different groups from encountering the same problems. No matter how much communication you're doing, you will probably benefit from more.
31 2-D fields + 7 3-D fields @ 42 pressure levels 50-km horizontal resolution = ~20,000 gridcells 25 years x 3-hourly data = ~73,000 timesteps 4 bytes per floating-point value, plus overhead x__________________________________________
~40 terabytes That doesn't include static fields, daily values like Tmax, or data from the timeslice experiments in which two of the GCMs are run at 50-km resolution. (The timeslice datasets are archived separately.) 40 TB is about twice the size of the entire Library of Congress, which has more than 134 million items on approximately 530 miles of bookshelves.
Learn From the Past
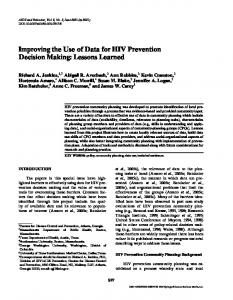
THIS PICTURE IS WORTH 3.68e+08 WORDS This 24-year climatology plot summarizes 1.4 GB of seasonal precipitation data from the RegCM3 regional model. Calculating climatology is mathematically simple, but requires a very large volume of data.
The simulation element of NARCCAP involves driving 6 different RCMs with 4 different AOGCMs and NCEP historical reanalysis data. Due to funding constraints, not all RCM/GCM combinations will be explored, but the resulting data will still total more than 40 TB in size.
NCEP MM5
GFDL
CGCM3
X
RegCM3
X
CRCM
X
X
X
X
RSM
X
X
WRF
X
X
CCSM
X
X
X X
PRECIS
HADCM3
X
X X
X X
X
X
The authors are contributing to this effort primarily through high-level project management and supervision (Mearns) and through QC of the data as it is submitted for archiving (McGinnis & McDaniel). 'QC' stands for 'quality checking' and means checking that the format of the data meets the requirements set forth in the project documentation and ensuring data integrity: checking that the contents of each file match the filename, making sure that the data was not corrupted in transit, that there are no blatant mathematical errors, and so on.
The general architecture of the NARCCAP data submission and archiving process is as follows: The modeling groups submit a set of initial sample output files to the NARCCAP team at Iowa State (Gutowski, Arritt, Flory, et al). The Iowa State team checks that the data is properly formatted (CF-compliant NetCDF), makes physical sense, and so on, hashing out the details with the modeling teams. Once a team is approved by Iowa State, they can begin submitting their data for archiving. When a modeling group has generated the data for one of the runs and are ready to submit, they notify the data management team at LLNL, which ships a 1-TB hard drive to them. The modeling group loads the data onto the hard drive and ships it back to LLNL. The data management team copies the data (an unpublished 'dark copy') to the NERSC HPSS for disaster recovery purposes, and then makes the data available to the NCAR-based QC team. QC checks that the data meets requirements by running automated format analysis tools and plotting sample data from each file. The outputs are checked by hand, and if everything is correct, the data is archived and published. If the data is not correct, the QC team will either correct the data before archiving (in the case of minor metadata errors that can be easily rectified) or notifies the modeling group of the problem and asks them to resubmit (in the case of extensive or complex errors). When a dataset is ready, the NCAR data management team moves the data if necessary (the first 10 TB of data will be served from NCAR machines, the remainder from LLNL), makes an archival copy on the NCAR Mass Store, and readies the data for publishing. The data is then published into the ESG (Earth System Grid) web service and made available for public consumption.
Planning Is Hard Factors that increase the difficulty of planning include the democratic nature of multi-organizational collaboration, number of people involved, and distance between participants. The more people involved remotely in a decision, the longer it will take. When possible, aim for the minimal set of participants necessary in decisionmaking meetings and save larger meetings for coordination and information dissemination to speed things up.
THE ARCHIVING PIPELINE BACKGROUND
Offload as much of the design process as possible by learning from and adapting similar projects in the past. NARCCAP was strongly influenced by the PRUDENCE project and by the CMIP3 AR4 archive. Taking to heart their lessons allowed us to avoid similar problems.
Plan For Errors and Change Errors and oversights will occur. Your plan must be adaptable to accommodate them. There will also be aspects of the plan that cannot be decided in advance because of insufficient information. No plan will be perfect; make sure that improvement does not stand in the way of completion.
Do A Test Run First
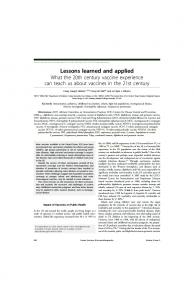
AUTOMATED ANALYSIS A plot of the last timestep in a datafile, generated by automated QC tools. Visualization is oriented toward finding problems rather than looking good.
It's important to run a set of sample data through the entire checking and archiving process before data begins to pour in. Many issues cannot be resolved until real data is sent through the system.
Automate and Genericize
Use A Standard
It's A Social Problem, Too
The only way to handle massive data effectively is to automate everything you can. Whenever possible, create generic tools that can be reused. Human attention is your most precious resource; minimize its use. One hidden advantage of automated tools is that they stop working when they encounter something out of the ordinary -- this is often the first clue that something is wrong with the data.
The single most important sentence in the whole NARCCAP proposal is the one that specifies data will be in CF-compliant NetCDF format. A standard ensures consistency and resolves questions about formatting, and an established standard lets you to take advantage of standardsaware tools: the cf-checker python script from the UK Met Office does extensive format testing, and CF-compliance give you GIS integration for free.
A large collaboration is as much a social problem as it is a technical one. Success requires coordinating the activities of people at different institutions with varied levels of involvement and areas of interest. Scientists are people, too, and successful communication requires tact, diplomacy, and courtesy. People are more productive when they feel liked, respected, and appreciated. If you ruffle someone's feathers, don't hesitate to apologize.
Use Advanced Tools Programs and programming languages vary in sophistication. Use the most advanced tools you can to minimize human effort. For example, NCL allows string substitution in variable names, a powerful construct not present in all languages that makes it much easier to write generic scripts. Likewise, NCL understands NetCDF, and can automatically handle issues like map projection if metadata is properly defined.
Don't Touch the Originals Because mistakes are inevitable, it's important to be able to undo or replicate any sequence of changes. Keep a pristine, untouched copy of the data in its original form. This principle can be extended: it's better to create changed copies of files than to transform in-place. There are practical limits due to storage space, processor speed, and so on, but preservation of an untouched original should be absolute.
Know When To Procrastinate The list of useful tools is infinitely extensible. Conserve your efforts. Don't work on tools prematurely; wait until you understand the needs being addressed clearly before you begin. Requirements and constraints change, and you can waste a lot of time working too far ahead.
All Your Timetables Are Wrong Even if you plan for the effects of errors, distance, coordination, and miscellaneous unanticipated delays, everything will take much longer than you expect it to.
Speak the User's Language Many end users have limited understanding of climate modeling conventions. High-quality metadata and a usable file format are essential. Some users will need even greater support; to meet the needs of the impacts community, data needs to be preaggregated in plain text format. Usability concerns also extend to the data provision. For example, translation tables need to exist that allow non-modelers to discover that temperature files are named 'tas' for 'temperature at surface'.
Enlist Test Users A test user is provided preliminary versions of data for use in research. Test users understand how data is actually used. Within their areas of interest, they know what data should look like, details of modeling, and how users approach data acquisition. Good test users are motivated and proactive: our user Nadine Salzmann acquired datasets that we eventually used to develop our testing suite.
Share Preliminary Data Within the project, the more people with access to preliminary results the better. Early samples let people start development sooner, shortening the time it takes to build the whole pipeline. The more people there are looking at the data, the more problems are likely to be spotted.
Spheres Are Inconvenient The Earth is round; data arrays are rectangular. You need a map projection to fit them together. Every model has one, but most modelers don't deal with it and have no reason to understand it in depth. Map projections are complicated and confusing, and you have to understand them to check data. Even if they are nominally the same, no two models will really have identical domains unless they use the same projection.
Visualize in the Raw When plotting data for testing, you want the visualization to be as close to the underlying representation as possible to make it easier to spot problems. Make plots accurate, not pretty. Plot raster data in raster format. Use a range that runs from min to max, not a 'reasonable' range that hides anomalous extremes.
Nobody Knows Everything Everyone involved in a large project will understand their piece of the puzzle, but nobody will be an expert in everything. Areas of overlap are where the most friction occurs. For example, modelers may be asked to generate metadata even though they are unfamiliar with it.
Don’t Panic Quality-checking 40 TB is a daunting prospect and can lead to feelings of dread and terror at the sheer volume of data. The trick is not to try and tackle it all at once. Pace yourself, take small bites, and just keep going.