Also, we would like to thank the SWIFT project management and Darryl Lakins,. Head of Code .... Failed IOS and/or AOL. Devices were continued through the ...
Lessons Learned from Screening and Qualification of COTS PEMs for a Space Project A. Teverovsky, B. Meinhold*, C. Greenwell, F. Felt, G. Kiernan Parts, Packaging, and Assembly Technologies Office, Code 562, GSFC/ QSS Group, Inc. *Jackson and Tull
Acknowledgements The authors would like to acknowledge GSFC Parts Engineering and Parts Testing Groups, and in particular, Ashok Sharma and Vinod Patel for their assistance and stimulating discussions of test results. Also, we would like to thank the SWIFT project management and Darryl Lakins, Head of Code 562, for support of this work. CMSE’04
2
Purpose and Outline Purpose: To discuss results of screening and qualification of more than 32,000 plastic parts of 28 different types. Outline: Statistics of parts used. Results of DPA. Screening: Burn-in. Screening: Acoustic microscopy. Qualification: SMT simulation. Qualification: HAST results. Analysis of revealed problems. CMSE’04
3
Statistics of PEMs Used Package types SOIC-16 D2Pak SOIC-5 8uMAX uSOIC16 SOIC-28 SOT-23-3 SOT-23-5 SOT223 SOIC-8
5 5 1 1 2 1 1 1 1 10
Seven out of 10 parts in SOIC8 had silicone die coating CMSE’04
Manufacturers 5 Part Types 28 Pack. types 10 Lots 44 Total QTY 32,700 Part types Power devices
6
Linear devices (comparators, Vref., opamps)
Mixed signal (ADC, DAC, switches)
19
3
Manufacturers AD LT On Semi MAXIM IR
15 2 1 4 6 4
DPA Results Out of 44 lots: – 4 failed due to metallization step coverage. – 3 failed due to delaminations in critical areas. 9 lots had delaminations in non-critical areas. All power HEXFETs in TO-220 style packages had no glassivation on the die surface. Transistors that failed metallization step coverage “successfully” passed BI with no-load conditions (HTRB: 150 oC/48hr VGS=-24V, VDS=0; Steady BI: 150 oC/168hr VDS=24V, VGS=-12V). However, current density calculations allowed acceptance of the lot.
DPA should precede S&Q testing. The test flow and conditions should address the revealed anomalies and intended applications. CMSE’04
5
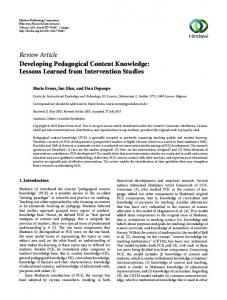
Initial Electrical Measurements Distribution of initial EM failures frequency, %
100 80 60
3-σ process
40 20 0 0 0.3 0.5 1
2
3
4
5 >5
failures in a lot, %
Example of param. distribution fr e q u e n c y , %
30 25 data 20 calc 15 Limit 10 5 0 -0.5 -0.4 -0.3 -0.2 -0.1 0.0 0.1 0.2 0.3
11 out of 28 part types had > 0.27% failures (mostly parametric). Most manufacturers declare at minimum a 3sigma-level process. Excessive fallouts might indicate poor lot quality, problems with testing, or margins that are too tight.
Market-driven philosophy forces manufacturers to tighten performance margins.
error gain, % CMSE’04
6
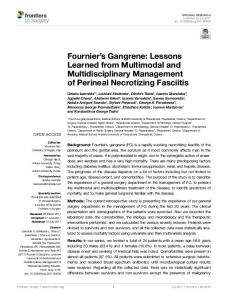
BI Testing Burn-in screening was performed at temperatures from 85 oC to 150 oC on 28 different part types (~32,700 pcs.)
temperature, oC
200
operational
BI
max junction
180 160 140 120 100 80 60
different part types
Tg
Characteristic temperatures of devices and temperatures of BI testing: All parts were tested below Tjmax. 30% of parts were tested above Top (no statistical difference). One part had TBI above Tg of MC.
A methodology to choose BI temperature is needed. CMSE’04
7
BI Statistics
60% of the part types had 0.5% or less of BI failures. A significant proportion of failures was due to relatively minor parametric shifts.
Distribution of BI failures 30 25 frequency, %
28% of the part types had no BI failures.
20 15 10 5 0 0
0.1
0.3
0.5
1
3
5
>5
BI failures, %
5% is a reasonable limit for PDA. Due to tight margins, a delta analysis should be a must for linear devices. CMSE’04
8
Damaging Testing: History Case. Out of 2400 pcs of a mixed-signal PEM 86 parts (3.6%) were rejected initially during screening. All screened devices failed when installed on the board. FA revealed that the parts had excessive leakage currents due to EOS/ESD damage caused by high-voltage spikes generated by ATE. A review of the ATE test program showed that the failing parameters had not ben tested. Inadequate test program failed to catch the problem. Even established test labs can make serious mistakes. The algorithm of ATE programs should be inspected to catch mistaken test conditions or missed tests. CMSE’04
9
Screening: Effect of DC Different date codes for COTS parts do not necessarily mean different wafer lots. DC/ (QTY)
0031 (2407)
LAB LAB1 Gr I_1 Gr I_2 Gr I_3 Gr I_4 Gr I_5
average
2.33 LAB1 Gr II_1 Gr II_2
0128 (988) average 0128 LAB2 (600)
lost damaged damaged during during during screen, % screen, % AM, % 0.12 1.63 0.00 0.62 1.22 0.00 0.00 1.02 1.02 0.21 2.04 1.43 0.20 1.74 1.30 1.32 0.00 1.44 0.75 0.15 0.51 0.40 0.61 0.61 0.20 0.00 0.00 0.20 0.00 0.31 0.41 0.20 0.00
failed init failed EM, % after BI, %
0.00 0.00
SOT-23 package
0.67
Different date codes might indicate different quality. Small parts are easy to damage during electrical testing or AM CMSE’04
10
Screening: Effect of DC Cont’d. DC / (QTY)
0019/ (4988)
0029/ (2065)
Group Gr I_1 Gr I_2 Gr I_3 Gr I_4 Gr I_5 Gr I_6 Gr I_7 Gr I_8 Gr I_9 average Gr II_1 Gr II_2 Gr II_3 Gr II_4 average
failed init failed after lost during EM, % BI, % screen, % 3.19 5.66 0.89 0.89 0.53 0.00 0.00 1.61 1.75 0.41 0.89 0.53 1.43 1.23 0.88 0.18 0.46 1.84 0.12 1.11 1.37 0.00 0.36 0.00 0.53 0.00 0.00 0.00 1.80 0.15 0.00 0.67
Date of test
Outliers per Grubbs’ test at significance level of 0.05.
Dec-01
Apr-02
Parts in SOIC-8 packages should not have been damaged easily
Parts with different DC had different BI results. Lost/damaged samples reduce confidence in screening. Statistical analysis might indicate screening problems. CMSE’04
11
Statistics of Screening by Acoustic Microscopy (C-SAM-mode) Six types of power devices (2,775 pcs) in TO-220-style packages and 23 types of low power devices (26,027 pcs) in SOIC-style packages were screened by AM. Rejectable delaminations were observed in 4 out of 6 types of power devices and in 14 out of 23 types of linear devices. The proportion of rejects varied from 2.3% to 28% for power devices and from 0.14% to 83% for low-power devices. The cost of AM is relatively high, up to $4 to $7 per part, even for a large quantity lot. Out of 31,090 parts subjected to screening, 565 (1.8%) were rejected by electrical testing and 3,586 (11.5%) by CSAM. Acoustic microscopy rejected far more parts than did electrical measurements. Are all these rejects potential failures, and if so, what is the confidence in quality of a lot with ~10% rejects? CMSE’04
12
CSAM Rejection Criteria Rejection criteria used: >50% of back-side delaminations (BSD). Any top of die (TOD) or finger tip delaminations. >50% die paddle. More than 2/3L of leads. These criteria are relatively easy to apply in a case like this. QSOP-16 packages: 27/712 had BSD. 11/712 had TOD delaminations.
Finger-tip delaminations are questionable due to the small size of the leads and the package cut. CMSE’04
13
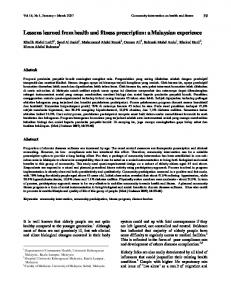
C-SAM Rejection Criteria Cont’d. A large proportion of linear devices in SOIC-8 packages (7 out of 10 tested part types) had silicone die coatings.
Typical AM images of two opamps with die coating.
Most parts with silicone die coating had excessive delaminations at the paddle and finger-tips. Should these lots be rejected? CMSE’04
14
Statistics of SMT Simulation Preconditioning (SMT simulation) was performed per JESD 22-A113. Out of 24 part types 6 had post-SMT failures varying from 1.7 to 53%. Part/Pack.
Qty
Opamp/ SOIC8
60
SMT SMT failures, failures % 1
1.67
Characteristi c of failure
Coments
IOS> 2 nA.
Vref/ SOIC8
120
12
10.00
Parametric shift.
HEXFET/ SOT223
60
1
1.67
VGTH