ERKUT and INGOLFSSON Let's Put the Squares in Least-Squares _____________________________________________________________________________________________
Let's Put the Squares in Least-Squares Erhan Erkut and Armann Ingolfsson Faculty of Business University of Alberta Edmonton, Alberta, Canada T6G 2R6
[email protected] [email protected]
Abstract We offer an interactive spreadsheet to teach simple linear regression, which we have found to be an effective teaching tool. Unlike most textbooks that cover regression, this spreadsheet displays what is being minimized – the squares of the errors – and it allows students to experiment with the parameters of the line before optimizing them. ________________________________________ One of the most frequently used quantitative tools in academics and practice is simple linear regression. Although this topic is usually covered in a first-year introductory statistics course, it is revisited in a number of advanced courses. The task is to find the line of best fit given a twodimensional data set. The usual criterion for this task is “least squares,” namely minimization of the sum of the squared vertical distances between the data points and the line in a scatter plot. This criterion has certain desirable analytical properties, and the choice of this criterion has significant implications in statistics – much of classical statistical theory is based on the use of this measure of goodness of fit. Although most of our students, having taken introductory statistics courses, are familiar with the term “least squares,” many are under the mistaken impression that the method minimizes the sum of the errors as opposed to the sum of the squared errors. We suspect that one of the reasons for this misperception is the inability of statistics textbooks to effectively communicate what is being minimized. The typical statistics textbook contains the sum of the squared errors formula and shows derivation of the parameters of the best-fit line at length. This may be a proper
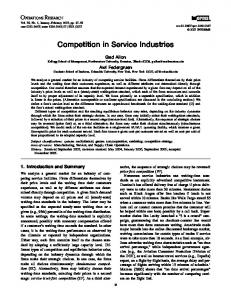
way to communicate with individuals who possess sufficient mathematical maturity. Another, arguably more effective, way (for the average student), is to show the squares of the errors in a graph. Yet a casual search of the statistics textbooks on your bookshelves is unlikely to yield such a graph. It is not that authors of statistics textbooks do not believe in the value of figures – most introductory statistics textbooks have many graphical displays. For example, the chapter or section on simple linear regression almost always contains a figure that is similar to Figure 1, which displays the error associated with one data point graphically. Table 1 contains a variety of textbooks that have such figures. Unfortunately, none of these textbooks contain a figure similar to Figure 2 where the square of an error is displayed – as a square. We believe seeing such a figure helps to motivate the criterion used and makes students less likely to forget what is being minimized. Generally speaking, we believe that visualization is a very powerful pedagogical tool and it ought to be used as often as possible to clarify abstract concepts. Even better than seeing a figure such as Figure 2 is being able to experiment with such a figure, in our view. To this end we offer an interactive spreadsheet (leastquares.xls) that displays the squares of the errors. (We have used a similar sheet in our introductory operations management course since 1995.) The user can influence the size of the squares by changing the intercept and slope of the line. This allows the user to manually fit a line to the data by visually measuring the magnitude of the objective function as parameters are changed. The workbook consist of seven worksheets which offer a convenient pedagogical progression (names of worksheets are in parentheses): 1. Input and display the data points (data) 2. Superimpose an arbitrary line on the scatter diagram (line) 3. Display the resulting error terms (as in Figure 1) (errors) 4. Display the resulting squared-error terms, allow the user to change the intercept and slope and observe the resulting changes in the squares of the errors (as in Figure 2) (squares)—see Fig. 3
47 _____________________________________________________________________________________________ INFORMS Transactions on Education 1:1 (47-50) INFORMS
ERKUT and INGOLFSSON Let's Put the Squares in Least-Squares _____________________________________________________________________________________________
Aczel, A.D. (1995), Statistics, Irwin, Chicago, IL (p. 412, 415, 416) Albright, S.C., W.L. Winston, and C. Zappe (1999), Data Analysis and Decision Making with Microsoft Excel, Duxbury Press, Pacific Grove, CA (p. 576) Berk, K.N. and P. Carey (1995), Data Analysis with Microsoft Excel 5.0 for Windows, Course Technology, Cambridge, MA (p. 170) DeLurgio, S.A. (1998), Forecasting Principles and Applications, Irwin McGraw-Hill, Boston, MA (p. 97) Evans J.R. and D.L. Olson (2000), Statistics, Data Analysis, and Decision Modeling, Prentice Hall, Upper Saddle River, NJ (p. 171) Johnson, R.A. and D. W. Wichern (1997), Business Statistics: Decision Making with Data, John Wiley & Sons, New York, NY (p. 556) Kmenta, J. (1971), Elements of Econometrics, Macmillan, New York, NY (p. 205) Neter J. and W. Wasserman (1974), Applied Linear Statistical Models, Irwin, Homewood, IL (p.41, 78) Neter, J., W. Wasserman, and G.A. Whitmore (1978), Applied Statistics, Allyn and Bacon, Boston MA (p. 450. 452) Pelosi, M.K. and T.M. Sandifer (2000), Doing Statistics for Business with Excel: Data, Inference, and Decision Making, John Wiley & Sons, New York, NY (p. 540) Vaidyanathan, R. and G. Vaidyanathan (2000), Canadian Business Statistics, John Wiley & Sons Canada, Toronto, ON (p. 543) Webster, A.L. (1995), Applied Statistics for Business and Economics, Irwin, Chicago, IL (p. 628, 647) Younger, M.S. (1979), A Handbook for Linear Regression, Duxbury Press, Belmont, CA (p. 25) Table 1: A sample of textbooks that contain a figure similar to Figure 1 but not to Figure 2. 18
18
Y
16
Y
16
14
14
12
12
Y(i)
10 Error(i)
8 6
6
X
0 2
4
Y'(i)
4
2 0
Y(i)
8
Y'(i)
4
Squared Error(i)
10
6
8
10
12
Figure 1: The standard figure that displays an (x, y) scatter, a line that has been fitted to the data, and the error implied by the line for one of the points.
2
X
0 0
2
4
6
8
10
12
Figure 2: A slightly modified version of Figure 1 that displays the square of an error – the quantity that is minimized in the leastsquares line-fit exercise.
48 _____________________________________________________________________________________________ INFORMS Transactions on Education 1:1 (47-50) INFORMS
ERKUT and INGOLFSSON Let's Put the Squares in Least-Squares _____________________________________________________________________________________________ sum of squared errors 1.35 intercept slope -0.3 1.1
6 5 4 3
7
2
210
1 0 -1
0
1
2
3
4
5
6
-1 SSE
Figure 3: The “squares” sheet of the “leastsquares.xls” workbook, which allows the user to experiment with the intercept and the slope of the line using sliders, displays the resulting squared errors on the scatter plot, and the sum of the squared errors in a column chart. 5. Display the objective function contours— “the big picture” (big picture) 6. Allow the user to use the solver to find the optimal parameter values (solver) 7. Worksheets 2 – 5 are locked to prevent unintentional changes, but the seventh worksheet is an unlocked version of the squares worksheet, for students who want to experiment with the “guts” of the model (guts). We think this is a very effective tool for teaching simple linear regression. It allows students to develop an intuitive feel for how least-squares lines are fit to data. Since the data can be changed, the workbook can be used to visualize the effect of outliers, and to illustrate that leastsquares may not be the most appropriate curvefitting criterion in the presence of outliers. The workbook also provides a useful link between statistics and optimization, which are increasingly
taught in the same required course in business schools. Students can explore the feasible region of a two-dimensional convex optimization problem (simple linear regression), guided by a visual representation of the objective function. Once the students learn how to use the solver to fit a line, many can generalize the method to higher dimensions (multiple regression), using a weighted objective function, and fitting a nonlinear curve. This optimization-statistics linkage can both help motivate optimization and greatly expand students’ toolbox for solving statistical problems. We believe that interactive tools such as the workbook we have presented enable types of learning that are impossible with textbooks, and are therefore more effective in teaching line fitting as well as many other topics in statistics. Familiarity, flexibility and reliability make Microsoft Excel a good platform for developing such interactive tools.
49 _____________________________________________________________________________________________ INFORMS Transactions on Education 1:1 (47-50) INFORMS
ERKUT and INGOLFSSON Let's Put the Squares in Least-Squares _____________________________________________________________________________________________
However, there are of course many other platforms that can be used to develop such tools. In particular, a large number of Java applets are available for this purpose, as a quick Internet search for “Least Squares Applet” or “Regression Applet” will reveal. We close with an illustrative (but far from exhaustive) list of such applets. Some words of caution: Depending on when you are reading this, you may or may not be able to find the applet at the indicated URL. Furthermore, some of these applets may not run on your browser, or they may crash your browser. It is interesting to note that even among the 30 or so Java applets we looked at, only three (the first
three on our list) show the squares of the errors. We find this surprising since visualization and interactivity are key concepts when designing Java applets for statistics. Most of the following applets can be considered “least-squares calculators,” where the user enters the data and the applet displays a scatter diagram and reports the optimal parameter values and some other statistics. Some are for educational use where the data cannot be changed, others will accept data from the user. For data entry some allow for point-and-click while others require typing. All fit a line; some also fit nonlinear curves.
http://www.keypress.com/sketchpad/java_gsp/squares.html http://hadm.sph.sc.edu/COURSES/J716/demos/LeastSquares/LeastSquaresDemo.html http://www.duxbury.com/authors/mcclellandg/tiein/howell/reg.htm http://www.physics.csbsju.edu/stats/QF_NROW_form.html http://members.aol.com/johnp71/nonlin.html http://www.math.tamu.edu/FiniteMath/Classes/LeastSquares/LeastSquares.html http://www.glue.umd.edu/~mesam/Lesson2.html http://nimitz.mcs.kent.edu/~blewis/stat/lsq.html http://www.stat.sc.edu/webstat/ http://www3.sympatico.ca/mcomeau/webpublic/javapage/reg/reg.htm http://math.hws.edu/javamath/ryan/Regression.html http://archives.math.utk.edu/visual.calculus/0/curve_fit.4/ http://illuminations.nctm.org/imath/912/LinearRelationships/sindex.html http://www.hofstra.edu/~matscw/newgraph/regressionframes.html http://www.coe.tamu.edu/~strader/math166H/LeastSquares/ls2.html http://www.stat.uiuc.edu/~stat100/java/guess/PPApplet.html http://www.stat.wvu.edu/SRS/Modules/Applets/Regression/regression.html http://www.stat.sc.edu/~west/javahtml/Regression.html http://www.ruf.rice.edu/~lane/stat_sim/reg_by_eye/index.html http://www.math.csusb.edu/faculty/stanton/m262/regress/regress.html http://www.mste.uiuc.edu/activity/regression/ http://www.ee.ndsu.nodak.edu/~phaniraj/java/regression/regression.html http://www.btinternet.com/~endeavour/stats.html http://www.niss.org/~karr/stats/regression1.html http://webphysics.davidson.edu/WebTalks/Applets/Regression/Regression.html http://www.ctc.edu/~tkaupe/211/java/correlate/correlate.htm http://student.stat.wvu.edu/~mfang/stat391b/part2_ie/Two.html http://www.stat.berkeley.edu/~stark/Java/Correlation.htm http://kalamation.com/regression/ For more information on interactive statistics we recommend: •= Interactive Statistics Page: http://members.aol.com/johnp71/javastat.html •= Statistical demonstration Java applets: http://www.csustan.edu/ppa/llg/stat_demos.htm •= Java Applets for Visualization of Statistical Concepts: http://www.kuleuven.ac.be/ucs/java/index.htm 50 _____________________________________________________________________________________________ INFORMS Transactions on Education 1:1 (47-50) INFORMS