We present the novel level of detail interface based on the marriage of level of ... The user navigates the data to bring subsets into focus, giving their representa-.
Proc. ISMAR 2004 (IEEE/ACM Intl. Symp. on Mixed and Augmented Reality), Arlington, VA, Nov. 2-5, 2004
Level of Detail Interfaces Stephen DiVerdi, Tobias H¨ollerer, Richard Schreyer Department of Computer Science University of California, Santa Barbara, CA 93106 {sdiverdi,holl,richards}@cs.ucsb.edu
Abstract We present the novel level of detail interface based on the marriage of level of detail geometry and an adaptable user interface. Level of detail interfaces allow applications to parameterize their display of data and interface widgets with respect to distance from the camera, to best take advantage of diminished screen space in a 3D environment.
1. Introduction For 2D GUI applications, resizing is an infrequent, discrete event with established techniques for adapting to the smaller screen size. Scroll bars are enabled to pan around a larger workspace, and buttons and text can be wrapped to fit the new area. In 3D environments, applications’ screen size is constantly changing as they become closer to or further from the user’s position. The constant and continuous resizing makes 2D interface concepts impractical. Static interfaces are clearly insufficient - an interface designed for an average depth can be much too complex when the application is too far away, or wastefully sparse when the application is near the user. In this paper, we introduce the concept of a level of detail (LOD) interface, a direct extension of the LOD graphics concept [2] into the realm of user interface design. The important insight in LOD graphics is that objects can parameterize their graphical representation as a function of their screen size to present appropriately complex geometry at each size while retaining visual fidelity. Similarly, with LOD interfaces, an application can define separate interfaces associated with different screen sizes, allowing the application to best take advantage of its screen space while maintaining usability. Parameterized representations of applications have been introduced to the AR community previously with level of error filtering [5], which presents registered geometry differently as registration error changes. Only geometry was parameterized – user interfaces remained constant.
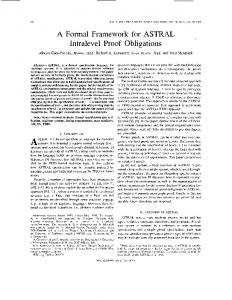
Figure 1. A typical ARWin scene with a variety of applications in a desktop setting. Zoomable interfaces such as the Pad++ system [6, 1, 4] present an interface for multiscale workspaces where data can be represented at very disparate scales. However, to interact with data, the user must first navigate to the appropriate scale, rather than using a modified small-scale interface. For data presentation in 2D interfaces, the Table Lens [7] and Document Lens [8] visualize large data sets by diminishing data outside the region of interest. The user navigates the data to bring subsets into focus, giving their representation more screen space. Unfortunately, diminishing is inappropriate for interface widgets, as they become too small to effectively use. We have implemented our LOD interfaces in our ARWin system [3], a marker-based desktop AR application environment that serves as a foundation for rapid prototyping of applications and interface concepts.
2. Level of Detail Interfaces In 2D interfaces, a window presents scroll bars to the user to allow for panned viewing of a larger virtual workspace, but in 3D a similar standard widget would not
be convenient. However, the application interface could subtly change depending on the level of detail the application is presented with. For complex applications, the interface that is appropriate when the application is near will not necessarily work when the application is far away, because the interface widgets may be too small to interact with. Presenting different interfaces at different levels of detail is an obvious solution. It is important that an interface change be as intuitive as possible, as it may occur at any time and could interfere with productivity if designed carelessly. The easiest mechanism to take advantage of the LOD event is to reduce the amount of geometry or data presented. For applications such as a table of cells in a spreadsheet, removing less important data is reasonable. The spreadsheet may focus in on just the selected rows and columns when far away (as in the Table Lens [7]). Some applications present many buttons and sliders so all the functionality is immediately available, such as a media player. In these cases, it would make sense to reduce the number of widgets displayed by removing the less commonly used functionality. The user would still need some way to access the removed functionality, such as a popup menu or a widget to allow cycling through sets of interfaces.
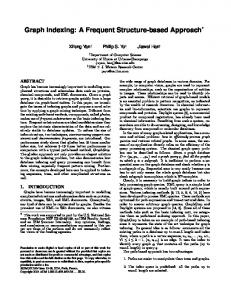
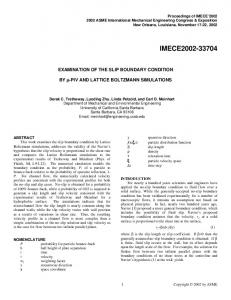
3. Applications To demonstrate the LOD interface, we created analog wall clock and weather station applications (see Figure 2). As the clock is moved away, it is displayed with less visual complexity to maintain readability. The weather station presents a subset of its data and provides a widget (The arrow icon) to cycle through the different subsets. When the clock is moved close to the user, an extra interface widget is revealed to allow the user to set the clock. This reflects a physical clock where a small dial or button requires close inspection to tweak settings. The weather station also adds functionality when viewed closely. The location name is shown, along with a widget to cycle through different locations. This way the user can intuitively enter a preference setting mode by bringing the application close and into focus.
4. Conclusions The contribution of this paper is the introduction of the level of detail interfaces for 3D application design. This technique allows applications to tailor their visual presentation and interface to the various 3D positions they may occupy. More investigation is needed into the user experience with adaptable interfaces. This work is supported in part by NSF IGERT: Graduate Training Program in Interactive Digital Media, award num-
Figure 2. The clock and weather station applications at different levels of detail. ber DGE-0221713, and an equipment donation from Microsoft. Special thanks to Daniel Nurmi and Sotiria Lampoudi.
References [1] B. Bederson and J. Hollan. Pad++: A zooming graphical interface for exploring alternate interface physics. In Proceedings of User Interface and Software Technology, 1994. [2] J. Clark. Hierarchical geometric models for visible surface algorithms. Communications of the ACM, 19(10):547–554, October 1976. [3] S. DiVerdi, D. Nurmi, and T. H¨ollerer. ARWin - a desktop augmented reality window manager. In ISMAR, October 2003. [4] G. Furnas and B. Bederson. Space-scale diagrams: Understanding multiscale interfaces. In SIGCHI, 1995. [5] B. MacIntyre and E. Coelho. Adapting to dynamic registration errors using level of error (LOE) filtering. In ISAR, pages 85–88, 2000. [6] K. Perlin. A multiscale approach to interactive display organization. In Coordination Theory and Collaboration Technology Workshop, 1991. [7] R. Rao and S. Card. Table lens: Merging graphical and symbolic representations in an interactive focus plus context visualization for tabular information. In Proceedings of ACM Conference on Human Factors in Computing Systems, pages 318–322, April 1994. [8] G. Robertson and J. Mackinlay. The document lens. In Proceedings of User Interface and Software Technology, pages 101–108, 1993.