Levels of automation in a simulated failure detection task * Joachim Meyer Department of Industrial Engineering and Management Ben Gurion University Beer Sheva 84105, Israel
[email protected]
Liat Feinshreiher Department of Industrial Engineering and Management Ben Gurion University Beer Sheva 84105, Israel Uein @bgumail.bgu.ac.il
-
[email protected]
system in which the operator performs all actions and an entirely automated system that performs its actions without human interference. At intermediate levels the system suggests actions and the human operator accepts its suggestions.
Abstraet Systems increasingly provide operators with the ability to move between different levels of automation from entirely manual modes. over partly automated modes (in which some task components are performed by the operator) and up to fully automated modes. It is still unclear what determines the relative eficiency of different levels of automation, An experimental system was developed to study these issues. In the system operators had to detect faulty items, based on panial information. Two levels of automation were tested: aided detection (operators received cues from a failure detection system), and approval (operators could change decisions of the failure detection system). An experiment assessed operators’ performance with the different levels of automation and with low and high validiry failure detection systems. Results showed thnt operators adjusted their response to the diagnostic value of the automation. Also, operators responded more strongly to low-validiry cues in the approval condition than in the aided detection condition. These results point to some of the complex issues that need to be considered when choosing the appropriate level of automation for a system.
The system desiper needs to choose the most appropriate level of automation. This decision will depend on properties of the human operator, of the automation and of the context in which the system is used. Obviously, higher levels of automation should be used for functions, which the automated system performs well, and less automation is w a n t e d if the human operator surpasses the automation in task performance. However, the performance with a given level of automation also depends on properties of the human operator that are not directly related to his or her skills. but rather result from psychological characteristics of the operator. As Pamuraman and Riley [5] point out, the operator’s use of automation may not be optimal. There may be over-reliance or under-reliance on automation, which will lead to diminished overall system performance. We want to address here the question to what extent do operators adjust their responses to automation to the properties of the automation? Ideally an operator should rely correctly on automation, avoid over-reliance (or what is sometimes called automation bias [7]) but also avoid insufficient reliance.
Keywords: Automation, cognitive engineering, alerting systems, wamings, decision aids.
1 Introduction The allocation of functions between operators and automation has been at the focus of research on humanmachine systems over the last 50 years. The issue gains importance in recent years because of the growing tendency to automate functions in practically all technological systems. One crucial question that needs to be answered in this context concerns the optimal level of automation for a given system.
It is possible to describe the degree of automation in a system as one in a series of levels. Sheridan [6] describes 10 such levels between an entirely manual * 0-7803-7952-7/03/$17.00 Q 2003 IEEE.
Yisrael Parmet Department of Industrial Engineering and Management Ben Gurion University Beer Sheva 84105, Israel
It is, however, not quite clear what constitutes an optimal level of reliance on automation. One optimal level of collaboration between the human operator and the automation is the level that leads to optimal system performance. This is usually the criterion in which system designers and managers are most interested. However, there is also an individual operator’s target function, which deals with the operator’s efforts and costs. It is possible that in order to minimize the efforts that are required for task performance, an operator may adopt
2101
strategies that are not optimal at the level of the overall system. For instance, a certain level of automation may require minimal effort on the part of the operator, but use of this level of automation can lead to somewhat lower overall system performance. It may be entirely appropriate for the operator to choose this level of automation, and choosing it cannot be considered overreliance on automation.
diagnostic quality of the cue (high or low). Overall, there should be a stronger response to the cues when they are more diamostic. Based on the previous studies on waming cues, the difference in the response to cues as a function of their validity should be particularly large in compliance (i.e., in responses when a cue was present), and less in reliance (i.e., in responses when no cue was present).
The current study reports an experiment that aims to assess the effects of different levels of automation on the performance with a system that requires operators to detect probabilistic targets, based on visual information about stimuli and the output from an automated aid. Task performance will be assessed at two levels of automation: (1) Aided Detection (the lower level of automation) - the system cues the operator about the possible existence of targets in certain locations, and the operator has to decide where targets are located, based on the cues and additional information, and ( 2 ) Approval (the higher level of automation) - the system indicates the position of targets and the operator needs to approve or disapprove these selections. The two systems are equivalent in terms of the optimal possible level of performance for a system in which the operator and the automated component have certain detection abilities. Any difference in performance between these two systems results from the way information about the .automated aid and the necessary operator action are presented to the operator.
The analytical framework that we employ in this study to describe operator responses is Signal Detection Theory (e.g., [l]). This theory analyzes operator performance in binary classification tasks in terms of two parameters: (1) the sensitivity (often denoted as d’), which is the degree to which operators can distinguish between the two classes of events; and (2) the response criterion, which determines the bias towards identifying one, rather than the other, of the events.
Cues, like the ones described i n this system, are equivalent to hazard wamings since they require the operator to decide whether to take an evasive action or not. Recently Meyer [2, 31 suggested the distinction between two types of responses to such wamings compliance, which is the tendency to act cautiously when a waming cue is given and reliance, which is the tendency to act less cautiously when no cue is given. Previous studies demonstrated that these two responses are differentially affected by various variables. This finding supports the claim that these are two different types of trust in a waming cue. This view is in contrast to the assumption that an operator either trusts or does not trust a decision aid and responds accordingly.
The two types of responses can also he found in the present experiment. If a cue exists for a given item, an increased tendency to indicate that the item is faulty will be evidence for compliance, while a decreased tendency to indicate that an item is faulty when no cue is given is indication for reliance. Also, differential effects of independent variables on responses when a cue is given and when no cue is given will support the distinction between the two types of responses.
2
The Task
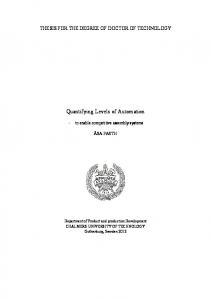
The experimental task in this study was a target detection task that is an abstraction of quality control in a production process. In this task participants had to decide whether or not to approve production for each item in a 5 X 5 matrix of items. The decision was based on partial information on the items, the prior probability of a failure, the costs and benefits associated with production when the item is intact or faulty, and the output from a cueing system that evaluated the items. The experimental task allows us to manipulate the degree to which failures are visible, the validity of the cue, the payoff matrix and the prior probability of failures. A detailed description of the experimental system and an explanation of the statistical methods for computing the probability of a failure in a given item are presented in [4]. An example of the experimental screen is shown in Figure 1. In each screen, 25 simulated items were shown to the participants. Participants were asked to decide for each of the items whether to approve it for production or to discard it as damaged. Each item was shown as a 5 X 5 matrix of black and white squares. A white Square indicated that t h i s particular location in the matrix was tested and found intact. An item was damaged if a continuous 2 X 2 field was not intact. In each mauix only a randomly sampled subset of the intact squares was shown. Participants have to decide whether to approve a particular item for production or not, based on this partial information. An example of intact and damaged items is shown in Figure 2.
The independent variables in the study are the level of automation (aided detection or approval) and the
2102
3 Method 3.1
Participants
Fourty-eight undergraduate students (ages: 23 - 31, median: 26) participated in the experiment as part of a Human Factors course. Performance of the task was encouraged by the promise of a monetary award to the participant from each group with the highest score in a randomly chosen block Participants were randomly assigned to four experimental groups, each containing 12 participants. .We dropped the data for three participants whose performance seemed random and differed greatly from the performance of the other participants.
3.2 Figure 1. A sample screen in the experiment.
Apparatus and Procedure
The task was implemented using MS Visual Basic. The experiment was run on Pentium PCs and 15" monitors on groups of 12 participants at a time (3 from each experimental condition) in a computer classroom. The instructions were explained by the experimenter.
The ease of distinguishing between faulty and intact items can be manipulated by changing the number of intact squares in an item that are shown. If all intact squares would be shown, it would be perfectly clear whether an item is faulty or intact. If only a small number of squares are shown, the distinction between faulty and intact items is impossible. For a description of the statistical properties of different types of stimuli and different numbers of tested squares, see [41.
The a-priori probability of faulty item in the experiment was 0.2. For each item 14 intact squares out of the 25 squares were shown, leading to a system with a d' of approximately 1.7. Participants were rewarded 1 point for approving an intact item for production and they lost 10 points when they attempted production with a faulty item. Correct detection of damaged items and false alarm (identification that there was a fault when there was actually none) were not rewarded or penalized.
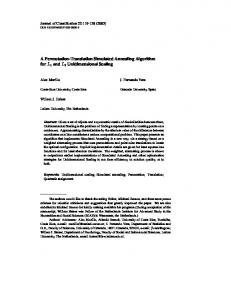
Figure 2 - Sample of an intact item (upper left) and a faulty item (upper right) when all intact squares are shown. In the experiment only 14 squares were shown. The lower row shows an item that is defdtely intact (left) and an item in which a failure can exist (right). The detection task was aided by an automated cue that indicated the possible existence of a faulty item at a certain position on the screen. The cue was presented through highlighting the area around the possibly faulty part. The probability of correctly indicating the existence of a faulty part (p [True Positive]) and of incorrectly indicating that a part is faulty (p False Positive]) was manipulated to test the effect of different levels of cue diagnosticity on the use of the cue.
The experiment consisted of five blocks of 20 trials in each block. In each mal the participant was asked to decide which items to approve for production. After each trial the participant received feedback about the decisions, and continued to the next screen. At the end of each block was a sixty-second break The primary independent variable in the experiment was the level of automation in the system. In the aided detection (low automation) level, participants saw highlights from the cueing system around items that the system identified as possibly faulty. Participants could take these cues into account when selecting the items that they wanted to discard from production. In the approval (high automation) condition, participants received the cues from the system about possibly faulty items (as in the aided detection condition), but here the system also automatically selected the cued items for exclusion from production. If a participant wanted to include a cued item into production, he or she had to deselect it. Participants who were willing to rely entirely on the cueing system could simply approve the screen with the automatically
21I03
selected items as it appeared. This would require minimal effon on the part of the participant, but it could also lead to a somewhat lower level of performance then when the participant evaluates all available information.
participants' sensitivity was greater (d'=2.44) than in the low validity condition (d'= 2.09). The results are shown in Figure 3. Overall participants benefited from the more valid cue, but this advantage was fairly small.
".",
An additional independent variable was the validity of the cue from the automatic system. We tested two levels of cue validity: (a) low validity, which resembles a cueing system with d = 1, pTP= .45, pi? = .15; and (b) high validity, which resembles a cueing system with d' = 2.4, p ~= p .8, pm = .05.
The analysis aimed to determine whether the overall performance in the detection task differed for the different conditions, whether it improved over the course of the experiment, and whether the slope of the improvement differed for the conditions. As a performance measure, we use the d' equivalent which is the measured sensitivity of the operator. This was computed from the number of m e positives (correct detections of faulty items) and false positives (classifying an intact item as faulty) of the operator, based on the information from the cueing system and the inspection of the items. In addition, in order to assess the participants' behavior in response to cues in the different experimental conditions, we analyzed the settings of the participants' response criterion for items for wiuch the cue indicated a possible failure and for those for which there was no cue of a possible failure.
4 4.1
Results and Discussion Analysis of participants' sensitivity
Participants' sensitivity was assessed in terms of d'. The value of d' was computed through formula (lj, where zTpand zm are the values of the inverse of the standard normal distribution for the probabilities for True Positive and False Positive responses.
d'= zTp-zFp
(1)
The values of d' were analyzed with a three-way ANOVA with the level of automation, the validity of the cue and the experimental block as independent variables. The block was a within-subject variable, while the other two factors were between-subject. There was clear evidence for learning in the experimental condition, as indicated by a highly significant main-effect of the experimental block, F(4,176) = 42.92, p