The network remains a bottleneck in data-intensive clusters, as ev- idenced by the continued focus on static .... design
Leveraging Endpoint Flexibility in Data-Intensive Clusters Mosharaf Chowdhury1 , Srikanth Kandula2 , Ion Stoica1 1
UC Berkeley, 2 Microsoft Research
{mosharaf, istoica}@cs.berkeley.edu,
[email protected]
ABSTRACT
However, many inter-machine transfers do not require their destinations to be in specific locations as long as certain constraints are satisfied. An example of such transfers in data-intensive clusters is the writes to cluster file systems (CFSes) like GFS [27], HDFS [15], Cosmos [19], Amazon S3 [2], or Windows Azure Storage [17]. These systems store large pieces of data by dividing them into fixed-size blocks, and then transferring each block to three machines (for fault-tolerance) in two different racks (for partitiontolerance) using chain replication [42]. The replicas can be in any subset of machines that satisfy the constraints. Analysis of traces from production clusters at Facebook and Microsoft reveals that such replicated writes (referred to as distributed writes from hereon) account for almost half of all cross-rack traffic in both clusters (§4). Moreover, recent data suggests a growing trend in the volume of distributed writes with hundreds of terabytes of data being ingested everyday into different CFS installations [5, 6, 17]. We also find that while the network is often underutilized, there exists substantial imbalance in the usage of bottleneck links. Such imbalance leads to congestion and performance degradation. Common causes of imbalance include skew in application communication patterns1 [14, 35] and a lack of control on the background traffic in multi-tenant datacenters. Even though replication takes place over the network, its interactions with the network have so far been ignored. In this paper, we present Sinbad, a system that leverages the flexibility in endpoint placement during distributed writes to steer replication transfers away from network hotspots. Network-balanced placement has two implications. First, it improves CFS write throughput by avoiding network contention; response times of tasks that write improve as well. Second, by steering CFS’ traffic away from hotspots, throughput of non-CFS traffic on those links increase; in data-intensive clusters, this speeds up tasks that shuffle intermediate data and jobs with large shuffles. Exercising the freedom in endpoint selection in our approach is akin to that of overlay anycast, which is typically employed by latency-sensitive request-response applications to select the “best” source (server) from where to retrieve the content [18, 25]. However, in the case of distributed writes, we exploit this flexibility for picking the “best” set of destinations to maximize the throughput of replicating large blocks. In addition, we consider constraints like the number of fault domains and aim to minimize the storage imbalance across machines. Storage imbalance during replica placement is harmful, because machines receiving too many replicas can become hotspots for future tasks. Existing CFSes employ a uniform replica placement
Many applications do not constrain the destinations of their network transfers. New opportunities emerge when such transfers contribute a large amount of network bytes. By choosing the endpoints to avoid congested links, completion times of these transfers as well as that of others without similar flexibility can be improved. In this paper, we focus on leveraging the flexibility in replica placement during writes to cluster file systems (CFSes), which account for almost half of all cross-rack traffic in data-intensive clusters. The replicas of a CFS write can be placed in any subset of machines as long as they are in multiple fault domains and ensure a balanced use of storage throughout the cluster. We study CFS interactions with the cluster network, analyze optimizations for replica placement, and propose Sinbad – a system that identifies imbalance and adapts replica destinations to navigate around congested links. Experiments on EC2 and trace-driven simulations show that block writes complete 1.3× (respectively, 1.58×) faster as the network becomes more balanced. As a collateral benefit, end-to-end completion times of data-intensive jobs improve as well. Sinbad does so with little impact on the long-term storage balance.
Categories and Subject Descriptors C.2 [Computer-communication networks]: tems—Cloud computing
Distributed sys-
Keywords Cluster file systems, data-intensive applications, datacenter networks, constrained anycast, replica placement
1
Introduction
The network remains a bottleneck in data-intensive clusters, as evidenced by the continued focus on static optimizations [7, 31] and data-local task schedulers [10, 34, 43, 44] that reduce network usage, and on scheduling the exchanges of intermediate data [10, 20]. The endpoints of a flow are assumed to be fixed: network schedulers [8,13,20,28] can choose between different paths, vary rates of flows, and prioritize one flow over another, but they cannot change where a flow has originated from or its destination. Permission to make digital or hard copies of all or part of this work for personal or classroom use is granted without fee provided that copies are not made or distributed for profit or commercial advantage and that copies bear this notice and the full citation on the first page. Copyrights for components of this work owned by others than ACM or the author must be honored. To copy otherwise, or republish, to post on servers or to redistribute to lists, requires prior specific permission and/or a fee. SIGCOMM’13, August 12–16, 2013, Hong Kong, China. Copyright 2013 ACM 978-1-4503-2056-6/13/08 ...$15.00.
1
For example, when counting the occurrences of DISTINCT keys in a dataset, the amount of data in each partition (to be received by corresponding reducer) can be very skewed.
231
policy and perform periodic re-balancing to avoid such imbalance. We show that a network-balanced placement policy does not trigger additional storage balancing cycles. While network hotspots are stable in the short term to allow network-balanced placement decisions, they are uniformly distributed across all bottleneck links in the long term ensuring storage load balancing. Optimizing distributed writes is NP-hard even in the offline case, because finding the optimal solution is akin to optimally scheduling tasks in heterogeneous parallel machines without preemption [9, 26]. We show that if hotspots are stable while a block is being written and all blocks have the same size, greedy placement through the least-loaded bottleneck link is optimal for optimizing the average block write time (§5). Under the same assumptions, we also show that to optimize the average file write time, files with the least remaining blocks should be prioritized. Sinbad employs the proposed algorithms and enforces necessary constraints to make network-aware replica placement decisions (§6). It periodically measures the network and reacts to the imbalance in the non-CFS traffic. An application layer measurementbased predictor performs reasonably well in practice due to shortterm (few tens of seconds) stability and long-term (hours) uniformness of network hotspots. We find this approach attractive because it is not tied to any networking technology, which makes it readily deployable in public clouds. We have implemented Sinbad as a pluggable replica placement policy for the Facebook-optimized HDFS distribution [4]. HDFS is a popular open-source CFS, and it is the common substrate behind many data-parallel infrastructures [3, 32, 45]. We avoid the many known performance problems in Hadoop [3] by running jobs using an in-memory compute engine (e.g., Spark [45]). We have evaluated Sinbad (§7) by replaying the scaled-down workload from a Facebook trace on a 100-machine Sinbad deployment on Amazon EC2 [1]. We show that Sinbad improves the average block write time by 1.3× and the average end-to-end completion time of jobs by up to 1.26× with limited penalties due to its online decisions. In the process, it decreases the imbalance across the network with little impact on storage load balancing. For in-memory storage systems, the improvements can be even higher. Through trace-driven simulations, we also show that Sinbad’s improvement (1.58×) is close to that of a loose upper bound (1.89×) of the optimal. We discuss known issues and possible solutions in Section 8, and we consider Sinbad in light of relevant pieces of work in Section 9.
2
Core!
Fault Domain 1/! Fault Domain 2/! Rack 1! Rack 2!
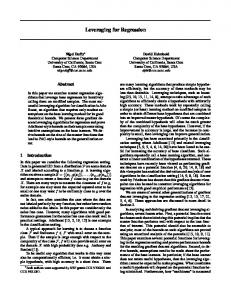
Figure 1: Distributed write pipeline. Each block has three copies in two racks and three different machines.
Write Workflow When writing a file to the CFS, the client provides a replication (r) factor and a fault-tolerance (f ) factor to ensure that each block of that file has r copies located in at least f (< r) fault domains. The former is for load balancing (blocks in popular files have more replicas [11]), while the latter ensures availability in spite of failures. Machines in different racks are typically considered to be in independent fault domains. Typically, r = 3 and f = 1; meaning, each block is stored in three machines in two racks and can survive at most one rack failure (Figure 1). Thus, writing a block copies it at least once across racks. The replica placement policy in the CFS master independently decides where to place each block irrespective of their parent files. Blocks from the same file and their replicas need not be collocated. The goal is to uniformly place blocks across all machines and fault domains so as to • minimize the imbalance in storage load across disks, and • balance the number of outstanding writes per disk. Both these constraints assume that writes are bottlenecked only by disks. This assumption, however, is not always true since the extent of oversubscription in modern datacenter networks (typically between the core and racks) can cause writes to bottleneck on the oversubscribed links. Even on topologies with full bisection bandwidth, writes can bottleneck on the servers’ network interfaces for high in-degrees or when the cumulative write throughput of a server is larger than its NIC speed. For example, a typical server with six to eight commodity disks [33, 41] has sequential write throughput that is several times the typical NIC speed (1 Gbps). Once replica locations have been determined, the CFS slave transfers the block to the selected destinations using chain replication [42]. Distributed writes are synchronous; to provide strong consistency, the originator task will have to wait until the last replica of the last block has been written. Hence, write response times influence task completion times as well.
CFS Background
This section provides a brief architectural overview of cluster file systems (CFSes) focusing primarily on the end-to-end write pipeline. Examples of CFSes include distributed file systems (DFS) like GFS at Google [27], HDFS at Facebook and Yahoo! [4, 15], and Cosmos [19] at Bing. We also include public cloud-based storage systems like Amazon S3 [2] and Windows Azure Storage (WAS) [17] that have similar architecture and characteristics, and are extensively used by popular services like dropbox.com. 2.1
Read Workflow Reading from the CFS is simpler. Given a file, the CFS master reports the locations of all the replicas of all the blocks of that file. Given these locations, task schedulers try to achieve data locality through a variety of techniques [10,34,43,44]. Although reads are separate from writes, read performance is still influenced by the placement of blocks. By minimizing storage imbalance, a CFS strives to minimize the performance impact of reads in future tasks.
System Model
A typical CFS deployment consists of a set of storage slaves and a master that coordinates the writes to (reads from) CFS slaves. Files (aka objects/blobs) stored in a CFS are collections of large blocks. Block size in production clusters varies from 64 MB to 1 GB.2 The block size demonstrates a trade-off between disk I/O throughput vs. the benefit from parallelizing across many disks. Most CFS designs provide failure recovery guarantees for stored files through replication and ensure strong consistency among the replicas. 2
Fault Domain 3/! Rack 3!
2.2
Network Model
CFS deployments in modern clusters run on topologies that often have a full-bisection bandwidth core (e.g., fat-tree [38], VL2 [28]) with some oversubscription in core-to-rack links (Figure 1). We consider a network model, where downlinks to storage racks can be skewed. This is common in typical data-intensive clusters with
Blocks are not padded, i.e., the last block in a file can be smaller.
232
Constraints & Hints!
Where to put block B?!
At least r replicas! In f fault domains! Collocate with block B’! …!
Sinbad Master!
Machine!
Sinbad Master!
Where to put block B?!
CFS Master!
{ Locations }!
• • • •
Info (from slaves)! • Static Information! • Network topology! • Link, disk capacities! • Dynamic distributions of ! • loads in links! • popularity of files!
CFS Slave!
CFS Slave!
CFS Slave!
Sinbad Slave!
Sinbad Slave!
Sinbad Slave!
Figure 3: Sinbad architecture. Sinbad agents are collocated with the corresponding agents of the parent CFS. Table 1: Details of Facebook and Microsoft Bing Traces
Figure 2: Decision process of Sinbad master. Date Duration Framework Jobs Tasks CFS Block Size Machines Racks Core:Rack Oversubscription
collocated compute and storage. For dedicated storage racks (i.e., when compute and storage are not collocated), skew can still exist due to random placement decisions made by the CFS master.
3
Sinbad Overview
Sinbad is a measurement-based system to perform networkbalanced replica placement during distributed writes. In this section, we present a brief overview of Sinbad to help the reader follow the measurements (§4), analysis (§5), and design (§6) presented in subsequent sections. 3.1
Problem Statement
Microsoft Bing
Oct 2010 One week Hadoop [3] 175, 000 30 million HDFS [4] 256 MB 3, 000 150 10 : 1
Mar-Apr 2012 One month SCOPE [19] Tens of Thousands Tens of Millions Cosmos [19] 256 MB Thousands Hundreds Lower (i.e., Better)
want Sinbad to be usable in public cloud offerings with little or no access to in-network measurement counters. Sinbad can interact nicely with existing network-level load balancers (e.g., Hedera [8], MicroTE [13], or ECMP [28]). This is because networklevel techniques balance load among paths given source-destination pairs, whereas Sinbad dictates destinations without enforcing specific paths.
Given a replica placement request – with information about the location of the writer, size of the block, and the replication factor – Sinbad must return a set of locations for the CFS master to replicate that block to (Figure 2). All information about a block request is unknown prior to its arrival. One can think of this problem as constrained overlay anycast in a throughput-sensitive context. However, instead of retrieving responses from the best sources, we have to replicate large blocks to multiple machines in different fault domains without introducing significant storage imbalance across the cluster. The problem of placing replicas to minimize the imbalance across bottleneck links is NP-hard even in the offline case (§5). Sinbad employs algorithms developed by exploiting observations from real-world clusters (§4) to perform reasonably well in realistic settings. 3.2
Facebook
Fault Tolerance and Scalability Since Sinbad agents are collocated with that of the parent CFS, host failures that can take Sinbad slaves offline will take down corresponding CFS agents as well. If Sinbad master dies, the CFS master can always fall back to the default placement policy. Because most CFSes already have a centralized master with slaves periodically reporting to it – Sinbad does not introduce new scalability concerns. Furthermore, piggybacked measurement updates from Sinbad slaves introduce little overhead.
4
Architectural Overview
Sinbad is designed to replace the default replica placement policy in existing CFSes. Similar to its target CFSes, Sinbad uses a centralized architecture (Figure 3) to use global knowledge while making its decisions. Sinbad master is collocated with the CFS master, and it makes placement decisions based on information collected by its slaves. Sinbad slaves (collocated with CFS slaves) periodically send measurement updates to the master by piggybacking on regular heartbeats from CFS slaves. They report back several pieces of information, including incoming and outgoing link utilizations at host NICs and current disk usage. Sinbad master aggregates the collected information and estimates current utilizations of bottleneck links (§6.2). Sinbad uses host-based application layer techniques for measurements. This comes out of practicality: we
Measurements and Implications
In this section, we analyze traces from two production data-parallel clusters – Facebook’s Hadoop-HDFS cluster and Microsoft Bing’s SCOPE-Cosmos cluster. Table 1 lists the relevant details. In both clusters, core-to-rack links are the most likely locations for network bottlenecks. Our goal behind analyzing these traces is to highlight characteristics – the volume of distributed writes, the impact of writes on job performance, and the nature of imbalance in bottleneck link utilizations – that motivate us to focus on distributed writes and enable us to make realistic assumptions in our analysis and evaluation. 4.1
Network Footprint of Distributed Writes
Available data points indicate a growing trend of the volume of data ingested into data-intensive clusters. Recent data from Facebook
233
Table 2: Sources of Cross-Rack Traffic Job Writes 10% 5%
Preproc./Ingest! Reducers!
0.75! 0.5! 0.25!
Down Links! Up Links!
0.75! 0.5! Down Links!
0.25!
Up Links!
0!
0! 0! 1! 2! 3! 4! 5! 6! Coeff. of Var. of Load Across Core-Rack Links!
Combined!
(a) Facebook
!")$ !")% 0! 0! 0.25! 0.5! 0.75! 1! !")& !")' Fraction of Task Duration in Write! !")( !"+ Figure 4: Weighted CDF of the fraction of task durations spent in writing !"+*
0! 1! 2! 3! 4! Coeff. of Var. of Load Across Core-Rack Links!
(b) Microsoft Bing
Figure 5: Imbalance in 10s average utilizations of up and downlinks between the core and racks in Facebook and Microsoft clusters due to CFS and non-CFS traffic.
We found that 37% of all tasks write to the CFS. A third of these are reducers; the rest are other writers. We observed that 42% of the reduce tasks and 91% of other writers spent at least half their durations in the write phase (Figure 4). This suggests that faster writes can help many tasks to complete earlier.
to HDFS by tasks with write phases.
claims that it ingests more than 500 TB every day (Aug. 2012) [5]. To provide fresh ads and content recommendations, ingestion happens at regular intervals including peak hours [16, 41]. The ingestion engine of Windows Azure Storage (WAS) keeps around 350 TB of Facebook and Twitter data to provide near-realtime search results within 15 seconds [17]. Finally, Amazon S3 has experienced a sharp rise in the number of objects it stores since 2006; it currently stores more than 1.3 trillion objects (Jan. 2013) [6], many of which are likely to be large blobs due to S3’s performance and pricing models.3 The impact of the increasing volume of writes was evident in our traces. Although intermediate transfers are known to have significant impact on application performance [20], they are far from being the dominant source of cross-rack traffic! We found that intermediate transfers account for 46% and 15% of all cross-rack traffic in Facebook and Microsoft clusters (Table 2). As expected, both clusters achieved good data locality – only 10% of all tasks read input from non-local machines [10, 34, 44]. Contrary to our expectations, however, we observed that crossrack replication due to distributed writes accounted for 40% and 54% of the network traffic in the two clusters. In addition to the final output that jobs write to the CFS, we identified two additional sources of writes:
4.3
Characteristics of Network Imbalance
We found that the cumulative traffic from intermediate transfers, distributed writes, cluster management workload, and the traffic from collocated services can be substantially imbalanced across the bottleneck links in the short term (e.g., tens of seconds). Causes of imbalance include skew in application communication patterns [14, 35], imbalance in the number of mappers and reducers, and cluster management events such as rolling updates. We measured network imbalance using the coefficient of variation4 (Cv ) of the average link utilization in each 10s interval across up and downlinks (Figure 5). With perfect balance, these values would be zero. However, in both traces, we found that the downlinks had Cv > 1 for almost half the time. Uplinks were equally imbalanced in the Facebook trace, but the imbalance was somewhat lower in the Bing trace. We do not yet know the reason for this. Although skewed, link utilizations remained stable over short intervals. Such stability is important to enable predictable online placement decisions for relatively short block transfers. To analyze the stability of link utilizations, we calculated average utilization over different time intervals in all core-to-rack links in the Facebook cluster. We consider a link’s utilization Ut (l) at time t to be stable for the duration T if the difference between Ut (l) and the average value of Ut (l) over the interval [t, t + T ) remains within StableCap% of Ut (l). We observed that average link utilizations remained stable for smaller durations with very high probabilities. For the most unpredictable link, the probabilities that its current utilization from any instant will not change by more than 5% for the next 5, 10, 20, and 40 seconds were 0.94, 0.89, 0.80, and 0.66, respectively. Compare these with the 256 MB blocks used in these clusters. It will take around 5s to write such a block at a disk throughput of 50 MBps, which is small enough to exploit utilization stability periods. We found that 81% of all bytes written to the CFS come from 32% of the blocks that are 256 MB in size. Imbalance without congestion may not impact performance. We observed in the Facebook trace that the 95th percentile load across bottleneck links was more than 75% of link capacity 25% of the time. However, the effect of congested links is magnified – a single
1. Data ingestion or the process of loading new data into the cluster amounted for close to 50% of all cross-rack bytes in the Microsoft cluster. 2. Preprocessor outputs. Preprocessing jobs only have map tasks. They read data, apply filters and other user-defined functions (UDFs) to the data, and write what remains for later consumption by other jobs. Combined with data ingestion, they contributed 30% of all cross-rack bytes in the Facebook cluster. 4.2
1!
1!
Other Writes 30% 49%
Fraction of Time!
CDF! (Weighted by Bytes Written)!
!"#% !"#& 1! !"#' !"#(0.75! !") !")* 0.5! !")# !")) !")+0.25!
Inter. 46% 15%
Fraction of Time!
Facebook Microsoft !"#$
Reads 14% 31%
Impact of Writes on Job Performance
To understand the impact of writes on task durations, we compare the duration of the write phase with the runtime of each writer. For a reduce task, we define its “write phase” as the time from the completion of shuffle (reading its input from map outputs over the network) until the completion of the task. For other writers, we define the write phase as the timespan between a task finishing reading its entire input (from local disk) and its completion time.
4
Coefficient of variation, Cv = σµ , shows the extent of variability in relation to the mean of the population.
3
S3 charges for individual PUT requests, and PUT response times are empirically better for larger objects.
234
bottleneck link can impact a large number of jobs if they have tasks communicating through that congested link. Finally, despite significant short-term imbalance, link usages become more balanced over longer intervals (e.g., over hours). During normal operation (i.e., in absence of failures), we observed that each bottleneck link is almost equally likely to become a hotspot. 4.4
3. Potential bottleneck links are easily discernible. Given the oversubscribed (logical) tree-based topologies of data-intensive clusters, links leading in and out of the racks are likely to be the bottlenecks. We assume that the potential network bottlenecks are known, which allows us to abstract away the topology.5 4. Decision intervals are independent. We assume that block requests arrive at the beginning of decision intervals, and they are small enough so that their replication finish within the same interval. All decision intervals have the same length, q. Given the aforementioned assumptions, greedy assignment of blocks to the least-loaded link first is optimal for minimizing the average block write time (see Theorem A.2). We refer to this algorithm as OP T . OP T ’s improvements over the uniform placement policy increases with the increasing imbalance in the network and as the number of off-rack replicas increases (§A.2).
Summary
We make the following observations in this section. • Replication account for almost half the cross-rack traffic in data-intensive clusters, and its magnitude is rapidly increasing. • Network congestion in such clusters has significant skew across bottleneck links in the short term, but the skew is minimal over longer durations. • Durations of write tasks (e.g., ingestion and preprocessing tasks) are dominated by time spent in writing. • Most bytes written to the CFS belong to the maximum sized (256 MB) blocks.
5
5.2
CFSes store data by dividing it into fixed-sized blocks. Hence, a request to write a large file/object generates a sequence of block write requests. For a writer, the objective then to minimize the average file write time. Optimizing the average file write time is no easier than optimizing the average block write time, and, it is NP-hard as well. OP T is optimal when all blocks have the same size. However, files can have different sizes, which can result in different numbers of equal-sized blocks. Using a simple counter-example it can be shown that OP T is not optimal in this case (Lemma B.1). Given the assumptions in Section 5.1 and with OP T in place, greedy assignment of blocks through links in the least-remainingblocks-first order is optimal for minimizing the average file write time (see Theorem B.2). We refer to this algorithm as OP T ′ . OP T ′ favors smaller files. However, larger files will not completely starve as long as the arrival rate of block requests does not exceed the simultaneous serving capacity of the system. OP T ′ requires the decision interval to be longer than zero (i.e., q > 0) so that it can order blocks from different files by the number of blocks remaining in their parent files. In contrast, q = 0 refers to a pure online solution, where OP T ′ reduces to OP T . The length of the decision interval (q) presents a tradeoff. A larger q potentially provides better opportunities for OP T ′ , but it introduces additional delay to the write time of each block in that interval.
Analytical Results
The distributed writing problem is NP-hard. In this section, we provide insights into the complexity of this problem, consider assumptions that make the problem tractable, and present two optimal algorithms under the simplifying setting. We also discuss the potential for improvements using a network-aware solution. Detailed analysis and proofs can be found in the appendix. 5.1
Optimizing File Writes
Optimizing Block Writes
The primary objective of a CFS is to minimize the average block write time, which also results in maximizing the system utilization of the CFS. The optimal placement algorithm must select the best destinations (through suitable bottleneck links) for all block requests as they arrive. Complexity Optimizing for block writes is NP-hard, even when all block requests and link capacities are known beforehand. This can be proven by a reduction from the NP-hard job-shop scheduling problem (Theorem A.1). The online distributed writing problem is even harder because of the following reasons: 1. Links have different available capacities. 2. Lack of future knowledge about (a) bottleneck link utilizations throughout the duration of replication, and (b) new replica placement requests (sizes and arrival times) to arrive while a block is being replicated. Variations of job shop scheduling with one or more of the abovementioned characteristics are known to be NP-hard and hard to approximate as well [9, 36, 37].
6
Design Details
This section discusses the expected operating environment of Sinbad (§6.1), how Sinbad estimates bottleneck link utilizations across the cluster (§6.2), and how it incorporates (§6.3) the algorithms introduced in Section 5. 6.1
Operating Environment
We make the following assumptions about the characteristics of write requests and on the availability of certain pieces of information (e.g., oversubscription in the topology). Because most bytes are generated by a third of all blocks written, we consider only fixed-sized blocks in Sinbad. This allows Sinbad to ignore the arrival order of block requests when making a decision for the current block request. In a sense, this problem is akin to an online load balancing problem. A frequent stream of roughly evenly-sized entities is quite easy to balance. Contrast this with the case when block sizes are unbounded; whether or not large blocks will arrive in the future crucially impacts placement, since
Simplified Model For the ease of analysis, we make the following assumptions based on our observations in Section 4. 1. Blocks have a fixed size. The size of each block is already bounded. Additionally, we assume all blocks to have the same size (i.e., blocks are padded). Because most bytes are generated by a third of all blocks written, we ignore the impact of the rest during analysis. 2. Link utilization is fixed while a block is being written. Since link utilizations remain reasonably stable in the short term, we assume that changes in bottleneck links are precisely known throughout the duration of writing a block. Changes are expected only due to traffic introduced by replication.
5
Generalizing to arbitrary topologies adds overhead. For example, we would have to run max-flow/min-cut to determine which of the many bottlenecks are tight given a placement.
235
Pseudocode 1 Request Dispatching Algorithm
Pseudocode 2 Link Selection Algorithm
1: procedure GET R EPLICA L OCATIONS(Request B) 2: if B.size < THRESHOLD then ▷ Ignore small blocks 3: return Default.getReplicaLocations(B) 4: end if 5: 6: if q = 0 then ▷ Instantaneous decision 7: return selectLinks(B, Nil) 8: end if 9: 10: Q.addToQueue(B) ▷ Queue up the request. Order by policy. 11: end procedure
1: procedure SELECT L INKS(Request B, Link l) 2: if l is an edge link then ▷ Terminating condition 3: return {Machine attached to l} 4: end if 5: 6: M = {} 7: if l = Nil then ▷ Called with the tree root 8: Lcur = L ▷ Consider all bottleneck links 9: M = {B.localMachine} 10: B.r = B.r − 1 11: else ▷ Called recursively 12: Lcur = {l′ : l′ ∈ subtree of l} 13: end if 14: 15: Lcur = Lcur .filter(B.constraints) ▷ Filter (§6.4) 16: 17: if |Lcur | < B.r then 18: return Nil ▷ Not enough locations 19: end if 20: 21: SORT_DESC Lcur by expectedCapacity(l) 22: for all l ∈ {First B.r links from Lcur } do 23: Add hysteresis to l ▷ Only to the selected links 24: Set B.r = 1 ▷ One replica from each subtree 25: M = M ∪ {selectLinks(B, l)} 26: end for 27: return M 28: end procedure
12: procedure DISPATCH R EQUEST(Link l) 13: for all B ∈ Q do 14: return selectLinks(B, Nil) 15: end for 16: end procedure
▷ Called at q intervals.
one needs to keep room on both network links and disks for such blocks. The rest of the blocks, which are many but contribute insignificant amount of bytes, are placed using the default placement policy. Sinbad uses optional information provided by the operator including the topology of the cluster, oversubscription factors at different levels of the topology, and fault domains with corresponding machines. We populate the bottleneck links’ set (L) with links from that level of the topology, which has the highest oversubscription factor and is the farthest from the network core.6 In the absence of these information, Sinbad assumes that each machine is located in its own fault domain, and L is populated with the host-to-rack links. 6.2
29: procedure EXPECTED C APACITY(Link l) 30: return min(Cap(l) − Rxcur(l) , DiskWriteCap) 31: end procedure
a increment function I(B, δ) that is proportional to the size of the block and inversely proportional to the amount of time remaining until the next update (denoted by δ).
Utilization Estimator
Sinbad master receives periodic updates from each slave at ∆ intervals containing the receiving and transmitting link utilizations at corresponding NICs. After receiving individual updates, Sinbad estimates, for each potential bottleneck link l, the downlink (Rx(l)) and uplink (T x(l)) utilizations using exponentially weighted moving average (EWMA):
vnew’ (l)
=
vnew (l) + I(B, δ)
I(B, δ)
=
min(Cap(l) − vnew (l),
Size(B) ) δ
When an updated measurement arrives, vnew’ (l) is invalidated and vnew (l) is used to calculate the weighted moving average of v(l). Here, Cap(l) represents the capacity of link l and Size(B) is the size of block B.
vnew (l) = α vmeasured (l) + (1 − α) vold (l) where, α is the smoothing factor (Sinbad uses α = 0.2), and v(.) stands for both Rx(.) and T x(.). EWMA smooths out the random fluctuations. v(l) is initialized to zero. Missing updates are treated conservatively as if the estimate indicates the link to be fully loaded. When L contains internal links of the topology (i.e., links between switches at different levels), vnew (l) is calculated by summing up the corresponding values from the hosts in the subtree of the farthest endpoint of l from the core. This is recalculated at ∆ intervals. The update interval ∆ determines how recent vnew (l) values are. A smaller ∆ results in more accurate estimations; however, too small a ∆ can overwhelm the incoming link to the master. We settled for ∆ = 1s, which is typical for heartbeat intervals (1 to 3 seconds) in existing CFSes.
6.3
Network-Balanced Placement Using Sinbad
Sinbad employs the algorithms developed in Section 5 to perform network-aware replica placement. It involves two steps: ordering of requests and ordering of bottleneck links. Sinbad queues up (Pseudocode 1) all block requests that arrive within a decision interval of length q and order them by the number of remaining blocks in that write request (for OP T ′ ). For q = 0, Sinbad takes instantaneous decisions. The value of THRESHOLD determines which blocks are placed by Sinbad. Recall that to lower overhead, Sinbad causes most of the smaller blocks, which are numerous but contribute only a small fraction of cluster bytes, to be placed using the default policy. Given an ordered list of blocks, Sinbad selects the machine with the highest available receiving capacity that is reachable through the bottleneck link (lsel ):
Hysteresis After a Placement Decision Once a replica placement request has been served, Sinbad must temporarily adjust its estimates of current link utilizations in all the links involved in transferring that block to avoid selecting the same location for subsequent block requests before receiving the latest measurements. We use
lsel = argmax min(Cap(l) − Rxcur (l), DiskWriteCap) l
where, Rxcur (l) is the most recent estimation of Rx(l) at time Arr(B). This holds because the copy has to move in the transmit direction regardless. The choice of placement only impacts where it ends up, and hence, which other links are used on their receive
6 For full bisection bandwidth networks, host-to-rack links are the potential bottlenecks.
236
Table 3: Jobs Binned by Time Spent in Writing
direction. Further, Sinbad can generalize to the case when there are multiple bottleneck links along such receiving paths. Hysteresis (described above) lets Sinbad track the ongoing effect of placement decisions before new utilization estimates arrive. Pseudocode 2 shows how Sinbad proceeds recursively, starting from the bottleneck links, to place the desired number of replicas. The entry point for finding replicas for a request B with this procedure is SELECT L INKS(B, Nil). Calling it with an internal link restricts the search space to a certain subtree of the topology. Because a replication flow cannot go faster than DiskWriteCap, it might seem appealing to try to match that throughput as closely as possible. This choice would leave links that have too much spare capacity for a given block free, possibly to be used for placing another larger block in near future. However, in practice, this causes imbalance in the number of replication flows through each bottleneck link and in the number of concurrent writers in CFS slaves, and hurts performance. 6.4
Bin Write Dur. % of Jobs % of Bytes
3
4
5
50–74% 12% 3%
75–89% 8% 3%
≥ 90% 52% 67%
Cluster Our experiments use extra large EC2 instances with 4 cores and 15 GB of RAM. Each machine has 4 disks, and each disk has 400 GB of free space. The write throughput of each disk is 55 MBps on average. The EC2 network has a significantly better oversubscription factor than the network in the original Facebook trace – we observed a bisection bandwidth of more over 700 Mbps/machine on clusters of 100 machines. At smaller cluster sizes we saw even more – up to 900 Mbps/machine for a cluster of 25 machines. Note that virtual machine (VM) placement in EC2 is governed by the provider and is supposed to be transparent to end users. Further, we did not see evidence of live migration of VMs during our experiments. We use a computation framework similar to Spark [45] and the Facebook-optimized distribution of HDFS [4] with a maximum block size of 256 MB. In all experiments, replication and faulttolerance factors for individual HDFS files are set to three (r = 3) and one (f = 1), respectively. Unless otherwise specified, we make instantaneous decisions (q = 0) in EC2 experiments.
Additional Constraints
Evaluation
We evaluated Sinbad through a set of experiments on a 100machine EC2 [1] cluster using workloads derived from the Facebook trace. For a larger scale evaluation, we used a trace-driven simulator that performs a detailed replay of task logs from the same trace. Through simulation and experimentation, we look at Sinbad’s impact when applied on two different levels of the network topology: in the former, Sinbad tries to balance load across links connecting the core to individual racks; whereas, in the latter, it aims for balanced edge links to individual machines (because the EC2 topology and corresponding bottlenecks are unknown). Our results show the following:
Trace-Driven Simulator We use a trace-driven simulator to assess Sinbad’s performance on the scale of the actual Facebook cluster (§4) and to gain insights at a finer granularity. The simulator performs a detailed task-level replay of the Facebook trace on a 3000-machine cluster with 150 racks. It preserves input-to-output ratios of all tasks, locality constraints, and presence of task failures and stragglers. We use the actual background traffic from the trace and simulate replication times using the default uniform placement policy. Disk write throughput is assumed to be 50 MBps. Unless otherwise specified, we use 10 second decision intervals (q = 10s) in simulations for time constraints.
• Sinbad improves the average block write time by 1.3× and the average end-to-end job completion time by up to 1.26×, with small penalties for online decisions (§7.2). • Through simulations, we show that Sinbad’s improvement (1.58×) is close to that of a loose upper bound (1.89×) of the optimal (§7.2). • Sinbad decreases the median imbalance across bottleneck links (i.e., median Cv ) by up to 0.33 in both simulation and experiment (§7.3). • Sinbad has minimal impact on the imbalance in disk usage (0.57% of disk capacity), which remains well within the tolerable limit (10%) (§7.4). • If disks are never the bottlenecks, Sinbad improves the average block write time by 1.6× and the average end-to-end job completion time by up to 1.33× (§7.6). 7.1
2 25–49% 12% 5%
We divide the jobs into bins (Table 3) based on the fraction of their durations spent in writing. Bin-5 consists of write-only ingestion and preprocessing jobs (i.e., jobs with no shuffle), and bins 1–4 consist of typical MapReduce (MR) jobs with shuffle and write phases. The average duration of writes in these jobs in the original trace was 291 seconds.
In addition to fault tolerance, partition tolerance, and storage balancing, CFS clients can provide diverse suitability constraints. Collocation of blocks from different files to decrease network communication during equi-joins is such an example [23]. Because such constraints decrease Sinbad’s choices, the improvements are likely to be smaller. Sinbad satisfies them by filtering out unsuitable machines from Lcur (line 15 in Pseudocode 2).
7
1 < 25% 16% 22%
Metrics Our primary metric for comparison is the improvement in average completion times of individual block replication, tasks, and jobs (when its last task finished) in the workload, where F actor of Improvement =
M odif ied Current
We also consider the imbalance in link utilization across bottleneck links as well as the imbalance in disk usage/data distribution across the cluster. The baseline for our deployment is the uniform replica placement policy used in existing systems [4,19]. We compare the tracedriven simulator against the default policy as well.
Methodology
7.2
Workload Our workload is derived from the Facebook trace (§4). During the derivation, we preserve the original workload’s write characteristics, including the ratio of intermediate and write traffic, the inter-arrival times between jobs, the amount of imbalance in communication, and the input-to-output ratios for each stage. We scale down each job proportionally to match the size of our cluster.
Sinbad’s Overall Improvements
Sinbad reduces the average completion time of write-heavy jobs by up to 1.26× (Figure 6), and jobs across all bins gain a 1.29× boost in their average write completion times. Note that varying improvements in write times across bins are not correlated with the characteristics of jobs in those bins; blocks in these experiments were placed without considering any job-specific information. MR
237
0.25! Default! 0! 0!
0.75! 0.5! Network-Aware!
0.25!
Default! 0! 0!
1! Bin 1! Bin 2! Bin 3! Bin 4! Bin 5! ALL!
1! 2! 3! 4! Coeff. of Var. of Load! Across Rack-to-Core Links!
Fraction of Time! Fraction of Time!
Fraction of Time!
1.29! 1.19!
1.26! 1.28!
1.18! 1.24!
1.19! 1.08!
1.1!
1.08!
1.3! 1.2!
WriteTime! 1.27!
1.4!
1!
1!
End-to-End!
1.45!
1.5!
1.11!
Factor of Improvement!
1.6!
0.75! 1! 0.5!
Default! 0.5! 0!
0! 0.25!
(b) Downlinks
0! 0!
1! 2! 3! 4! Coeff. of Var. of Load! Across Host-to-Rack [Simulation] Network awareness decreases load imbalanceLinks! across
0.5!
0.5! 1! Default!
0! 0.5! 0!
0.25!
1! 2! 3! 4! Coeff. of Var. ofNetworkLoad! Across Core-to-Rack Links! Aware!
Default!
0! [10, 100)! [100, 1E3)![1E3, 1E4)![1E4, 1E5)! Job Write Size (MB)!
1!
Network-Aware!
0.25! 0.75!
Fraction of Time!
Fraction of Time! Fraction of Time!
1.22! 1.23!
1.13! 1.44!
1!
[0, 10)!
1! 2! 3! 4! NetworkCoeff. of Var. ofAware! Load! Default! Across Core-to-Rack Links!
Figure 8: 0.75! racks in the Facebook trace.
End-to-End! WriteTime! 1.08! 1.15!
1.11! 1.31!
1.5!
1.07! 1.20!
Factor of Improvement!
2!
Network-Aware!
0.75! 0.25!
(a) Uplinks 1!
Figure 6: [EC2] Improvements in average job completion times and time spent in distributed writes.
1! 2! 3! 4! Coeff. of Var. of Load! Across Rack-to-Core Links!
0.75! 0.5!
0!
0!
0!
Figure 7: [EC2] Improvements in jobs categorized by amounts of distributed writes.
NetworkAware! Default!
0.25!
1! 2! 3! 4! Coeff. of Var. of Load! Across Host-to-Rack Links!
(a) Uplinks
0!
1! 2! 3! 4! Coeff. of Var. of Load! Across Rack-to-Host Links!
(b) Downlinks
Figure 1!9: [EC2] Network awareness decreases load imbalance across machines. Fraction of Time!
jobs in bin-1 to bin-4 have lower overall improvements depending on their computation heaviness and because shuffle saw negligible change in these set of experiments. The average end-to-end completion times of jobs improved by 1.19× and block write time across all jobs improved by 1.3×. Being an online solution, Sinbad does not always perform well. We found that 15% of the jobs either had no improvements or experienced slightly higher overall completion times. In contrast, the top 15% jobs improved by at least 1.4×. Part of Sinbad’s inefficiency can also be attributed to its limited view of the network in the virtualized EC2 environment. A breakdown of improvements in jobs by their write sizes (Figure 7) does not show any significant difference between categories. This is because we optimize for blocks in the experiments using q = 0, which does not differentiate between different amounts each task or job writes.
0.75!
at sources; i.e., sources can also be placed at suitable locations be0.5! fore writes start. Note that unlike destination placement, this is Networkhard0.25! to achieve in practice because it is hard to predict when a task Aware! Default! might start writing. With this simplification, we found that 58% 0! improved, 39% remained the same, and 3% were worse requests 1! 2! 3! 4! off using0! Sinbad. The average improvements in block write time, Coeff. of Var. of Load! task completion time, and weighted job communication time were Across Rack-to-Host Links! 1.89×, 1.59×, and 1.36×, respectively. On Batched Decisions We did not observe significant improvement for q > 0 using OP T ′ . This is because the effectiveness of batching depends on the duration of the window to accumulate requests, which in turn depends on the request arrival rate and the average time to serve each request. Batching can only be effective when the arrival rate and/or the service time are substantial (i.e., larger blocks). In the Facebook trace, on average, 4 large block requests arrive every second. With 50 MBps disk write speed, writing a 256 MB block would take 5 seconds. However, the number of suitable bottleneck links is several times larger than the arrival rate. Consequently, batching for a second will not result in any improvement, but it will increase the average write time of those 4 blocks by 20%.
Trace-Driven Simulation Unlike the EC2 deployment, we precalculated the background traffic due to shuffle in the simulation and assumed it to be unaffected by placement decisions. Hence, we do not distinguish between jobs in different bins in the simulation. We used OP T ′ in the simulations with q = 10s. We found that 46% of individual block replication requests improved, 47% remained the same, and 7% became slower. The average improvement across all requests was 1.58×, and 16% completed at least 2× faster. Average completion times of writers and communication times of jobs (weighted by their sizes) improved by 1.39× and 1.18×, respectively.
7.3
Impact on Network Imbalance
We found that Sinbad decreases the network imbalance in both simulation and deployment. Figure 8 plots the change in imbalance of load in the bottleneck links in the Facebook cluster. We see that Sinbad significantly decreases load imbalance (Cv ) across up and downlinks of individual racks – decrease in median Cv being 0.35 and 0.33, respectively. We observed little improvement for very low imbalance (i.e., Cv close to zero), because most rack-to-core links had almost equal utilizations. Figure 9 presents the imbalance of load in the edge links con-
How Far are We From the Optimal? While it was not possible to exhaustively enumerate all possible orderings of block requests to find the optimal, we tried to find an upper bound on improvements. First, we increased q to more than ten (up to q = 100s), but it did not result in significant increase in improvements. Next, we tried a drastic simplification to find a loose upper bound. Keeping q = 10s, we assumed that there are no bottlenecks
238
Probab
0.6!
Probability Density of Blocks!
1!
0.5!
0.6! 0.5! 1!
26! 51! 76! 101! 126! 151! Rank of Racks!
0.6! 0.5! 1!
26! 51! 76! 101! 126! 151! Rank of Racks!
1.2!
1.27! 1.28!
1.3!
1! WriteTime!
End-to-End!
Bins 1-4!
WriteTime!
Bin 5!
Figure 11: [EC2] Improvements in average completion times with different arrival rates of jobs.
1!
Default!
We notice in Figure 11 that Sinbad performed well for different levels of network contention. However, changing the arrival rate by a factor of N does not exactly change the load by N ×; it depends on many factors including the number of tasks, the input-output ratio, and the actual amount of data in the scaled-down scenario. By making jobs arrive 2× faster, we saw around 1.4× slower absolute completion times for both policies (not shown in Figure 11); this suggests that the network load indeed increased by some amount. We observe that Sinbad’s improvements decreased as well: as the network becomes more and more congested, the probability of finding a less loaded destination decreases. Changing the arrival rate to the half of the original rate (i.e., 0.5× arrival rate) decreased the overall time by a negligible factor. This suggests that either the overlap between tasks did not change significantly, or the network was already not the main bottleneck of the cluster. For the write-only jobs, Sinbad’s improvements did not change either. However, for the MR jobs, shuffle time improved at the expense of corresponding writes.
0.8!
necting individual machines to the EC2 network. We notice that irrespective of the placement policy,0.7! the average values of imbalance (Cv ) are higher than that observed in our simulation. This is 0.6! because we are calculating network utilization and corresponding 0.5! imbalance at individual machines, instead of aggregating over 20 1! 26! 51! 76! 101! 126! 151! machines in each rack. We find that Sinbad decreases imbalance Rank of Racks! across edge links as well – decrease in median values of Cv for up and downlinks are 0.34 and 0.46, respectively. For high Cv values (Cv ≥ 2.5), Sinbad experienced more variations; we found most of these cases coinciding with low overall utilization periods, causing little impact on performance. Impact on Future Jobs (Disk Usage)
Since replica placement decisions impact future jobs,7 it is important to know whether Sinbad creates significant imbalance in terms of disk usage and the total number of blocks placed across bottleneck links. We found that after storing 9.24 TB data (including replicas) in an hour-long EC2 experiment, the standard deviation of disk usage across 100 machines was 15.8 GB using Sinbad. For the default policy it was 6.7 GB. In both cases, the imbalance was much less than 10% of the disk capacity, which would have triggered an automated block rebalancing. Simulations provided a similar result. Figure 10 presents the probability density functions of block and byte distributions across 150 racks at the end of a day-long simulation. We observe that Sinbad performs almost as good as the default uniform placement policy in terms of data distribution. Sinbad performs well because it is always reacting to the imbalance in the background traffic, which is uniformly distributed across all bottleneck links in the long run (§4.3). Because Sinbad does not introduce noticeable storage imbalance, it is not expected to adversely affect the data locality of future jobs. Reacting to network imbalance is not always perfect, however. We see in Figure 10 that some locations (less than 4%) received disproportionately large amounts of data. This is because these racks were down8 throughout most of the trace. 7.5
1.4!
End-to-End!
Figure 10: [Simulation] PDFs of blocks and bytes across racks. NetworkNetworkAware! aware placement decisions do not significantly 0.9! impact data distribution.
7.4
1.5!
1.1!
2X Arrival! Original Rate! 0.5X Arrival!
1.13!
0.7!
(b) Distribution of bytes Probability Density of Blocks!
(a) Distribution of blocks
Default! 0.8!
1.6!
1.14! 1.27! 1.26!
0.7!
0.9!
1.7!
1.25!
Default! 0.8!
NetworkAware!
1.45! 1.4!
0.9!
1!
1.08! 1.07! 1.1!
NetworkAware!
Factor of Improvement!
26! 51! 76! 101! 126! 151! Rank of Racks!
Probability Density of Bytes!
1!
7.6
Impact on In-Memory Storage Systems
So far we have considered Sinbad’s performance only on diskbased CFSes. However, improvements in these systems are bounded by the write throughput of disks and depend on how CFSes schedule writes across multiple disks. To avoid disk constraints, several in-memory storage systems and object caches have already been proposed [12]. To understand Sinbad’s potentials without disk constraints, we implemented an in-memory object cache similar to PACMan [12]. Blocks are replicated and stored in the memory of different machines, and they are evicted (in FIFO order) when caches become full. Note that the network is the only bottleneck in this setup. We used the same settings from §7.2. From EC2 experiments, we found that jobs across all bins gained boosts of 1.44× and 1.33× in their average write and end-to-end completion times, respectively. The average block write time improved by 1.6× using Sinbad in the in-memory CFS. A trace-driven simulation without disk constraints showed a 1.79× average improvement across all block write requests. We found that 64% of individual block replication requests improved, 29% remained the same, and 7% became slower. Average completion times of writers and communication times of jobs (weighted by their sizes) improved by 1.4× and 1.15×, respectively.
Impact of Cluster/Network Load
To understand the impact of network contention, we compared Sinbad with the default placement policy by changing the arrival rate of jobs. In this case, we used a shorter trace with the same job mix, scaled down jobs as before, but we spread the jobs apart over time.
8
Discussion
Network-Assisted Measurements In the virtualized EC2 environment, Sinbad slaves cannot observe anyone else’s traffic in the network including that of collocated VMs. This limits Sinbad’s effectiveness. When deployed in private clusters, with proper instrumentation (e.g., queryable SDN switches), Sinbad would observe
7
Placing too many blocks in some machines and too few in others can decrease data locality. 8 Likely reasons for downtimes include failure or upgrade, but it can be due to any number of reasons.
239
the impact of all incoming and outgoing traffic. We expect that correcting for more imbalances will increase Sinbad’s gains. Sinbad is also sensitive to delayed and missing heartbeats, which can introduce inaccuracy in usage estimations. By placing the heartbeats in a higher priority queue [24], the network can ensure their timely arrival.
post facto, meaning each block of data is three-way replicated first, then coded lazily, and replicas are deleted after coding finishes. This has two implications. First, network awareness accelerates the end-to-end coding process. Second, in presence of failures and following rebuilding storms, the network experiences even more contention; this further strengthens the case for Sinbad.
Flexible Source Placement Achieving network awareness throughout the entire write pipeline requires modifying the task scheduler to carefully place the writers. However, a task must finish everything else – e.g., computation for a preprocessing task and shuffle for a reducer – before it starts writing. Estimating the start time or the size of a write operation is nontrivial. Even though all the blocks from a writer can have different destinations, they must leave from the same source. This further decreases the flexibility in source placement.
Data Locality Disk locality [22] has received more attention than most concepts in data-intensive computing, in designing both distributed file systems and schedulers for data-intensive applications [10, 34, 44]. Data locality, however, decreases network usage only during reads; it cannot obviate network consumption due to distributed writes. Sinbad has little impact on data locality, because it keeps the storage balanced. Moreover, Sinbad can help systems like Scarlett [11] that try to decrease read contention by increasing the number of replicas. Recent calls for memory locality [12] will make network-aware replication even more relevant by increasing network contention during off-rack reads.
Optimizing Parallel Writers The completion time of a dataparallel job depends on the task that takes the longest to finish [20, 21]. Hence, to directly minimize the job completion time, one must minimize the makespan of all the concurrent writers of that job. This, however, calls for a cross-layer design with additional job-specific details in the placement algorithm.
9
10
Conclusion
We have identified the replication traffic from writes to cluster file systems (CFSes) as one of the major sources of network communication in data-intensive clusters. By leveraging the fact that a CFS only requires placing replicas in any subset of feasible machines, we have designed and evaluated Sinbad, a system that identifies network imbalance through periodic measurements and exploits the flexibility in endpoint placement to navigate around congested links. Network-balanced replica placement improves the average block write time by 1.3× and the average completion time of data-intensive jobs by up to 1.26× in EC2 experiments. Because network hotspots show short-term stability but they are uniformly distributed in the long term, storage remains balanced. We have also shown that Sinbad’s improvements are close to that of the optimal, and they will increase if network imbalance increases.
Related Work
Datacenter Traffic Management Hedera [8] manages individual flows using a centralized scheduler to increase network throughput by choosing among multiple paths in a fat-tree topology to the same pre-destined endpoints. MicroTE [13] adapts to traffic variations by leveraging short-term predictability of the traffic matrix. Orchestra [20] is limited to data-intensive applications and does not consider the network impact of cluster storage. All of the above manage flows with already-fixed endpoints and do not leverage the flexibility in endpoint placement available during replication. Endpoint-Flexible Transfers Overlay anycast comes the closest to Sinbad in exploiting flexibility in choosing endpoints [18, 25]. However, anycast has typically been used in lightweight requestresponse traffic (e.g., DNS requests); on the contrary, we use endpoint flexibility in a throughput-sensitive context for replica placement. Our constraints – number of replicas/fault domains and overall storage balancing – are different as well.
Acknowledgments We thank Yuan Zhong, Matei Zaharia, Gautam Kumar, Dave Maltz, Ali Ghodsi, Ganesh Ananthanarayanan, Raj Jain, the AMPLab members, our shepherd John Byers, and the anonymous reviewers for useful feedback. This research is supported in part by NSF CISE Expeditions award CCF-1139158 and DARPA XData Award FA8750-12-2-0331, and gifts from Amazon Web Services, Google, SAP, Blue Goji, Cisco, Clearstory Data, Cloudera, Ericsson, Facebook, General Electric, Hortonworks, Huawei, Intel, Microsoft, NetApp, Oracle, Quanta, Samsung, Splunk, VMware, Yahoo!, and a Facebook Fellowship.
Full Bisection Bandwidth Networks Recent datacenter network architectures [28–30, 38] aim for full bisection bandwidth for better performance. This, however, does not imply infinite bisection bandwidth. In presence of (skewed) data-intensive communication, some links often become more congested than others [35]. Selection of appropriate destinations during replica placement is necessary to pick less congested destinations.
11
Distributed File Systems Distributed file systems [15, 19, 27] focus primarily on the fault-tolerance and consistency of stored data without considering the network impact. Replica placement policies emphasize on increasing availability in presence of network failures. We focus on performance improvement through networkbalanced replica placement without changing any of the faulttolerance, availability, or consistency guarantees. Unlike traditional designs, Flat Datacenter Storage (FDS) keeps computation and storage separate: data is always read over the network [39]. FDS does not have a centralized master and uses randomization for load balancing. Network-awareness can potentially improve its performance as well.
References
[1] Amazon EC2. http://aws.amazon.com/ec2. [2] Amazon Simple Storage Service. http://aws.amazon.com/s3. [3] Apache Hadoop. http://hadoop.apache.org. [4] Facebook Production HDFS. http://goo.gl/BGGuf. [5] How Big is Facebook’s Data? 2.5 Billion Pieces Of Content And 500+ Terabytes Ingested Every Day. TechCrunch http://goo.gl/n8xhq. [6] Total number of objects stored in Amazon S3. http://goo.gl/WTh6o. [7] S. Agarwal et al. Reoptimizing data parallel computing. In NSDI, 2012. [8] M. Al-Fares et al. Hedera: Dynamic flow scheduling for data center networks. In NSDI, 2010. [9] N. Alon et al. Approximation schemes for scheduling on parallel machines. Journal of Scheduling, 1:55–66, 1998.
Erasure-Coded Storage Systems To mitigate the storage crunch and to achieve better reliability, erasure coding of stored data is becoming commonplace [33, 40]. However, coding typically happens
240
[10] G. Ananthanarayanan et al. Reining in the outliers in mapreduce clusters using Mantri. In OSDI, 2010. [11] G. Ananthanarayanan et al. Scarlett: Coping with skewed popularity content in mapreduce clusters. In EuroSys, 2011. [12] G. Ananthanarayanan et al. PACMan: Coordinated memory caching for parallel jobs. In NSDI, 2012. [13] T. Benson et al. MicroTE: Fine grained traffic engineering for data centers. In CoNEXT, 2011. [14] P. Bodik et al. Surviving failures in bandwidth-constrained datacenters. In SIGCOMM, 2012. [15] D. Borthakur. The Hadoop distributed file system: Architecture and design. Hadoop Project Website, 2007. [16] D. Borthakur et al. Apache Hadoop goes realtime at Facebook. In SIGMOD, pages 1071–1080, 2011. [17] B. Calder et al. Windows Azure Storage: A highly available cloud storage service with strong consistency. In SOSP, 2011. [18] M. Castro et al. Scalable application-level anycast for highly dynamic groups. LNCS, 2816:47–57, 2003. [19] R. Chaiken et al. SCOPE: Easy and efficient parallel processing of massive datasets. In VLDB, 2008. [20] M. Chowdhury et al. Managing data transfers in computer clusters with Orchestra. In SIGCOMM, 2011. [21] M. Chowdhury and I. Stoica. Coflow: A networking abstraction for cluster applications. In HotNets-XI, pages 31–36, 2012. [22] J. Dean and S. Ghemawat. MapReduce: Simplified data processing on large clusters. In OSDI, pages 137–150, 2004. [23] M. Y. Eltabakh et al. CoHadoop: Flexible data placement and its exploitation in hadoop. In VLDB, 2011. [24] A. D. Ferguson et al. Hierarchical policies for Software Defined Networks. In HotSDN, pages 37–42, 2012. [25] M. Freedman, K. Lakshminarayanan, and D. Mazières. OASIS: Anycast for any service. NSDI, 2006. [26] M. Garey and D. Johnson. “Strong” NP-completeness results: Motivation, examples, and implications. Journal of the ACM, 25(3):499–508, 1978. [27] S. Ghemawat, H. Gobioff, and S.-T. Leung. The Google file system. In SOSP, 2003. [28] A. Greenberg et al. VL2: A scalable and flexible data center network. In SIGCOMM, 2009. [29] C. Guo et al. DCell: A scalable and fault-tolerant network structure for data centers. In SIGCOMM, pages 75–86, 2008. [30] C. Guo et al. BCube: A High Performance, Server-centric Network Architecture for Modular Data Centers. ACM SIGCOMM, 2009. [31] Z. Guo et al. Spotting code optimizations in data-parallel pipelines through PeriSCOPE. In OSDI, 2012. [32] B. Hindman et al. Mesos: A Platform for Fine-Grained Resource Sharing in the Data Center. In NSDI, 2011. [33] C. Huang et al. Erasure coding in Windows Azure Storage. In USENIX ATC, 2012. [34] M. Isard et al. Quincy: Fair scheduling for distributed computing clusters. In SOSP, 2009. [35] S. Kandula et al. The nature of datacenter traffic: Measurements and analysis. In IMC, 2009. [36] J. Lenstra, D. Shmoys, and É. Tardos. Approximation algorithms for scheduling unrelated parallel machines. Mathematical Programming, 46(1):259–271, 1990. [37] R. Motwani, S. Phillips, and E. Torng. Non-clairvoyant scheduling, 1993. [38] R. N. Mysore et al. PortLand: A scalable fault-tolerant layer 2 data center network fabric. In SIGCOMM, pages 39–50, 2009. [39] E. Nightingale et al. Flat Datacenter Storage. In OSDI, 2012. [40] M. Sathiamoorthy et al. XORing elephants: Novel erasure codes for big data. In PVLDB, 2013. [41] A. Thusoo et al. Data warehousing and analytics infrastructure at Facebook. In SIGMOD, 2010. [42] R. van Renesse and F. B. Schneider. Chain replication for supporting high throughput and availability. In OSDI, 2004. [43] M. Zaharia et al. Improving mapreduce performance in heterogeneous environments. In OSDI, 2008.
[44] M. Zaharia et al. Delay scheduling: A simple technique for achieving locality and fairness in cluster scheduling. In EuroSys, 2010. [45] M. Zaharia et al. Resilient distributed datasets: A fault-tolerant abstraction for in-memory cluster computing. In NSDI, 2012.
APPENDIX A
Optimizing Block Writes
A.1
Problem Formulation and Complexity
Assume that a replica placement request for a block B of size Size(B) arrives at time Arr(B) with replication factor r and faulttolerance factor f . The CFS client will write a local copy wherever it is located, and the replica placement policy must find locations for (r − 1) off-rack copies in f other fault domains across rack boundaries. We choose r = 2 and f = 1 to simplify the analysis: the case of larger r is ignored, because an increase in r does not increase the number of off-rack copies; the case of larger f is discussed in §A.2. Assume that there are no other constraints besides physical limits such as link capacity and disk throughput. Let L denote the set of possible bottleneck links in the network. Also, let Cap(l) and Ut (l) denote the capacity and the estimation of the utilization of link l ∈ L at time t. Placement decisions are instantaneous. For a given time period T (discretized into equal-sized decision interval or quanta, q) from t, the objective (U(.)) can then be represented by the following equation. ∑ Minimize Dur(B) (1) {B | Arr(B)∈[t,t+T )}
where Dur(B) is the time to write a block B from Arr(B). Distributed writing (i.e., optimizing U) is NP-hard, even when all block requests and link capacities are known beforehand. Theorem A.1 Distributed Writing is NP-hard. Proof Sketch We prove it by giving a reduction from job shop scheduling, which is NP-hard [26]. Consider each link l to have the same capacity, and B to be the set of blocks that arrive over time with different sizes. Also note that once the CFS client starts writing a block, its location cannot be changed. Then, optimally scheduling |B| jobs on |L|(> 2) identical machines without preemption will provide the optimal replica placement decisions. ■ A.2
Optimal Block Placement Algorithm
If all blocks have the same size, decision intervals are independent, and link utilizations do not change within the same decision interval, greedy assignment of blocks to the least-loaded link will maximize U. Theorem A.2 Under the assumptions in Section 5.1, greedy assignment of blocks to the least-loaded link is optimal (OP T ). Proof Sketch Assume that bottleneck links l ∈ L at time t are sorted in non-decreasing order (l1 ≤ l2 ≤ . . . ≤ l|L| ) of their current utilization, and multiple block requests (B = {Bj }) of equal size arrived at t. Since all blocks have the same size, they are indistinguishable and can be assigned to corresponding destinations through some bottleneck links one by one. Assume block Bj is placed through a bottleneck link li . If there is another link li−1 with more available capacity, then we can simply place Bj through li−1 for a faster overall completion time. This process will continue until there is no more such links, and Bj has been placed through l1 – the least-loaded bottleneck link. ■
241
Probability of Experiencing Slowdown!
1! 0.8!
50%! 40%! 30%!
0.6!
20%!
0.4!
where G is the number of congested links in L. As f increases, so does P (UniSlowdown); Figure 12 shows this for different values of G in a 150-rack cluster. The extent of U N I slowdown (thus I) depends on the distribution of imbalance.
10%!
0.2! 2! 3! Number of Fault Domains, f!
4!
Figure 12: Analytical probability of at least one off-rack replica experiencing a slowdown with uniform placement, as the number of off-rack replicas (f ) increases. Each line corresponds to the fraction of contended links (out of 150) that can cause slowdown.
Bj ∈W
ing all the blocks of W from Arr(W ). Optimizing (6) is no easier than optimizing (1), and it is NP-hard as well. B.2
where DiskWriteCap is the write throughput of a disk. Then the completion time of OP T for writing |B| blocks that must be placed during that quantum is
i=1
fi AC(li )
|L| |B|Size(B) ∑ 1 |L| AC(l i) i=1
Optimal File Write Algorithm
Lemma B.1 OP T is not optimal for end-to-end write operations with multiple blocks (V). Proof Sketch We prove this using a counterexample. Let us take a simple example with two bottleneck links, l1 and l2 , through which a single block can be written in d1 and d2 time units (d1 < d2 and d1 , d2 ≤ 1 time unit), respectively. Also assume that two write requests W1 = (B11 , B12 ) and W2 = (B21 ) arrive at the same time t; more specifically, B11 and B21 arrive at t and B12 arrives at (t + 1). Because OP T treats requests interchangeably, it can either write B11 through l1 and B21 through l2 or in the inverse order (B11 through l2 and vice versa) at t. In either case, OP T will write B12 through l1 at (t+1) because d1 is smaller. Irrespective of the order, U(OP T ) = 2d1 + d2 . However, end-to-end response times are different for the two cases: in the former, V1 = (1 + d1 ) + d2 , while in the latter, V2 = (1 + d1 ) + d1 . Because OP T can choose either with equal probability, its expected total response time is 12 (V1 + V2 ), which is more than the actual optimal V2 . ■
(2)
where fi is the fraction of blocks allocated through li . Because OP T greedily places blocks starting from the least-loaded link, higher AC(li ) will result in higher fi . Current CFS replica placement algorithms (U N I) place replicas uniformly randomly across all bottleneck links. The expected time for U N I to write |B| blocks that must be placed during a single quantum is U(U N I) =
Problem Formulation and Complexity
where Dur(W ) = max Dur(Bj ) denotes the time to finish writ-
AC(li ) = min(Cap(li ) − Ut (li ), DiskWriteCap)
|L| ∑
B.1
{W | Arr(W )∈[t,t+T )}
Improvements Over the Default Policy Let AC(li ) denote the available capacity to write block B through li ,
U(OP T ) = |B|Size(B)
Optimizing File Writes
Assume that a file W = (B1 , B2 , . . . , B|W | ) with |W | blocks arrives at Arr(W ). Requests for its individual blocks Bj arrive one at a time, each at the beginning of a discrete decision interval. For a given time period T (discretized into equal-sized quanta, q) from t, the objective (V(.)) can then be represented by the following equation. ∑ Minimize Dur(W ) (6)
0! 1!
B
(3)
1 ) of blocks. where each link li will receive equal fractions ( |L| Given (2) and (3), the factor of improvement (I) of OP T over U N I at any decision interval is ∑|L| fi U(U N I) i=1 AC(li ) I= = |L| ∑|L| (4) 1 U(OP T ) i=1
Theorem B.2 Given Theorem A.2, greedy assignment of writes through links using the least-remaining-blocks-first order is optimal (OP T ′ ).
AC(li )
The overall improvement during the discretized interval [t, t + T ) is ∑ U(U N I) ∑ [t,t+T ) (5) U(OP T) [t,t+T )
Proof Sketch Given OP T , bottleneck links li ∈ L at time t are sorted in non-decreasing order of their expected times to write a block (i.e., ordered by di ), and multiple equal-sized block requests (B = {Bj }) from unique write operations (W = {Wj }) have arrived. Let us denote the number of remaining blocks in a write operation Wj by Rem(Wj ). Consider two blocks Bj and Bj+1 from writes Wj and Wj+1 that will be considered one after another and will be assigned to destinations through links li and li+1 such that di ≤ di+1 . Assume, Rem(Wj ) > 1 and Rem(Wj+1 ) = 1. Now, the total contributions of Bj and Bj+1 to V(OP T ′ ) is (1 + di+1 ). We can decrease it to (1 + di ) by swapping the order of Bj and Bj+1 . By continuously applying this reordering, we will end up with an order where blocks from writes with fewer remaining blocks will end up in front. ■
Improvements for f > 1 We have assumed that only one copy of each block crosses the bottleneck links (i.e., f = 1). However, for a given placement request, the probability of experiencing contention using U N I increases with f ; this should increase I, because OP T will never experience more contention than U N I. While creating replicas in f fault domains through |L|(≫ f ) bottleneck links, if one of the f replicas experience contention, the entire write will become slower. Using the uniform placement policy, the probability of at least one of them experiencing contention is f ( ∏ |L| − G − g + 1 ) P (UniSlowdown) = 1 − |L| − g + 1 g=1
242