1957. Information theory and statistical mechanics. Physical review, 106(4), 620. http://dx.doi.org/10.1103/PhysRev.106.620. 21. Magnus S. Magnusson. 2000.
Leveraging Human Routine Models to Detect and Generate Human Behaviors
exercising patterns, inexperienced or aggressive operation of vehicles) they can negatively impact people’s health and wellbeing. Thus, an ability to detect behavior instances that are characteristic of poor routines could enable technology that raises people’s awareness of their poor routines, shows them how they could improve their routines, and thus helps them improve the quality of their lives.
ABSTRACT
An ability to detect behaviors that negatively impact people’s wellbeing and show people how they can correct those behaviors could enable technology that improves people’s lives. Existing supervised machine learning approaches to detect and generate such behaviors require lengthy and expensive data labeling by domain experts. In this work, we focus on the domain of routine behaviors, where we model routines as a series of frequent actions that people perform in specific situations. We present an approach that bypasses labeling each behavior instance that a person exhibits. Instead, we weakly label instances using people’s demonstrated routine. We classify and generate new instances based on the probability that they belong to the routine model. We illustrate our approach on an example system that helps drivers become aware of and understand their aggressive driving behaviors. Our work enables technology that can trigger interventions and help people reflect on their behaviors when those behaviors are likely to negatively impact them.
A recent routine modeling approach by Banovic et al. [3] enables researchers to manually explore and understand what behaviors characterize routines (e.g., differences between models of aggressive and non-aggressive driving). Routines, like most other kinds of human behaviors, may vary and adapt based on feedback and preference [14]. Thus, a routine model may capture many behavior instances—sequences of actions that people perform in different situations. We refer to the different ways that behavior instances manifest themselves in routine models as routine variations. Routine variations capture different ways that people respond to the same situations, and occur often enough to be considered part of a routine, even if they are not the most probable routine. Variations are different from deviations and other uncharacteristic behavior that occur rarely and thus do not contribute to a routine model.
Author Keywords
Inverse Reinforcement Learning; Maximum Entropy. ACM Classification Keywords
H.5.m. Information interfaces and presentation (e.g., HCI): Miscellaneous.
Manually exploring and labeling all routine variations in a model to separate them from deviations is tedious. Without an ability to automatically detect and generate routine behavior instances, we face significant obstacles in developing technologies that help people improve their routines. For example, to alert drivers when their behavior is characteristic of an aggressive driving routine requires manually finding all routine variations in the model that are characteristic of aggressive driving behavior. Similarly, showing the driver a non-aggressive alternative for the aggressive driving behavior above would require manually identifying an appropriate non-aggressive routine variation.
INTRODUCTION
Routines are characterized by behaviors that people learn and develop over time to accomplish frequent tasks and activities. Routines consist of sequences of frequent actions that people perform in response to different situations [17]. Routines span every aspect of people’s lives, including their daily schedules, their sleeping and exercising patterns, and even low-level tasks, such as how they operate their vehicle through an intersection. However, when routines are characterized by poor behaviors (e.g., irregular sleeping and
Thus, our first goal is to automatically detect which behavior instances are more characteristic of one routine (such as aggressive driving) than another (non-aggressive driving). However, there is no available technique that already satisfies this goal. Automated anomaly detection algorithms (e.g., [8]), which do not require any manual labeling, focus on deviations from some normal or expected behavior; i.e., they can be used to classify which behavior instances are not routine. However, they do not classify whether a behavior is a variation of one routine vs. another.
In submission to CHI 2017
1
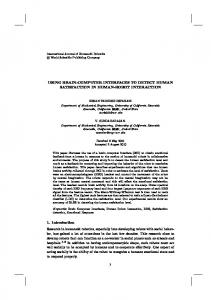
Figure 1. Driving behavior detection and generation tool user interface. The main animation region (A) shows a scenario in which a vehicle travels straight through an intersection. The simplified intersection consists of a main road with 25 miles per hour speed limit and a residential street with stop signs for opposing traffic. The current scenario depicts an automatically detected aggressive driving behavior (speeding transparent vehicle) and an automatically generated non-aggressive behavior (opaque vehicle, which drives within the posted speed limit). Dials (A1) show the vehicles’ speed, and gas and brake pedal positions. The user can: B1) select a driver and a trip to review, B2) replay current driver behavior, B3 & B5) load previous and next driving behavior in the current trip, and B4) play or replay an automatically generated non-aggressive behavior for the given driving scenario.
the person that exhibited those behaviors. For example, if a driver has had traffic violations due to aggressive driving, we would label all of the driver’s behavior instances as aggressive. We train a population model using the behavior instances for each unique routine label (e.g., one model for aggressive and one for non-aggressive driving). We then classify new behavior instances into one model or the other, given knowledge about the probabilities that each behavior instance will occur. We use the same probabilities to sample (generate) behavior instances from the models.
Other unsupervised methods can cluster behavior instances (e.g., [13]), but they offer no guarantees that the behavior instance clusters they generate map onto routines. Our second goal is to automatically generate behavior instances that are characteristic of a routine. Traditional supervised approaches to classifying behaviors (e.g., [10]) could be used to predict people’s next action given a situation, and thus generate that behavior. However, they too would require labeling each instance individually as belonging to one routine model or another. Semi-supervised approaches [9] require labels for a portion of the training data, but labeling even a subset of data is challenging when knowledge about what constitutes a variation of a particular routine is not available beforehand.
We test external validity and show a real-life application of our work in a series of user studies. We show how our work informs technology that helps people identify instances of aggressive and non-aggressive driving through use of animation (Figure 1). We train our driving routine models on a naturalistic driving dataset of 13 aggressive and 13 non-aggressive drivers, labeled based on their driving history [18]. Through our own analysis and with help from driving instructors, we show that our algorithm accurately detects aggressive behaviors and generates meaningful nonaggressive alternatives. In another user study, we show that our approach helps raise drivers’ awareness of their own aggressive behaviors. Our algorithm identifies problematic behaviors and suggests ways to improve those behaviors, and thus has applications to behavior change technology.
Our main contribution is the insight that an existing routine modeling approach [3] computes the probability of true labels of all variations and deviations in a routine model. This lets us apply probability axioms to automatically detect and generate characteristic behaviors for that model. To address manual labeling challenges, we train our routine models using weakly labeled data, which is an alternative to fully labeled datasets. Weak labels do not necessarily place every instance into the correct class [19, 22]. Instead of labeling each behavior instance individually, we label all behavior instances at once based on the known routine of 2
is to weakly label data using “side information”—or information that implies the true label [22]. To minimize the noise in the data, the side information needs to be determined in a principled way. For example, Reason et al. [25] developed a standardized questionnaire that could classify people as aggressive or non-aggressive drivers. Such questionnaires could be used to label all behavior instances of people based on their questionnaire responses.
BEHAVIOR DETECTION AND SAMPLING CHALLENGES
The lack of individually labeled behavior instances makes it challenging to use existing supervised machine learning algorithms to classify behavior instances into routines. For example, Davidoff et al. [10] trained a supervised machine learning algorithm to classify behavior instances that lead parents to forget to pickup their children. To do this, they had to manually label each behavior instance in the behavior logs they collected and confirm this information with the participants in their study [10]. This places significant burden on developers to properly label enough data to be able to train their algorithms.
Because weak labels are by definition noisy, once labels are collected they need to be processed and improved. For example, weak labels could be adjusted according to estimated class proportions [28] or distribution of labels in the training set [22]. Such methods try to minimize the difference between the probability distribution of instances in the model and in the training data. They are often used in conjunction with semi-supervised learning methods [9] that use a small subset of labels to estimate the probability distribution of labels in the rest of the data. However, they too face challenges when the knowledge required to produce even a subset of labels is not available beforehand.
Such traditional machine learning methods may be used to generate behavior by predicting the action that the person is likely to perform in the current situation. This is because the labels for this task are implicit—the observed next action in the training behavior sequence offers ground truth of what the person actually did in the given situation. However, such methods may not be able to capture the complex sequences of situations and actions that make up routines. Also, the goal of those methods is to predict the most likely action in a given situation, which may hide the uncertainty and variance in human behavior.
MODELING, DETECTING AND GENERATING BEHAVIOR
Here, we show how a recent routine modeling approach [3] enables us to detect and generate behavior instances that are variations of a routine using only weak labels. This routine modeling approach ensures that the probability distribution of routine labels fits the distribution of labels in training data in a principled way. This is similar to existing weak labeling approaches (e.g., [22]), except that it requires no prior labels for any behavior instances. We estimate the probabilities of people being in different situations and the conditional probability of actions they perform in those situations (even for situation and action pairs not present in the training data). Those probabilities enable us to sample and generate behavior instances that belong to a routine.
Generative methods based on deep learning (for a review see [26]) offer a way to capture more nuanced structures of routines. With enough labeled data, such methods can be trained to classify behavior instances, and even generate behavior using statistical sampling methods. However, unlike routine modeling approaches that have been shown to capture meaningful routines [3], the models trained using existing deep learning methods are difficult to inspect and understand by humans to ensure that they capture actual routine patterns in the data. Unfortunately, the existing routine models [6, 7, 12, 21], with the exception of [3], do not capture the probabilities that behavior instances belong to a routine model. This makes it challenging to detect and generate new behaviors using those routine models.
Estimating Probabilities of Situations and Actions
The routine model from [3], which we use to estimate the probabilities of different behavior instances, is based on the Markov Decision Processes (MDP) framework [24]. The model estimates the probability of situations and actions using the principle of Maximum Causal Entropy [29], which ensures that the model does not make any more or less assumptions about the causal relationships between situations and actions that make up the behavior instances than what is present in the behavior log data.
Unsupervised machine learning methods cluster behaviors without prior knowledge of labels. For example, algorithms based on Topic Models [13] allow researchers to generate clusters of behavior instances. However, the main limitation of unsupervised methods is that they offer no guarantees that the resulting clusters group instances based on the routine they belong to (i.e., the clusters may not represent routines). Unsupervised anomaly detection algorithms (e.g., [16]) could be used to find differences between behavior instances. However, they detect if a behavior instance is a deviation from a routine (i.e., behavior uncharacteristic of the routine), but not whether it is part of the routine.
The model we use is a tuple: � � �� �� � � � ��� � � �� � � ����� ����������������� consisting of a set of states ���� � �� representing situations, and actions ���� � �� that a person can take. Each state and action is expressed by feature vectors �� and �� that describe the unique states and actions in the model. For example, in a model that captures driving behavior, the state features would describe the road and the vehicle, and the action features would describe how the driver operates the vehicle (e.g., pressing and depressing the pedals).
Weakly labeled data approaches [19, 22] offer an efficient way to label data from large behavior logs. Such methods attempt to acquire error-prone but inexpensive labels, which introduces noise into the classification process. An example is to crowdsource labels [15], which works when the correct label is relatively clear to a naïve observer. Another option 3
To classify the behavior instances requires an indicator function that, given a behavior instance �, results in � when the instance is in routine �, and � when it is not. We define the following indicator function as our classifier:
The probability of the next state after the person performs an action in the current state � � � ��� � represents how the actions that people perform in different situations affect their environment and vice-versa. The model also contains the expected frequency of states (�� ), which estimates how frequently each state occurs in behavior instances in this model. Training a model on behavior instances from only people who have shown evidence of a specific routine model �, allows us to estimate the probability of situations (����) using �� , and conditional probability of actions given situations (� ����� ), which estimates how likely the person, with this behavior model, is to perform action � in a state � in that model. For a more detailed description of the model and calculations, see [3].
� � � � � � � ���� � � � � � � � ����� ������������ Note that existing supervised machine learning algorithms [5] would require per-instance labels to calculate � ����� for each routine. We instead calculate the probability that behavior instance � belongs to routine � using Bayes rule: � ����� � �
� ����� � � � ���������������������� � �
where � ����� is the probability of the instance given that it belongs to the routine �, � � is the probability that the routine of the person whose behavior we are classifying is �, and � � is the probability that people, regardless of their routine, would perform behavior instance �.
Classifying Behavior Instances
We extend the existing model’s ability to support manual behavior classification to enable it to automatically classify behavior instances based on what routine they are a part of. To detect behavior instances that negatively impact people, we need to show that they are variations of routines that negatively impact people. To show that a behavior instance could have a positive impact, we need to show that it is a variation of a good routine. Because we weakly label behavior instances per-person based on their routines, and not per-instance, we have to ensure that only variations of a given routine model are detected and not variations of another opposite routine.
Assuming two models of opposing routines � and � � with probabilities of all possible behavior instances in the model, by law of total probability, Equation 6 becomes: � ����� � �
� ����� � � � ����� � ����� � � � � � ����� � � � � �
Estimating the probabilities of behavior instances requires careful consideration. We define behavior instance � as a finite, ordered sequence of situations and actions ��� � �� � �� � �� � � � �� � �� �, where in each situation �� in the sequence, the person performs action �� which results in a new situation ���� . Then, assuming that each situation depends only on the previous situation and action, we calculate the probability of the behavior instance using:
To classify a behavior instance, we need to calculate the probability that it belongs to a particular routine. Let � be a behavior instance, and let � be a routine model. The probability that behavior instance � belongs to routine model � is given by � ����� . Also, we say that behavior instance � does not belong to routine � (i.e., � is a deviation from the routine) if for some level � � � � �:
� ��� � � �� �
� ����� � �����������������������������������������
� �� �� � � ���� �� � �� ������������� �
where the probability of the initial situation �� (� �� ) and the conditional probability of actions given situations (� �� �� ) are specific to routine model �.
Then, behavior instance � is more likely to belong to routine model � than some other routine model � � , if: � � � ���� � � ����� ��������������������������������
Generating Behavior Instances
Given two routine models � and � � (e.g., one that negatively impacts people and the other that impacts them positively), we can say that behavior instance � is in routine �, but not in routine � � , if for some level � � � � �:
We enable the model to automatically generate behavior instances that are variations of a routine. Traditionally, having an MDP model allows us to find the sequence of situations and actions that maximizes expected reward based on a reward function [4]. In our case, this is the most probable behavior instance starting from a given situation. However, generating only the most probable instances hides the inherent uncertainty and variance in human behavior.
� � � ���� � � ��� � �� ����� ��������������������������� Intuitively, Equation 4 means that, if we have evidence that � is a deviation from � � , but cannot show evidence that it is also a deviation from �, then � is classified as �. Thus, � represents the probability that a behavior instance is a deviation. Increasing the value of � increases our chance of false positives (classifying � as �, when it is not a variation of �), while decreasing � increases the chances of false negatives (not classifying � as �, when � is a variation of �). Note that Equation 4 implies that Equation 3 also holds.
Instead, we sample behavior instances using the probability distributions in a routine model. We start by sampling an initial situation �� from the probability distribution of situations (����). We then sample the next action from the probability distribution of actions given situation �� (� � �� ), which gives us an action �� . We then sample the next situation in the sequence using transition probabilities 4
� ���� � �� and get a situation �� . We repeat this process for situation �� and so on until we encounter a stopping situation or reach a maximum behavior instance length.
Table 1. Situation features capturing the different contexts the driver can be in.
This procedure allows us to sample from a subset of initial situations constrained on the values of the features of those situations (� � �� ). For example, for driving, we could sample situations when a driver is approaching a four-stop intersection. This conditional probability distribution can easily be computed from situation frequencies (�� ) from a routine model. This allows us to generate behavior instances characteristic of a routine for specific situations.
Maneuver
Feature
Position Rush hour Intersection Traffic signs Maximum Speed
DETECTING AND GENERATING DRIVING BEHAVIORS
We illustrate our approach using a real-life use case in the driving domain. Poor driving routines negatively impact people. Drivers who routinely engage in aggressive driving behaviors present a hazard to other people in traffic [2]. The ability to automatically detect aggressive driving instances enables technology to help drivers improve. For example, a system could try to calm the driver to avoid immediate future aggressive behaviors. It could wait until after the trip is over and show the driver a better, non-aggressive way to drive on the same portion of the trip where the driver drove aggressively. If the driver continues to drive aggressively, the system could suggest that the driver take corrective driving classes with a list of particular instances to work on.
Speed Throttle Acceleration
Description Goals The type of maneuver at the intersection {STRAIGHT, RIGHT TURN, LEFT TURN} Environment Current position of the vehicle in the intersection {APPROACHING, ENTERING, EXITING, AFTER} Whether the trip is during rush hour or not {TRUE, FALSE} Intersection layout including road types in each direction (40 discrete values) Traffic signal layout {STOP, STOP OPPOSITE, ALL STOP, LIGHT SIGNAL} The maximum speed in each position of the intersection. {25, 35, 45} Vehicle Current vehicle speed (5-bin discretized + stopped) Current throttle position (3-bin discretized) Current positive/negative acceleration (5-bin discretized)
Table 2. Action features representing actions that drivers can perform between stages of the intersection. Feature Pedal
Description Aggregated gas and break pedal operation between intersection positions (47 discrete values)
or not, whereas in the old dataset this was not possible. Lack of information about other vehicles that may have impacted the driver’s behavior remains a limitation. We divide intersections into four stages (approaching, entering, exiting, and leaving the intersection). Sequences of these stages are the behavior instances in our model. Position information, along with the type of maneuver and details of the vehicle, such as its current speed, make up the situation features (Table 1). Actions in our model represent how the driver operates the vehicle by depressing the gas (throttle) and brake pedals. Because we model driving through an intersection in stages, we aggregate the driver’s actions between different intersection stages to represent the changes in throttle and braking levels (Table 2).
Labeling driving behavior instances is difficult because drivers may be prone to aggressive driving behavior in some situations, but not in others (e.g., rushing yellow lights during rush hour [27]). High-level characteristics of aggressive routines (e.g., speeding) can be detected with lengthy manual observations [27]. However, high-level observations may not capture nuances of driving behaviors required to label driving instances to train classification algorithms. Thus, we detect and generate aggressive and non-aggressive driving behavior using weakly labeled data.
We then weakly label instances into aggressive and nonaggressive routines using the same per-person labels from [18], which were assigned based on drivers’ self-reported driving violations and their answers to the driver behavior questionnaire from [25]. We build two models, one for each label, and estimate the probabilities of all possible behavior instances in each model. To model how a vehicle moves in response to driver actions, we empirically estimated the state-action transitions (� � � ��� � ) from the training data by counting the frequency of transitions between features that describe the vehicle state. We identified 20,312 different states and 43 different actions in the dataset. The final model consisted of 234,967 different states and 47 different actions, with 5,371,338 possible transitions.
Naturalistic Driving Behavior Dataset and Model
We use the same dataset used in [3] and originally collected by Hong et al. [18]. Banovic et al. [3] showed that this data can be used to train meaningful driving routine models of how non-aggressive and aggressive drivers drive through intersections. The data was collected from 26 licensed drivers (13 male and 13 female; ages between 21 and 34) as they drove daily through a mid-sized city in North America [18]. The data collection lasted 3 weeks and resulted in a total of 542 hours of driving data from 1,017 trips. The data we use was collected using an On-board Diagnostic tool (OBD2), and was recorded every 500 milliseconds. We extend the original data set [18] and the way driving behaviors were modeled in [3]. We use the Open Street Map API to mark each intersection in the data with speed limits, intersection types (e.g., t-intersection), and traffic signs and signals. This allows us to detect more nuanced behaviors than those in [3]. For example, with our addition we can detect if a driver has properly stopped at a stop sign
Classifying Driving Behavior Instances
The model trained on behavior instances of all aggressive drivers in our training data allows us to compute the probability of situations (����������) and probability of actions given situations (� ������ ��� ). Similarly, the other
5
model, trained on all non-aggressive drivers, allows us to compute ������������� and �������� �������.
Driving Behaviors Animation System
We implemented our driving behavior animation system for Android touchscreen tablets. The client mobile application is powered by a server side routine modeling service. The client downloads driving behavior instances from the server and plays them to the user.
To classify a new behavior instance � as either aggressive or not, we use an indicator function which is � when � is a variation of the aggressive routine, and � otherwise: � � � � � ���������� � � � � � � � ������� ����
The client user interface (Figure 1) features an animation area (Figure 1.A), which depicts a vehicle in an intersection reminiscent of illustrations found in driving study books. Each intersection depicts a situation with an intersection type (four way intersection or t-intersection), intersecting road types (main roads or residential roads), and traffic signs (speed limits, stop signs, and traffic lights). Our data does not contain information about traffic light’s current light color and instead only shows that the intersection is controlled by traffic lights. The roads and the vehicle depict average road and sedan vehicle sizes in North America.
Similarly, we classify � as either non-aggressive or not using an indicator function which is � when the behavior instance � is in the non-aggressive routine, and � otherwise: � � � � � ������� � � � � � � � ���������� ����� Given the two classifiers and two different � (one for each classifier), we can classify behavior instances as strictly aggressive, strictly non-aggressive, or neither. Later in our validation section, we use different values for � to test the impact of this parameter on our classification. We estimate the prior probability of an aggressive driver � ��� � ��� because the number of behavior instances in the training set is balanced between people with the two driving routines.
Vehicle animation shows how an actual vehicle may have moved through an intersection. We implemented a simple 2D physics engine to compute the speed and acceleration of the vehicle as it drives through different intersection positions. The maneuver feature guides the trajectory of the vehicle. The action pedal feature modifies speed in between two consecutive positions in the intersection to illustrate how drivers’ actions affect the movement of the vehicle.
Generating Driving Behavior Instances
We start sampling driving behavior instances from our driving routine models by conditioning initial situations (a driver approaching an intersection) on features that describe the environment and driver goals (see Table 1). We sample the initial situation from the conditional probability distribution � � �� , where �� is a set of situation features values. Note that conditioning the probability of the initial situation on features that include the state of the vehicle (e.g., speed) also allows us to explore how a non-aggressive driver would recover from a particular aggressive situation.
The user can review trips from a particular driver (Figure 1.B1), and load all intersections from a trip or a subset of intersections where the driver drove either aggressively or non-aggressively. The user can then replay the current driver’s behavior instance (Figure 1.B2), or switch between previous and next behavior instances in the subset (Figure 1.B3 and B5). For any instances, the user can generate and animate how a non-aggressive driver would drive through the same intersection (Figure 1.B4).
Generating behavior instances for specific driving situations allows us to explore “what-if” scenarios for the two driver populations, even if our training data does not contain those exact scenarios. For example, suppose we detect that a driver aggressively approached a t-intersection with traffic lights. To learn how a non-aggressive driver would behave in that scenario, we sample behaviors from our nonaggressive model starting with an initial situation in the same intersection. We can then use the generated nonaggressive instance to show the driver how to improve.
Driving Animation Evaluation
Our tool represents simplified driving maneuvers through abstracted intersections. Thus, we need to ensure that the animations correctly depict the driving behaviors and that users can distinguish between different behavior instances. To evaluate our animation tool, we conducted a pilot study with 12 participants (6 male and 6 female). Participants had ages between 19 and 35 (median=21), and had between 0 and 13 years of driving experience (median=3). Participants were compensated $10 for their time and effort. We lost data from two participants due to technical issues.
VALIDATING DETECTED AND GENERATED BEHAVIOR
Validating our algorithms is hard because they are trained on weakly labeled data with no ground truth about which instances are aggressive and which are non-aggressive. We manually check if a subset of detected/generated instances are variations of the two models. To review the variations, we implemented a tool that animates replays of both drivers’ recorded and our generated behaviors (Figure 1). The ability to visualize the behaviors enabled us to verify that our algorithms perform correctly faster than with manual behavior log analysis. It also allowed driving instructors (experts) who were not familiar with data analysis techniques to verify our findings.
Participants arrived at our lab and signed a consent form before we briefed them about the study. They reviewed 25 randomly selected driving behaviors from our training set, and compared them with randomly generated behaviors from our model. For each actual and generated instance, we asked them to write a paragraph describing what the driver did in the intersection, and another paragraph about what the driver did differently between the two. The first five scenarios were warm ups to ensure the task was understood.
6
Table 3. The mean percentage of behavior instances classified as aggressive, non-aggressive, or neither across different � levels. � =0.1 Agg
� =0.25
Neither
Nonagg
� =0.45
Agg
Neither
Nonagg
� =0.5
Agg
Neither
Nonagg
Agg
Neither
Nonagg
aggressive
0%
99.99%
0.01%
2.02%
92.34%
5.64%
41.82%
26.25%
31.92%
56.23%
0%
43.77%
non-aggressive
0%
99.77%
0.23%
1.08%
91.91%
7.01%
38.45%
23.78%
37.76%
50.35%
0%
49.65%
were likely expecting other drivers to respect their signs. However, at high speeds they may not be able to react in time if a vehicle turns in front of them.
Two researchers independently coded participant responses. The researchers rated participant responses as: 1) incorrect, if the answer did not correspond to the driving behavior in the scenario; 2) partially correct, if the answer contained most, but not all relevant information about the scenario; and 3) correct; if the answer contained relevant information about the scenario and the driving behavior without any mistakes. Each researcher rated 600 descriptions and they perfectly agreed on 83.86% of them (Cohen’s kappa=0.54). For each rating, we computed the average score rounded down towards the lower of the two scores.
The majority of actions in the detected aggressive behavior instances involved drivers pressing hard on the gas and brakes. However, aggressive driving instances also included pressing the pedals softly. Further analysis of the situations in which drivers performed those actions showed that the drivers were already in situations that were indicative of aggressive driving. Although the drivers had made an attempt to correct their behavior, it was already too late.
Results
Drivers in automatically detected non-aggressive behaviors observed the traffic law (e.g., maintained the speed limit). The most likely non-aggressive instances included an easily identifiable pattern where the driver would brake softly when approaching an intersection and then applying gas softly to increase the speed to clear the intersection. Nonaggressive driving instances were equally likely to occur in and out of rush hour. This is in contrast with about 70% of aggressive driving instances that occurred during rush hour.
The results of our pilot study showed that the participants were able to accurately describe the scenarios. Participants correctly described 85% of driving behavior instances, partially correctly described 13%, and incorrectly described 2% of the instances. Participants also correctly compared 79% of instances, partially correctly compared 15.5%, and incorrectly compared 5.5% driving instances. To increase the users’ accuracy and to reduce the time and effort to compare behaviors, we modified our application interface to show a ghost vehicle (Figure 1) when the user (re)played generated behaviors.
Our algorithm also detected nuanced differences between the aggressive and non-aggressive instances. For example, it detected a common driving behavior instance where the driver goes through an intersection with traffic lights at a constant speed matching the speed limit of 35 MPH as aggressive with high probability (pAgg=0.6892). A generated non-aggressive behavior for the same scenario shows that non-aggressive drivers are likely to slow down slightly as they approach the intersection and then increase their speed after clearing the intersection (pNonAgg=0.7458). This shows that our algorithm can detect behaviors that may not be obvious, but that are characteristic of a particular routine.
Preliminary Detection Validation
We used our driving animation tool to manually inspect behavior instances that we detected using our algorithm. For each driver in the dataset, we withheld the data from that driver, and trained the models on the remaining drivers. We then used the driver data we withheld to classify all driving behavior instances from that driver using the two indicator functions (Equations 9 & 10). We sorted classified behavior instances by their frequency in the data and the probability that they belong to one of the routine models, and inspected the most frequent behavior instances.
Expert Evaluation of Driving Detection and Generation
Two licensed driving instructors volunteered to evaluate our algorithms and ensure that they accurately detect and generate meaningful driving behaviors. The two instructors (1 male and 1 female) arrived at our lab and signed a consent form. One of them had over 10 years of experience as a driving instructor, and the other had over 30 years experience as a driver safety instructor and driver license examiner. They were compensated with $35.
Results
Our results show that our algorithm on average found more aggressive driving instances among the aggressive drivers and more non-aggressive instances for the non-aggressive drivers across � levels. Table 3 shows mean percentages of classified behavior instances for different � levels. In a majority of detected aggressive instances, the drivers were driving over the speed limit. In the top 50 most aggressive instances, drivers were driving at over 45 miles per hour (MPH). In some situations drivers were exceeding the speed limit by 20 MPH. In most of these situations, the drivers were going straight through intersections with stops signs for traffic coming from the left or right. The drivers
The evaluation consisted of two tasks. The instructors first each rated 55 different randomly selected driving behavior instances from our training data set. Instructors rated each instance as: 1) aggressive, 2) non-aggressive, or 3) neither. The instructors then rated another 30 random automatically
7
The lack of such information made it difficult for the instructors to rate if a behavior was aggressive or nonaggressive, and they had to mark such instances as neither. Lacking this information, they had to make an assumption that the driver is responding to the environment in a reasonable way. For example, when the animation shows the vehicle going straight through an intersection with traffic lights, they assumed the light was green; when the animation showed the vehicle stop in the middle of the intersection before proceeding they had to assume that this was because another vehicle was blocking the driver’s way.
detected aggressive driving instances and 30 corresponding generated non-aggressive instances. They also rated if each generated instance was a good non-aggressive alternative to the aggressive behavior or not. In both tasks, the first 5 behavior instances were used as warm up and to explain the tasks to the instructors. We asked the instructors to think aloud in both tasks as they were rating the instances. We compared probabilities that behavior instances belong to the aggressive routine model (PAgg) between different ratings using the Kruskal-Wallis test. We did a pairwise comparison using Mann-Whitney’s U test with Bonferroni correction. We hypothesize that the aggressive probabilities will be highest for behavior instances that the instructors rated as aggressive, followed by those rated as neither and non-aggressive. We use our results to identify a reasonable � for our classifiers to be used in future driving systems.
Our validation also yielded some surprising findings. For example, we found that drivers labeled as non-aggressive may still frequently engage in aggressive behaviors. Thus, high-level classification techniques that target aggressive drivers (e.g., driving assessment questionnaires [25]) may miss important behaviors that could help other people improve their driving, too. This also means that sampling from the non-aggressive driving model may in some cases result in an aggressive behavior instance. To ensure that our system never suggests aggressive driving behavior to the user, we only present generated instances that we classify as characteristic of a non-aggressive driving routine.
Results
As expected, we found differences in PAgg between different instructor ratings (χ2(2)=6.73, p=.0346). The median PAgg=62.40% of instances rated as aggressive was higher than PAgg of behavior instances rated as non-aggressive (median=48.14%; p=.0360, r=.31). The difference between PAgg of instances rated aggressive and instances rated as neither (median=50.69%) was only marginally statistically significant (p=.0940, r=.34). Our tests did not find a statistically significant difference between PAgg of instances rated as non-aggressive and neither (p>.9999, r=.02).
We reviewed instances where the instructors disagreed with our automatic classification, and found that our classifiers are more sensitive to individual driver actions. For example, the instructors did not rate instances in which the driver drives straight through an intersection at the speed limit as aggressive. However, our preliminary evaluation showed that such behavior has a better non-aggressive alternative.
Over 75% of instances rated as aggressive had PAgg greater than 50.32%. Over 75% of instances rated as neither and non-aggressive had PAgg lower than 59.75% and 57.28% respectively. To detect as many aggressive instances, while limiting false positives, we set aggressive classifier ���� to 1-0.55=0.45. Because more than 75% of instances rated as neither had PAgg greater than 38.98%, we set a more cautious non-aggressive instance classifier ������� to 0.35.�
This shows that our detection algorithm is able to point to new information about what is characteristic of aggressive driving. This does not mean that all driving instances we detect as characteristic of aggressive routine are necessarily endangering the driver and others in traffic. It means that drivers that do exhibit such behaviors may be at higher risk of causing intentional traffic violations because they routinely engage in aggressive driving behaviors.
The instructors rated 72.5% of automatically detected aggressive instances as aggressive, 5% as non-aggressive, and 22.5% as neither in the second task. They rated 85% of the corresponding automatically generated non-aggressive instances as non-aggressive, 5% as aggressive, and 10% as neither. They confirmed that all generated instances that they rated as non-aggressive were appropriate alternatives for the automatically detected aggressive instances.
RAISING AWARENESS OF AGGRESSIVE DRIVING
We now illustrate how we leverage driving routine models to raise people’s awareness and help them understand their driving behaviors. We could generate behaviors from both aggressive and non-aggressive models to help drivers understand how these routines differ in frequent driving situations. However, our approach is uniquely positioned to detect actual drivers’ aggressive behaviors to help them reflect on differences between their behavior and generated non-aggressive driving behavior in the same situations.
Discussion
Our classifier detected aggressive driving instances that match known characteristics of aggressive driving behavior (e.g., speeding [27], hard acceleration and braking [18]). The two driving instructors also confirmed that in most cases our algorithms detected and generated non-aggressive driving behavior instances that are safe enough to suggest to drivers as alternatives to aggressive driving behaviors. However, in some cases, the instructors could not properly rate the instances due to the lack of information about the environment (e.g., other vehicles in traffic, pedestrians).
We conducted a user study in which participants drove on a predefined route and reviewed their driving behaviors using our tool. We hypothesize that showing participants their aggressive behaviors and non-aggressive alternatives will change their rating of their driving expertise and quality.
8
Method
Results
We recruited 20 participants (12 male, 8 female), ages between 19 and 72 (median=25). Participants had valid drivers licenses, and had between 1 and 55 years of driving experience (median=7). They arrived at our lab and signed a consent form. We briefed them on the study, and then installed an OBD2 sensor and a smartphone (to collect data from OBD2) into their vehicles. Participants then drove on a predefined route in a mid-sized city in North America. The route reflected different kinds of driving situations in 24 intersections. Participants drove five laps (total 120 intersections) to ensure that they had the time to fall into their driving routine. They drove alone to minimize the effect of a user study on their normal driving behaviors.
Most participants in the two conditions did not change their answers about overall driving expertise (both conditions median ΔE=0) and quality (both conditions median ΔQ=0). Our tests could not find a significant difference between the two conditions for ΔE (U=47, Z=0.26, p=.9288, r=.06) and ΔQ (U=46, Z=0.34, p=.8727, r=.08). Thus, participants may be unlikely to change their overall driving expertise and quality rating after reviewing only a few of their behaviors. However, they did change their perception of specific driving behaviors in our modified DBQ. Participants in the baseline condition reduced their frequency of intentional and accidental aggressive violations (median ΔDBQ=-1.0) compared to participants in the tool condition who slightly increased the frequency (median ΔDBQ=0, 75th percentile ΔDBQ=1; U=23, Z=2.1808, p=.0259, r=.49).
After returning to our lab, we uploaded their driving data into our modeling system. The upload procedure converted OBD2 data into behavior instances, and automatically detected aggressive driving instances using our model now trained on all aggressive drivers from our extended data set.
Also, as we hypothesized, participants in the tool condition changed their answers about their driving quality towards aggressive behaviors (median Δq=-1.0), while participants in the baseline condition changed towards non-aggressive (median Δq=1.0; U=82, Z=2.65, p=.0128, r=.59). Participants in the baseline condition changed their answers about their expertise towards the inexperienced end of the scale (median Δe=1.0), but the tool condition participants mostly did not (median Δe=0). Our test could not find a significant difference (U=49, Z=0.08, p=.9682, r=.02).
Participants then completed a pre-test questionnaire, in which they rated their driving expertise and quality on 6point Likert scales, where expertise ranged from very inexperienced to very experienced, and quality ranged from very aggressive to very non-aggressive. We also modified the standard driver behavior questionnaire (DBQ) [25] to include only 15 violation and accidental violation questions relevant to our study. Participants answered how frequently they engaged in driving behaviors in each of 15 questions, and how that makes them feel about their driving expertise and quality on the same 6-point Likert scales.
The only difference between the two conditions was the participants’ exposure to automatically detected aggressive and generated non-aggressive instances. The percentage of detected aggressive instances was similar across the two conditions. Thus, we conclude that exposure to the detected and generated behaviors raised participants’ awareness about their specific driving behaviors.
We then randomly split participants into two groups: 1) baseline, in which participants used our modified driving animation tool to review all of their driving instances, and 2) tool, in which participants reviewed their automatically detected aggressive driving instances, and compared them with corresponding automatically generated non-aggressive driving instances. We ensured that both conditions had the same proportion of males (n=6) and females (n=4). We explained to participants how to use the tool and told them that they can review the behaviors for as long as they want.
Lack of information about other vehicles and pedestrians affected participants’ ability to understand aggressive instances. For example, in response to slowing down for a vehicle in front, P11 (tool) said: “I did not agree that the scenarios flagged as aggressive were aggressive, especially the ones where I was moving significantly more slowly than the ‘non-aggressive’ scenario.” However, slowly tailing a vehicle in an intersection could result in the driver’s vehicle blocking the intersection if the lane in front fills up. The generated behavior may account for the gap that the nonaggressive drivers keep between vehicles in such situations.
After they finished using the tool, participants answered the same questionnaire again. We compared their pre- and posttest answers to understand the effects of our tool on their awareness and understanding of their aggressive driving behaviors. Afterwards, participants commented on the tool. The study lasted about two hours and participants got $35.
Participants also at times disagreed when our detected instance challenged their notions of aggressive driving. For example, P6 (tool) commented: “Most of the time the tool suggested I drive slower when I was already driving under the actual legal speed limit, which was weird.” However, our non-aggressive driving routine model favors softly pressing on the gas and lower acceleration, which resulted in a slower speed than the participant’s in those situations.
Measures
We measured the change between participants’ answers in pre- and post-tests. We computed the change in overall driving expertise (ΔE) and quality (ΔQ), median change in frequency of behaviors in our modified DBQ (ΔDBQ), and median change in expertise (Δe) and quality (Δq) over all DBQ questions. We compared the differences between the changes in the two groups using Mann-Whitney’s U test.
In other cases, generated non-aggressive instances helped participants understand why the system made its decisions. 9
drivers who generally drive non-aggressively will at times exhibit aggressive behaviors. The existing screening techniques (e.g., driving assessment questionnaires [25]) would miss an opportunity to help such drivers improve.
For example, P16 (tool) said: “I didn’t think that going through an intersection at the speed limit is aggressive, but then I saw the non-aggressive option that showed I should slow down a bit when approaching the intersection and then speed up after I passed it. And I thought: ‘Oh, that does make sense!’” Although participants may disagree that a particular instance of their behavior is aggressive, they learned of a better ways to drive through the intersection.
Our use case illustrates how automatically detecting and generating driving behaviors can help driving instructors evaluate other peoples’ driving behaviors and help drivers reflect on and understand their own driving behaviors. However, we have also identified a common theme during our validation that both kinds of users are quick to trust obvious behaviors that may match their preconceived notions about aggressive driving. On the other hand, they were slow to accept other more nuanced behaviors that may be characteristic of a particular routine. Although validating their preconceived notions confirms our algorithms are correct in most cases, we would ideally like to provide a tool that helps generate new knowledge.
Drivers are not fully aggressive or fully non-aggressive, but show aggressive and non-aggressive behaviors in different situations. Drivers using the tool had both an increase in their self-assessed aggressive driving quality and frequency. Our results show that our tool highlights drivers’ aggressive behaviors, and demonstrates less aggressive alternatives, to help drivers be more aware of their aggressive tendencies. DISCUSSION
Our works extends an existing routine modeling approach [3] to automatically detect and generate behaviors using probabilities that people with a certain routine will perform sequences of actions in a given situation. We calculate the probabilities in a principled way that ensures that the probabilities best fit training behavior instances from large behavior logs. Without our contribution, we would have to perform tedious manual exploration of the existing models to understand specific differences between variations of different routines.
The users need to be able to trust the tool before they can accept new knowledge that it suggests. To increase user trust, our tool should include complete information about the environment and show that it observes the environment in a correct way. Showing that the algorithm detects behaviors that matter could also increase trust. For example, the tool could animate what could go wrong when the driver engages in less obvious aggressive behaviors (e.g., show that drivers that slowly tail other vehicles can get stuck in intersections). Building trust in new knowledge that the tool generates is fundamental to behavior change, which is hard to do if we cannot persuade people that their behavior could negatively impact them.
Our work is based on a real life example where the lack of labeled behavior instances impedes technology that could help people improve their lives. The challenge of labeling individual behavior instances is not limited to driving and spans number of other domains. For example, our approach can simplify labeling daily routines of parents who are likely to forget to pickup their children [10]. Here, the weak, per-parent labels indicate if they have forgotten their children in the past or not. Our approach offers a generalizable solution to classify and generate behavior instances in different domains, because it is based on probability axioms and a proven model of routine behavior.
CONCLUSION AND FUTURE WORK
The ability to automatically classify and generate behavior instances is fundamental to future technologies that help people improve their behavior. However, the ability to label individual behavior instances in behavior logs diminishes as the ability to collect more behavior data improves. Our solution bypasses labeling individual instances by providing per-person weak labels to train algorithms that classify and generate individual behavior instances.
We showed the ability of our algorithms to automatically detect and generate driving behavior instances using weakly labeled data. Our approach can detect behavior instances that can negatively impact people and those that can have a positive impact on them. An important by-product of our approach is that it can also be used to detect behavior instances that are not characteristic of any particular routine (e.g., behavior instances that are frequently exhibited by both aggressive and non-aggressive drivers). We refer to such behavior instances as aproblematic, and hypothesize that behavior change technologies could use such instances as a stepping stone towards better behavior.
Our behavior detection and generation algorithms enable novel future interventions that help people improve their routines. We ground our algorithms in statistical principles, which allow us to generalize our approach to multiple domains. We have illustrated the potential of our algorithms on an application in the driving domain. However, future work should explicitly validate our approach on other domains as well (e.g., fitness, health, productivity). Our work enables artificial intelligence systems that can automatically model, detect, generate, and reason about peoples’ routines. Such systems can help people reflect on and understand their behaviors, which is a step towards technologies that aid people in behavior change. Our goal is to enable technology that benefits society by helping people improve their routines and be productive, healthy, and safe.
We found that people who have demonstrated a certain routine do not always behave in ways that are characteristic of that routine. We found that aggressive drivers often drive in a way that is not necessarily aggressive. Also, some
10
Ecol. Sociobiol., vol. 63, no. 7, 1057-1066. http://dx.doi.org/10.1007/s00265-009-0739-0
REFERENCES
1.
Pieter Abbeel and Andrew Y. Ng. 2004. Apprenticeship learning via inverse reinforcement learning. In Proceedings of the twenty-first international conference on Machine learning (ICML '04). ACM, New York, NY, USA, 1-. http://doi.acm.org/10.1145/1015330.1015430
2.
American Automobile Association. 2009. Aggressive driving: Research update. American Automobile Association Foundation for Traffic Safety.
3.
Nikola Banovic, Tofi Buzali, Fanny Chevalier, Jennifer Mankoff, and Anind K. Dey. 2016. Modeling and Understanding Human Routine Behavior. In Proceedings of the 2016 CHI Conference on Human Factors in Computing Systems (CHI '16). ACM, New York, NY, USA, 248-260. http://dx.doi.org/10.1145/2858036.2858557
4.
Richard Bellman. 1957. A Markovian decision process. Journal of Mathematics and Mechanics, 6, 679–684.
5.
Christopher M. Bishop. 2006. Pattern Recognition and Machine Learning (Information Science and Statistics). Springer-Verlag New York, Inc., Secaucus, NJ, USA.
6.
14. Martha S. Feldman and Brian T. Pentland. 2003. Reconceptualizing organizational routines as a source of flexibility and change. Administrative Science Quarterly, 48 (1), 94-118. http://dx.doi.org/10.2307/3556620 15. Pei-Yun Hsueh, Prem Melville, and Vikas Sindhwani. 2009. Data quality from crowdsourcing: a study of annotation selection criteria. In Proceedings of the NAACL HLT 2009 Workshop on Active Learning for Natural Language Processing (HLT '09). Association for Computational Linguistics, Stroudsburg, PA, USA, 27-35. 16. Edward McFowland, Skyler Speakman, and Daniel B. Neill. 2013. Fast generalized subset scan for anomalous pattern detection. Journal of Machine Learning Research 14, 1 (January 2013), 1533-1561.
Oliver Brdiczka, Norman Makoto Su, and James Bo Begole. 2010. Temporal task footprinting: identifying routine tasks by their temporal patterns. In Proceedings of the 15th international conference on Intelligent user interfaces (IUI '10). ACM, New York, NY, USA, 281284. http://doi.acm.org/10.1145/1719970.1720011
7.
Paolo Buono, Aleks Aris, Catherine Plaisant, Amir Khella, and Ben Shneiderman. 2005. Interactive pattern search in time series. In Electronic Imaging 2005, 175186. http://dx.doi.org/10.1117/12.587537
8.
Senaka Buthpitiya, Anind K. Dey, and Martin Griss. 2014. Soft authentication with low-cost signatures. In Proceedings of IEEE International Conference on Pervasive Computing and Communications (PerCom), 2014, IEEE, 172-180. http://dx.doi.org/10.1109/PerCom.2014.6813958
9.
13. Katayoun Farrahi and Daniel Gatica-Perez. 2012. Extracting Mobile Behavioral Patterns with the Distant N-Gram Topic Model. In Proceedings of the 2012 16th Annual International Symposium on Wearable Computers (ISWC) (ISWC '12). IEEE Computer Society, Washington, DC, USA, 1-8. http://dx.doi.org/10.1109/ISWC.2012.20
17. Geoffrey M. Hodgson. 1997. The ubiquity of habits and rules. Cambridge Journal of Economics, 21(6), 663-684. 18. Jin-Hyuk Hong, Ben Margines, and Anind K. Dey. 2014. A smartphone-based sensing platform to model aggressive driving behaviors. In Proceedings of the SIGCHI Conference on Human Factors in Computing Systems (CHI '14). ACM, New York, NY, USA, 40474056. http://doi.acm.org/10.1145/2556288.2557321 19. Yuri A. Ivanov, Bruce Blumberg, and Alex Pentland. 2001. Expectation maximization for weakly labeled data." In Proceedings of the Eighteenth International Conference on Machine Learning, 218-225. Morgan Kaufmann Publishers Inc.
Olivier Chapelle, Bernhard Schlkopf, and Alexander Zien. 2010. Semi-Supervised Learning (1st ed.). The MIT Press.
20. Edwin T. Jaynes. 1957. Information theory and statistical mechanics. Physical review, 106(4), 620. http://dx.doi.org/10.1103/PhysRev.106.620
10. Scott Davidoff, Brian D. Ziebart, John Zimmerman, and Anind K. Dey. 2011. Learning patterns of pick-ups and drop-offs to support busy family coordination. In Proceedings of the SIGCHI Conference on Human Factors in Computing Systems (CHI '11). ACM, New York, NY, USA, 1175-1184. http://doi.acm.org/10.1145/1978942.1979119
21. Magnus S. Magnusson. 2000. Discovering hidden time patterns in behavior: T-patterns and their detection. Behavior Research Methods, Instruments, & Computers, 32(1), 93-110. http://dx.doi.org/10.3758/BF03200792 22. Gideon S. Mann and Andrew McCallum. 2010. Generalized Expectation Criteria for Semi-Supervised Learning with Weakly Labeled Data. The Journal of Machine Learning Research 11 (March 2010), 955984.
11. Anind K. Dey. 2001. Understanding and Using Context. Personal Ubiquitous Comput. 5, 1 (January 2001), 4-7. http://dx.doi.org/10.1007/s007790170019 12. Nathan Eagle and Alex S. Pentland. 2009. Eigenbehaviors: identifying structure in routine. Behav.
11
27. David Shinar and Richard Compton. 2004. Aggressive driving: an observational study of driver, vehicle, and situational variables, Accident Analysis & Prevention, Volume 36, Issue 3, May 2004, 429-437. http://dx.doi.org/10.1016/S0001-4575(03)00037-X
23. Andrew Y. Ng and Stuart J. Russell. 2000. Algorithms for Inverse Reinforcement Learning. In Proceedings of the Seventeenth International Conference on Machine Learning (ICML '00), Pat Langley (Ed.). Morgan Kaufmann Publishers Inc., San Francisco, CA, USA, 663-670.
28. Xiaojin Zhu, Zoubin Ghahramani, and John Lafferty. 2003. Semi-supervised learning using Gaussian fields and harmonic functions. In Proceedings of the 20th International Conference on Machine Learning (ICML-2003) Volume 2, vol. 2, 912-919.
24. Martin L. Puterman. 2014. Markov decision processes: discrete stochastic dynamic programming. John Wiley & Sons, Inc., New York, NY, USA. 25. James Reason, Antony Manstead, Stephen Stradling, James Baxter, and Karen Campbell. 1990. Errors and violations on the roads: a real distinction? Ergonomics 33(10-11), 1315-1332. http://dx.doi.org/10.1080/00140139008925335
29. Brian D. Ziebart, J. Andrew Bagnell, and Anind K. Dey. 2010. Modeling interaction via the principle of maximum causal entropy. In Proceedings of the 27th international conference on Machine learning (ICML '10). ACM, New York, NY, USA., 1247-1254.
26. Ruslan Salakhutdinov (2015) Learning deep generative models. Annual Review of Statistics and Its Application 2. 361-385. http://dx.doi.org/10.1146/annurev-statistics-010814020120
30. Brian D. Ziebart. 2010. Modeling purposeful adaptive behavior with the principle of maximum causal entropy. (Doctoral dissertation, Carnegie Mellon University).
12