Sep 22, 2012 - Especially, in stellar explosions, there are thou- sands of reactions ... approach which is able to describe properties of all species of nucleus.
arXiv:1209.4969v1 [nucl-th] 22 Sep 2012
Linear-response calculation in the time-dependent density functional theory Takashi Nakatsukasa∗,† , Tsunenori Inakura∗, Paolo Avogadro∗∗,∗ , Shuichiro Ebata‡,∗ , Koichi Sato∗ and Kazuhiro Yabana†,∗ ∗
RIKEN Nishina Center, Wako-shi 351-0198, Japan Center for Computational Sciences, University of Tsukuba, Tsukuba 305-8571, Japan ∗∗ Departimento di Fisica, Università degli Studi di Milano, via Celoria 16, 20133 Milan, Italy ‡ Center for Nuclear Study, University of Tokyo, Bunkyo-ku, 113-0033, Japan †
Abstract. Linear response calculations based on the time-dependent density-functional theory are presented. Especially, we report results of the finite amplitude method which we have recently proposed as an alternative and feasible approach to the (quasiparticle-)random-phase approximation. Calculated properties of the giant resonances and low-energy E1 modes are discussed. We found a universal linear correlation between the low-energy E1 strength and the neutron skin thickness. Keywords: Random-phase approximation, Giant resonances, Equation of state PACS: 21.60.Jz, 24.30.Cz, 25.20.Dc
INTRODUCTION Nuclei are created in stars via nuclear reactions where the temperatures are extremely high. Understanding of astrophysical phenomena generally requires many subfields of physics. Among them, nuclear physics plays key roles in the generation of elements, the evolution of the stars, the energy production in the universe, etc. The lightest elements up to helium were produced in the Big Bang. The other heavier elements are generated by many kinds of nuclear reactions in stars. Especially, in stellar explosions, there are thousands of reactions supposed to take place producing a variety of radioactive isotopes. However, to date, their reaction rates have not been hardly determined experimentally. To overcome these experimental difficulties, reliable theoretical information is necessary. Traditional ab-initio methods start from a nucleon-nucleon potential which describes nucleon-nucleon scattering data. However, since the nuclear systems are strongly correlated because of a repulsive core in the potential, their description requires highly sophisticated many-body methods, such as the quantum monte carlo method [1]. To describe the nucleus in a quantitative way, they must employ an additional three-body force. These ab-initio methods are so involved that, even at present, their investigations have been limited to very light nuclei and to the homogeneous nuclear matter [2]. Under these circumstances, it is highly demanded to establish a universal theoretical approach which is able to describe properties of all species of nucleus. The nuclear density functional theory [3] is the most promising candidate among many nuclear models. It was referred to as the self-consistent mean-field model, but its concept is analogous to the density functional theory for many-electron systems [4, 5]. The functionals have typically about ten parameters which are adjusted by extensive fits to
nuclear structure data. The most prominent feature of the model is that a single energy functional enables us to quantitatively describe almost all nuclei in the nuclear chart and infinite nuclear/neutron matter as well. The nuclear density functional models have been extensively used since 1970s [6]. In the beginning, there were several restrictions related to symmetries of the wave functions, which limited applications of the model. In 1990s, significant computational advances together with vast amount of new spectroscopic data obtained with large gammaray arrays changed the situation. Using the cranking prescription, the density functional models were becoming a standard tool to study rotational bands in heavy nuclei [7]. In particular, the models were very successful in studies of superdeformed rotational bands at high spin in A = 150 [7, 8] and A = 190 regions [9]. It should be emphasized that the model parameters were never adjusted to these bands at all. In 2000s, systematic calculations of nuclear ground-state properties were performed, to predict properties of nuclei far from the stability line [10]. At the same time, experimental developments greatly increased our knowledge on radioactive isotopes, then, had an impact on the energy density functionals. The nuclear density functional methods has now reached a point where one need to introduce “correlations beyond the Kohn-Sham scheme” to further improve the quality of the description. The density functional theory is designed for the description of ground-state properties. Its extension to a time-dependent density functional theory is formally straightforward, which is also analogous to the time-dependent mean-field theory. The density matrix ρ (t) obeys the following equation,
∂ ρ (t) = [h(t), ρ (t)], (1) ∂t where h(t) is the Kohn-Sham (mean-field) Hamiltonian which is a functional of ρ (t). In the case of open-shell superfluid nuclei with pairing, the density ρ (t) and the Hamiltonian h(t) should be generalized to those with double size of matrices, R(t) and H(t), respectively [11]. Namely, R(t) contains not only the normal density ρ (t) but also the pairing tensor κ (t). Similarly, H(t) has the pair potential ∆(t) in addition to h(t). It is not yet fully understood how we can compute excitation properties using the timedependent density-functional theory, except for a few limiting cases. One such case is the low-energy regime of the nuclear dynamics, such as surface vibrations and shape fluctuations, which can be reached by the adiabatic limit of the time-dependent densityfunctional theory. It is closely related to the microscopic derivation of the Bohr model [12]. Recently, we have performed the numerical calculations of the large-amplitude quadrupole dynamics in various isotopes [13, 14, 15, 16]. Another important limiting case is the small-amplitude limit which provides us with a powerful tool to study linear response in nuclei. It is known as the random-phase approximation (RPA) or the quasiparticle-random-phase approximation (QRPA) in nuclear physics, which accesses the regime of giant resonances. However, since the calculation of the residual interaction is tedious for the realistic energy functionals, it has been common to ignore some terms in practice and to sacrifice the full self-consistency. To overcome these difficulties and facilitate an implementation of the full self-consistency, we employ two different methodologies; one is based on the real-time method (RTM) [17] and the other is the finite amplitude method (FAM) [18]. The RTM has an advantage i h¯
that it does not require the calculation of the complex residual interactions, although it has a limitation in the achieved energy resolution inversely proportional to the time duration T . Our recent applications of the RTM are based on the canonical-basis framework [19] which is able to take into account dynamical pairing effects in nuclei. This is presented in another contribution to this volume [20]. In contrast, the FAM, which is complementary to the RTM, is a method of calculating the matrix elements of the residual field, δ h = δ h/δ ρ · δ ρ , using the finite difference. This does not require excessive programming but can be done by employing the program of the static density-functional calculation. We have performed systematic and fully self-consistent RPA calculations of photoabsorption cross sections for wide mass region (A ≤ 100), for both spherical and deformed nuclei. In this report, we show results of these symmetry-unrestricted FAM calculations.
FINITE AMPLITUDE METHOD In this section, we recapitulate the FAM.
FAM for RPA First, we discuss the case without the pairing correlations. In this case, the FAM leads to residual fields appearing in the RPA. For more details, readers are referred to Ref. [18]. The linear-response RPA equation to a weak external field with a fixed frequency, Vext (ω ), can be expressed in terms of the forward and backward amplitudes, |Xi (ω )i and hYi (ω )|.
ω |Xi(ω )i = (h0 − εi ) |Xi (ω )i + Pˆ {Vext (ω ) + δ h(ω )} |φi i, ˆ −ω hYi (ω )| = hYi (ω )| (h0 − εi ) + hφi | {Vext (ω ) + δ h(ω )} P,
(2) (3)
where the subscript i indicates the occupied orbitals (i = 1, 2, · · · , A) and the operator Pˆ denotes the projector onto the particle space, Pˆ = 1 − ∑i |φi ihφi |. Usually, the induced residual field δ h(ω ) is expanded to the first order with respect to |Xi (ω )i and |Yi (ω )i. This leads to the well-known matrix form of the linear-response equation and calculation of these matrix elements is most time-consuming in practice. Instead, we utilize the fact that the linearization is numerically achieved for δ h(ω ) = h[ρ0 + δ ρ (ω )] −h0 within the linear approximation. In order to perform this numerical differentiation in the program, we use a small trick in the calculation of the single-particle Hamiltonian h[ρ ]. First, we should notice that the δ h(ω ) depends only on the forward "ket" amplitudes |Xi(ω )i and backward "bra" ones hYi (ω )|. In other words, it is independent of bras hXi(ω )| and kets |Yi (ω )i. This is related to the fact that the transition density δ ρ (ω ) depends only on |Xi (ω )i and hYi (ω )|.
δ ρ (ω ) = ∑ {|Xi (ω )ihφi | + |φi ihYi (ω )|} . i
(4)
Then, we can calculate the residual fields in a following manner [18]:
δ h(ω ) =
1 (h [ρη ] − h0 ) , η
(5)
where η is a small real parameter to realize the linear approximation. ρη are defined by
ρη ≡ ∑ {(|φi i + η |Xi (ω )i)(hφi | + η hYi (ω )|)} .
(6)
i
Once |Xi (ω )i and hYi (ω )| are given, the calculation of h[ρη ] is an easy task. This does not require complicated programming, but only needs a small modification in the calculation of h[ρ ]. Of course, eventually, we need to solve Eqs. (2) and (3) to determine the forward and backward amplitudes. We use an iterative algorithm to solve this problem. Namely, (0) (0) we start from initial amplitudes |Xi i and hYi |, then update them in every iteration, (n) (n) (n+1) (n+1) (|Xi i, hYi |) → (|Xi i, hYi |), until the convergence. In each step, we calculate δ h(ω ) using the FAM as Eq. (5).
FAM for QRPA The FAM in the previous section can be extended to superfluid nuclei, namely, to the QRPA with the Bogoliubov extension of the mean fields. For more details, readers are referred to Ref. [21]. A self-consistent solution of static Kohn-Sham-Bogoliubov problems determines the ground-state densities (ρ0 , κ0 ) and the ground-state Hamiltonians (h0 , ∆0 ). They are given in terms of the quasiparticle wave functions, (Uµ ,Vµ ). Then, following the same argument in the previous section, we can derive equations for the residual fields, δ h(ω ) and δ ∆(ω ) as follows [21]: 1 (h[ρη , κη ] − h0 ) , η 1 δ ∆(ω ) = (∆[ρη , κη ] − ∆0 ) , η
δ h(ω ) =
(7)
where the density and pairing tensor (ρη , κη ) are defined by
ρη = (V ∗ + ηU X )(V + ηU ∗Y )T ,
(8)
κη = (V ∗ + ηU X )(U + ηV ∗Y )T .
(9)
Here, the forward and backward amplitudes (Xµν ,Yµν ) have subscripts µν to specify two-quasiparticles. On the other hand, the subscripts of (Ukµ ,Vkν ) indicate a basis of the single-particle space (k) and the quasiparticle (µ ). Again, utilizing an iterative algorithm for solution of the QRPA equation, we can solve the QRPA linear-response equation without explicitly calculating the residual interactions.
Numerical results Development of FAM computer programs We have developed the computer codes of the FAM in several representations. The FAM-RPA is available in the three-dimensional (3D) grid representation [22, 23]. This provides a completely symmetry unrestricted RPA calculation. All the single-particle wave functions and RPA amplitudes are represented by these grid points: i=1,···,A; σ =up,down
{φi (~rk , σ ), Xi(ω ;~rk , σ ),Yi (ω ;~rk , σ )}k=1,··· ,Ngrid
.
(10)
Since the results are not sensitive to mesh spacing in a region outside of the interacting region, the adaptive grid representation is used to reduce the number of grid points Ngrid [17]. In the followings, we show results obtained with this code. The code for FAM-QRPA was also developed, but still with some symmetry restrictions at present. In Ref. [21], we developed a code in the radial coordinate representation based on the spherical static program HFBRAD [24], which assumes the spherical symmetry in the ground state. Lately, another FAM-QRPA code has been developed in the harmonic oscillator representation [25], which is based on the program HFBTHO with the axial symmetry [26]. In the present applications, we use complex energy, ω = E + iΓ/2, with Γ = 1 MeV, which introduces an artificial damping width. This smoothing is necessary in two reasons: To obtain smooth strength functions, and to speed up the convergence for the iterative procedure. However, the FAM formulae, Eqs. (5) and (7) themselves, are independent from the smoothing parameter Γ. In fact, we can use the FAM for explicit construction of the (Q)RPA matrix and calculate the discrete normal modes. This will be reported elsewhere [27].
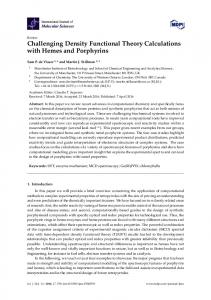
Giant dipole resonances We have carried out the systematic calculation of electric dipole response in the FAMRPA with the 3D grid representation. We show evolution of peak energies of the giant dipole resonances (GDR) as functions of mass number, neutron number, and proton number in Fig. 1. The GDR peak position is estimated by the average energy Epeak =
m1 (ωmax ) , m0 (ωmax )
mk (ωmax ) =
Z ωmax 0
dω ω k S(ω ; DE1 )
(11)
where S(ω ; DE1 ) = ∑n |hn|DE1|0i|2δ (ω − En ). The maximum energy is ωmax ≈ 40 MeV. The E1 operator is defined with the recoil charges for protons, Ne/A and for neutrons, −Ze/A. In deformed nuclei, since the peak energy depends on direction of the E1 operator (x, y, and z), their averaged value is adopted in Fig. 1. The upper panel shows the GDR peak energies from oxygen to nickel, as a function of mass number. In the medium-mass region, the peak energies approximately follow the empirical low, 21A−1/3 + 31A−1/6 MeV, denoted by the solid curve. However, in each isotopic chain,
Epeak [MeV]
25
20
15 10
20
30
40
50
60
70
80
90
Epeak [MeV]
Mass number 25
20
15 8
14
20
28
40
Neutron number
50
8
14
20
28
Proton number
FIGURE 1. Calculated GDR peak energies as functions of mass number (top), neutron number (bottom left), and proton number (bottom right). The isotopic chains are connected by lines for the top and bottom left panels, while the isotonic chains are shown in the bottom right.
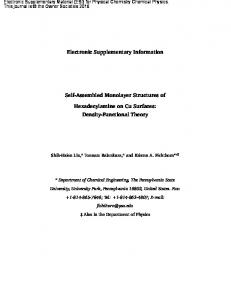
FIGURE 2. Calculated PDR strength fraction as a function of neutron number.
the peak energies in stable nuclei are the highest, while they are decreasing as leaving from the stability line. In addition, we can see some kind of shell effects. This can be more clearly seen in the lower panels of Fig. 1, in which the peak energies are plotted as functions of neutron and proton numbers. There are cusps at N =14 and 28 corresponding to the subshell closure of 1d5/2 and 1 f7/2 orbitals. This may be attributed to the emergence of low-energy pygmy peaks beyond these neutron numbers (see the discussion in the next section). The proton shell effects seem not to be as significant as those of neutrons (see the bottom right panel of Fig. 1).
σabs fraction [%]
8
S Ar Ca 4 Ti
Fe Ni Zn Ge
6
2 0 0
0.2
0.4
0.6 0
0.2
0.4
0.6
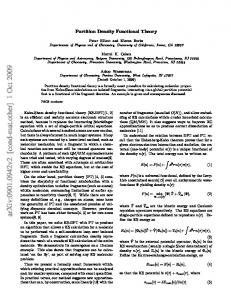
diff. of Rrms [fm] FIGURE 3. Calculated PDR strength fraction as a function of the neutron skin thickness.
Low-energy E1 strength Now, let us move to the low-energy part of the E1 strength distribution. In some nuclei, there appear small peaks in the E1 strength distribution, well separated from the main GDR peak, which are often called “pygmy dipole resonance” (PDR). In contrast to the main peak of GDR, the PDR strength distribution is sensitive to nuclear properties at nuclear surface and at low density. Thus, its property may provide us with useful constraints on the energy density functional, to identify the equation of state (EOS) of the nuclear and neutron matters. For instance, the neutron skin thickness is known to be well correlated with the slope of the neutron-matter EOS [28]. Thus, if the neutron skin thickness has a strong correlation with the low-energy E1 strength, we may pin down the EOS property by observing the PDR in experiments. First, we define the PDR strength fraction as fPDR ≡ m1 (ωc )/m1 (∞),
(12)
where m1 (ω ) is given in Eq. (11) and we adopt ωc = 10 MeV. In Fig. 2, we show the neutron-number dependence of fPDR . It indicates a strong shell effect. Namely, there are clear kinks at N = 14, 28, and 50. Let us concentrate our discussion on the kinks at N = 28. The PDR fractions suddenly increase at N = 28 → 30 and continue to increase till N = 34 where the neutron 2p shell are filled. Beyond N = 34, the PDR fractions are roughly constant for 34 < N ≤ 50, in which the neutrons are filling high-ℓ orbits of f5/2 and g9/2 . Beyond N = 50, the neutrons start filling 2d5/2 orbits, then the fPDR again shows a sudden increase. These behaviors strongly suggest that the spatially extended nature of the low-ℓ neutron orbits near the Fermi level plays a primary role for the emergence and growth of the PDR. We have also observed that the deformation tends to increase the PDR strength, especially in the region N > 56. More detailed analysis can be found in our recent paper [23]. Finally, let us examine the correlation between fPDR and the neutron skin thickness. The skin thickness is defined by the difference in radius between neutrons and protons. Plotting the PDR fraction as a function of the skin thickness, we observe a linear correlation between them, but only in specific regions of the neutron number. This is
illustrated in Fig. 3 for isotopes with Z = 16 − −22 and with Z = 26 − −32, which show the kinks at N = 28 and 50. The PDR fraction in each isotopic chain shows a linear correlation with the skin thickness in the regions of the neutron number N = 28 − 34 and N ≥ 50. The positions of the kinks are located at different values of the skin thickness for different isotopes. However, the slope is universal for all the isotopes; 0.18 ∼ 0.20 fm−1 . Despite the fact that the deformation and shell ordering are different and vary from nucleus to nucleus, the universal linear correlation remains valid for 50 ≤ N < 76. It should be noted that the linear correlation can be observed only for each isotopic chain. Deleting the lines connecting isotopic chains in Fig. 3, we only see scattered points showing a weak correlation. Again, for detailed analysis on this issue, readers are referred to Ref. [23].
ACKNOWLEDGMENTS The work is supported by KAKENHI (Nos. 21340073 and 20105003) and by SPIRE, MEXT, Japan. The numerical calculations were performed on PACS-CS and T2K supercomputers in University of Tsukuba, on Hitachi SR11000 at KEK, and on the RIKEN Integrated Cluster of Clusters (RICC).
REFERENCES 1. 2. 3. 4. 5. 6. 7. 8. 9. 10. 11. 12. 13. 14. 15. 16. 17. 18. 19. 20. 21. 22. 23. 24. 25. 26. 27. 28.
S. C. Pieper, and R. B. Wiringa, Ann. Rev. Nucl. Part. Sci. 51, 53 (2001). H. Heiselberg, and V. Pandharipande, Ann. Rev. Nucl. Part. Sci. 50, 481 (2000). M. Bender, P. H. Heenen, and P.-G. Reinhard, Rev. Mod. Phys. 75, 121 (2003). R. G. Paar and W. Yang, Density-functional theory of atoms and molecules, Oxford University Press, Oxford, 1989. R. M. Dreizler and E. K. U. Gross, Density functional theory, Springer, Berlin, 1990. D. Vautherin and D. M. Brink, Phys. Rev. C 5, 626 (1972). S. Aberg, H. Flocard, and W. Nazarewicz, Ann. Rev. Nucl. Part. Sci. 40, 439 (1990). T. Nakatsukasa, K. Matsuyanagi, S. Mizutori, and W. Nazarewicz, Phys. Lett. B 343, 19 (1995). T. Nakatsukasa, K. Matsuyanagi, S. Mizutori, and Y. R. Shimizu, Phys. Rev. C 53, 2213 (1996). D. Lunney, J. M. Pearson, and C. Thibault, Rev. Mod. Phys. 75, 1021 (2003). J.-P. Blaizot, and G. Ripka, Quantum Theory of Finite Systems, MIT Press, Cambridge, 1986. P. Ring, and P. Schuck, The nuclear many-body problems, Springer-Verlag, New York, 1980. N. Hinohara, et al., Phys. Rev. C 82, 064313 (2010). N. Hinohara, et al., Phys. Rev. C 84, 061302 (2011). K. Yoshida, and N. Hinohara, Phys. Rev. C 83, 061302 (2011). K. Sato, and N. Hinohara, Nucl. Phy. A 849, 53 (2011). T. Nakatsukasa, and K. Yabana, Phys. Rev. C 71, 024301 (2005). T. Nakatsukasa, T. Inakura, and K. Yabana, Phys. Rev. C 76, 024318 (2007). S. Ebata, et al., Phys. Rev. C 82, 034306 (2010). S. Ebata, T. Nakatsukasa, and T. Inakura, Contriubtion in this volume; arXiv:1201.3462. P. Avogadro, and T. Nakatsukasa, Phys. Rev. C 84, 014314 (2011). T. Inakura, T. Nakatsukasa, and K. Yabana, Phys. Rev. C 80, 044301 (2009). T. Inakura, T. Nakatsukasa, and K. Yabana, Phys. Rev. C 84, 021302 (2011). J. Dobaczewski, H. Flocard, and J. Treiner, Nucl. Phys. A 422, 103 (1984). M. Stoitsov, et al., Phys. Rev. C 84, 041305 (2011). M. Stoitsov, et al., Phys. Rev. C 68, 054312 (2003). P. Avogadro, and T. Nakatsukasa (2012), in preparation. B. A. Brown, Phys. Rev. Lett. 85, 5296 (2000).