Link-Based Characterization and Detection of Web Spam
∗
Debora Donato1 Carlos Castillo1 Luca Becchetti1
[email protected] [email protected] [email protected] 1 Stefano Leonardi Ricardo Baeza-Yates2
[email protected] [email protected] 1
DIS - Universita` di Roma “La Sapienza” Rome, Italy
ABSTRACT We perform a statistical analysis of a large collection of Web pages, focusing on spam detection. We study several metrics such as degree correlations, number of neighbors, rank propagation through links, TrustRank and others to build several automatic web spam classifiers. This paper presents a study of the performance of each of these classifiers alone, as well as their combined performance. Using this approach we are able to detect 80.4% of the Web spam in our sample, with only 1.1% of false positives.
1.
INTRODUCTION
The term “spam” has been commonly used in the Internet era to refer to unsolicited (and possibly commercial) bulk messages. The most common form of electronic spam is e-mail spam, but in practice each new communication medium has created a new opportunity for sending unsolicited messages. There are many types of electronic spam nowadays including spam by instant messaging (spim), spam by internet telephony (spit), spam by mobile phone, by fax, etc. The Web is not absent from this list. The request-response paradigm of the HTTP protocol makes it impossible for spammers to actually “send” pages directly to the users, so the type of spam that is done on the Web takes a somewhat different form than in other media. What spammers do on the Web is to try to deceive search engines, a technique known as spamdexing.
1.1 Web spam The Web contains numerous profit-seeking ventures that are attracted by the prospect of reaching millions of users at a very low cost. A large fraction of the visits to a Web site originate from search engines, and most of the users click on the first few results in a search engine. Therefore, there is an economic incentive for manipulating search engine’s listings by creating pages that score high independently of their real merit. In practice such manipulation is widespread, and in many cases, successful. For instance, the authors of [9] ∗ Supported by the EU Integrated Project AEOLUS (FET15964).
Copyright is held by the author/owner(s). AIRWEB’06, August 10, 2006, Seattle, Washington, USA.
Yahoo! Research Barcelona, Spain & Santiago, Chile 2
report that “among the top 20 URLs in our 100 million page PageRank calculation (. . . ) 11 were pornographic, and these high positions appear to have all been achieved using the same form of link manipulation”. One suitable way to define Web spam is any attempt to get “an unjustifiably favorable relevance or importance score for some web page, considering the page’s true value” [17]. There is a large gray area between “ethical” Search Engine Optimization (SEO) and “unethical” spam. SEO services range from ensuring that Web pages are indexable by Web crawlers, to the creation of thousands or millions of fake pages aimed at deceiving search engine ranking algorithms. Our main criteria to decide in borderline cases is the perceived effort spent by Web authors on providing good content, versus the effort spent on trying to score high in search engines. In all cases, the relationship between a Web site administrator trying to rank high on a search engine and the search engine administrator is an adversarial relationship in a zero-sum game. Every undeserved gain in ranking by the web site is a loss of precision for the search engine. Fortunately, from the point of view of the search engine, “victory does not require perfection, just a rate of detection that alters the economic balance for a would-be spammer” [21]. There are other forms of Web spam that involve search engines. We point out that we do not consider advertising spam, which is also an issue for search engines that involves clicks and ads.
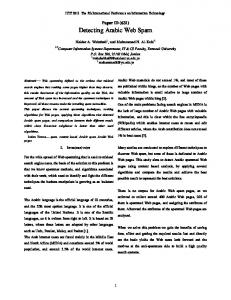
1.2 Topological spam (link spam) A spam page or host is a page or host that is used for spamming or receives a substantial amount of its score from other spam pages. There are many techniques for Web spam [17], and they can be broadly classified into content (or keyword) spam and link spam. Content spam includes changes in the content of the pages, for instance by inserting a large number of keywords [6, 8]. In [21], it is shown that 82-86% of spam pages of this type can be detected by an automatic classifier. The features used for the classification include, among others: the number of words in the text of the page, the number of hyperlinks, the number of words in the title of the pages, the compressibility (redundancy) of the content, etc. Unfortunately, it is not always possible to detect spam by content analysis, as some spam pages only differ from nor-
Figure 1: Schematic depiction of the neighborhood of a page participating in a link farm (left) and a normal page (right).
mal pages because of their links, not because of their contents. Many of these pages are used to create link farms. A link farm is a densely connected set of pages, created explicitly with the purpose of deceiving a link-based ranking algorithm. Zhang et. al [26] call this collusion, and define it as the “manipulation of the link structure by a group of users with the intent of improving the rating of one or more users in the group”. A page that participates in a link farm, such as the one depicted in Figure 1, may have a high in-degree, but little relationship with the rest of the graph. Heuristically, we call spamming achieved by using link farms topological spamming. In particular, a topological spammer achieves its goal by means of a link farm that has topological and spectral properties that statistically differ from those exhibited by non spam pages. This definition embraces the cases considered in [13], and their method based on “shingles” can be also applied in detecting some types of link farms (those that are dense graphs). Link-based and content-based analysis offer two orthogonal approaches. We think that these approaches are not alternative and should probably be used together. On one hand, in fact, link-based analysis does not capture all possible cases of spamming, since some spam pages appear to have spectral and topological properties that are statistically close to those exhibited by non spam pages. In this case, content-based analysis can prove extremely useful. On the other hand, content-based analysis seems less resilient to changes in spammers strategies, in much the same way that content-based techniques for detecting email spamming are. For instance, a spammer could copy an entire Web site (creating a set of pages that may be able to pass all tests for content spam detection) and change a few out-links in every page to point to the target page. This may be a relatively inexpensive task to perform in an automatic way, whereas creating, maintaining, reorganizing a link farm, possibly spanning more than one domain, is economically more expensive.
1.3 Our contribution In [3] we used Truncated PageRank (studied in section 3.4) and probabilistic estimation of the number of neighbors (studied in section 3.5) to build an automatic classifier for link spam using several link-based features. In this paper, we are more focused on investigating which (combinations of) features are good for spam detection, and we try to build classifiers that can achieve high precision by using a small set of features.
Table 1: Summary of the performance of the different metrics, the ranges in the error rate correspond to a simple classifier with a few rules, and to a more complex (but more precise) classifier. Detection False Section Metrics rate positives 3.1 Degree (D) 73-74% 2-3% 3.2 D + PageRank (P) 74-77% 2-3% 3.3 D + P + TrustRank 77% 2-3% 3.4 D + P + Trunc. PageRank 77-78% 2% 3.5 D + P + Est. Supporters 78-79% 1-2% 3.6 All attributes 80-81% 1-3% We are also including several metrics that we have not considered before for this type of classifier: we test in our collection TrustRank [18], and we propose the use of degreedegree correlations, edge-reciprocity and host-based counts of neighbors. The performance of the different classifiers we build in this paper is summarized in Table 1. The results obtained using all the selected attributes are comparable to those achieved by state-of the art content analysis for Web spam detection [21]. Again, we recall that content-based analysis is orthogonal to the approach we consider, and it is likely that the combination of these techniques might prove effective. The next section introduces the algorithmic framework and the data set we used. Section 3 presents the different metrics. The last section presents our conclusions.
2. FRAMEWORK This section describes the type of algorithms we are interested in, and the data set we are using to evaluate the effectiveness of the different metrics for spam detection.
2.1 Web graph algorithms We view our set of Web pages as a Web graph, that is, a graph G = (V, E) in which the set V corresponds to Web pages belonging to a subset of the Web, and every link (x, y) ∈ E corresponds to a hyperlink from page x to page y in the collection. For concreteness, the total number of nodes N = |V | is in the order of 1010 [15], and the typical number of links per Web page is between 20 and 30. Given the large/huge size of typical data sets used in Web Information Retrieval, complexity issues play a crucial role. These impose severe restrictions on the computational and/or space complexity of viable algorithmic solutions. A first approach to modeling these restrictions may be the streaming model of computation [19]. However, the restrictions of the classical stream model are too severe and hardly compatible with the problems we are interested in. In view of the above remarks, we decided to restrict to algorithmic solutions whose space and time complexity is compatible with the semi-streaming model of computation [10, 7]. This implies a semi-external memory constraint [24] and thus reflects many significant constraints arising in practice. In this model, the graph is stored on disk as an adjacency list and no random access is possible, i.e., we only allow sequential access. In particular, we assume that we have O(N log N ) bits of main (random access) memory, i.e., in general there is
enough memory to store some limited amount of data about each vertex, but not to store the links of the graph in main memory. We impose a further constraint, i.e., the algorithm should perform a small number of passes over the stream data, at most O(log N ). We assume no previous knowledge about the graph, so we do not know a priori if a particular node is suspicious of being a spam or not. For this reason, there are some semi-streamed algorithms on a Web graph that we cannot use for Web spam detection in our framework. If we have to compute a metric which assigns a value to every vertex, e.g. a score, we cannot of course afford to run this algorithm again for every node in the graph, due to the large size of the data set. As an example, suppose we want to measure the centrality of nodes. If we use the streamed version of the standard breadth-first search (BFS) algorithm, we are not complying with this requirement, since the outcome would be a BFS tree for a specific node, which is not enough for computing the centrality of all the nodes in the graph. Conversely, an algorithm such as PageRank computes a score for all nodes in the graph at the same time. The general sketch of the type of semi-streamed graph algorithms we are interested, is shown in Figure 2. Require: graph G = (V, E), score vector S 1: INITIALIZE(S) 2: while not CONVERGED do 3: for src : 1 . . . |V | do 4: for all links from src to dest do 5: COMPUTE(S, src, dest) 6: end for 7: end for 8: POST PROCESS(S) 9: end while 10: return S Figure 2: Generic link-analysis algorithm using a stream model. The score vector S represents any metric, and it must use O(N log N ) bits. The number of iterations should be O(log N ) in the worst case.
2.2 Data set We use a set of pages from the .uk domain, downloaded in 2002 by the Dipartimento di Scienze dell’Informazione, Universit` a degli studi di Milano. These collections are publicly available at http://law.dsi.unimi.it/. The collection has 18.5 million pages located on 98,452 different hosts. Due to the large size of this collection, we decided to classify entire hosts instead of individual pages. This increases the coverage of the sample, but introduces errors as there are some hosts that consist of a mixture of spam pages and legitimate contents. We manually classified a sample of 5,750 hosts (5.9% of the hosts). For every host, we inspected a few pages manually and looked at the list of pages collected by the crawler. Whenever we found a link farm inside the host, we classified the entire host as spam. As the amount of spam compared to normal hosts is relatively small, and since we want to focus on the most “damaging” types of spam, we biased our sampling towards hosts with high PageRank. This is the same approach taken by
other researchers in Web spam detection [4, 18]. In order to do this, our sample includes the top 200 hosts with the higher PageRank in their home page, with the higher overall PageRank and with the larger number of pages. Other hosts were added by classifying all the top 200 pages by hostname length, as several spammers tend to create long names such as “www.buy-a-used-car-today.example”. For the same reason, we searched for typical spamming terms in the host names, and we classified all the hosts with domain names including keywords such as mp3, mortgage, sex, casino, buy, free, cheap, etc. We discarded from the sample the hosts that no longer were available (about 7%), and classified the rest in one of the following three classes: Spam (16%): The host is clearly a link farm; or it is spamming by using several keywords in the host, directory or file names; or it includes no content apart from links to a target page or host. Normal (81%): The host is clearly not a link farm, but a normal site (in the jargon of e-mail spam detection, nonspam items are sometimes called “ham”). Suspicious (3%): Borderline cases, including illegal business (on-line gambling, pharmaceuticals without prescription) and pornography, as they are usual customers of link farms. We also included in this category sites that almost (but not entirely) provide content copied from other sources plus advertising, affiliate networks, advertising servers, and groups of entire sites that share the same template with little added information. Table 2 shows the number of hosts and pages in each class. Note that as the sample is biased toward spam pages, it cannot be used to infer the overall prevalence of Web spam in this collection. Also, given that we biased our sampling towards hosts with a large number of pages, our sample has only 5.9% of the hosts but covers about 5.8 million pages or 30% of the pages in the collection.
Table 2: Relative sizes of the classes in the manuallyclassified sample. The last row gives the fraction of classified hosts and pages over the entire collection. Class Hosts Pages Spam 840 16% 329 K 6% Normal 4,333 81% 5,429 K 92% Suspicious 171 3% 118 K 2% Total 5,344 (5.8%) 5,877 K (31.7%) For the class labels provided to the algorithms in the automatic classification experiments, we adopted a conservative approach and included the suspicious hosts in the normal class. One final remark about the data set is in order. The Web is a moving target and no spam research paper can have a spam classification whose Web content and structure (links) date to the same time as when the training set classification was done. This can negatively affect the results returned by any classifier for two main reasons: - A site may not be spam today but it may have been spam in the past. In this case there is the risk of wrong detection of this site as spam and hence the number of false positives will increase.
- A site may be spam today but may not have been in the past. In this case we may not detect the site as spam and hence the number of false negatives will increase. So, regardless of the technique used, our results may underestimate the false positives and negatives (so in both cases these are lower bounds). This implies that the detection rate we are giving is an upper bound.
2.3 Automatic classification This paper describes several link-based features that are used to build automatic classifiers. We used the Weka [25] implementation of decision trees: binary trees in which each internal node is an inequality (for instance: “if feature A is less than 10, and feature B is greater than 0.2, then the host is spam”). Describing here the algorithm for building automatically these classifiers is not possible due to space limitations, for a description see [25]. The evaluation of the classifiers was performed by a tenfold cross-validation of the training data. The data is first divided into 10 approximately equal partitions, then each part is held out in turn for testing, and the classifier is trained using the remaining 9 folds. The overall error estimate is the average of the 10 error estimates on the test folds. We also used boosting [12], which builds 10 different classifiers, assigning a different weight to each element after each classification, depending on whether the element was correctly classified or not. The resulting classifier is a linear combination of the individual weighted classifiers. For each set of features we build two classifiers. We first limit the number of rules, by imposing a lower bound on the number of hosts in each leaf of the decision tree (this is the parameter M in the implementation of Weka). In our case, M = 30 hosts, roughly 5% of them. We then build another classifier by using no pruning and generating as many rules as possible as long as there are at least M = 2 hosts per leaf. Evaluation: the error metrics for the evaluation are based on precision and recall [2] for the spam detection task. The main measures we use are: # of spam sites classified as spam Detection rate = # of spam sites False positives =
# of normal sites classified as spam . # of normal sites
The full list of features we used is provided in the appendix. Note that neither the length of the host names, nor their keywords, nor the number of pages were included as features for the automatic classifiers.
3.
METRICS
Fetterly et al. [11] hypothesized that studying the distribution of statistics about pages could be a good way of detecting spam pages, as “in a number of these distributions, outlier values are associated with web spam”. In this section we consider several link-based metrics, whose computation uses algorithms that are feasible for large-scale Web collections. These are not all possible statistics that can be computed, for a survey of Web metrics, see [5]. From pages to hosts. All the metrics in this section are metrics about individual Web pages. To apply them to
sites we measured them for the home page of the site (this is the page in the root directory, or the page with the shortest file name on each host). We computed these metrics for the page with the maximum PageRank. In our sample, these pages are the same in only 38% of the cases, so it is rather common that the highest ranked page on a site is not the home page. Actually, in 31% of the normal hosts these pages are the same, while for the spam hosts in 77% of the cases the pages are the same. In a normal Web site, the pattern of the linking to the pages in the host are not controlled by its owner, so even if the home page is more “visible”, any page has a certain chance of becoming popular. In the case of a spam host, we are assuming that the spammer controls a large fraction of the in-links, so he has an incentive to try to boost its home page instead of an arbitrary page inside the host.
3.1 Degree-based measures The distribution of in-degree and out-degree can be obtained very easily doing a single pass over the Web graph. In Figure 3 we depict the histogram of this metric over the normal pages and the spam pages. In this section we present several graphs such as Figure 3, in which the histogram is shown with bars for the normal pages and with lines for the spam pages. Both histograms are normalized independently, and the y-axis represents frequencies. In−degree
δ = 0.35
Out−degree
δ = 0.28
0.3 Normal Spam
0.4
0.3
Normal Spam
0.2
0.2 0.1 0.1
0 1
100 Number of in−links
10000
0 1
10 50 Number of out−links
100
Figure 3: Histogram of the degree of home pages. We have also included a parameter δ representing how different the histograms are. The value δ ∈ [0, 1] is based on the Kolmogorov-Smirnov test to verify if two distributions are the same, and is the maximum difference of the cumulative distribution functions (not shown here due to lack of space). The larger the value, the more different the distributions are. In the case of in-degree we are using logarithmic binning, and the distribution seems to follow a power-law for normal pages, as the number of elements in each bin are similar. In the case of spam hosts, there is a large group of about 40% of them that have an in-degree in a very narrow interval. Something similar happens in the diagram of out-degree, but the difference between normal and spam pages is not as significant. Another degree-based metric is the edge-reciprocity, that measures how many of the links in the directed Web graph are reciprocal. The edge-reciprocity can be computed easily by simultaneously scanning the graph and its transposed version, and measuring the overlap between the outneighbors of a page and its in-neighbors. In Figure 4 (left) we can see that the pages with maximum PageRank of the spam hosts, tend to have abnormally low
Reciprocity of max. PR page
δ = 0.35
0.5 0.4 0.3
Degree / Degree of neighbors
Normal Spam
δ = 0.31
PageRank of Home Page
0.4 Normal Spam
0.2
Stdev. of PR of Neighbors (Home) δ = 0.41
δ = 0.18 Normal Spam
0.3
Normal Spam
0.3
0.3
0.1 0.2
0.2
0.1
0.1
0.2
0.1
0.01 0
0.2
0.4 0.6 0.8 Fraction of reciprocal links
0 1 0.001
0.01 0.1 1 10 100 Degree/Degree ratio of home page
1000
Figure 4: Left: histogram of the edge reciprocity in the page with maximum PageRank. Right: histogram of degree/degree ratio for home pages. reciprocity in our sample. In the case of home pages (not shown) the difference is not very large. The degree of the nodes induces a natural “hierarchy” that can be used to define different classes of nodes. A network in which most nodes are connected to other nodes in the same class (for instance, most of the connections of highly-linked are to other highly-linked nodes) is called “assortative” and a network in which the contrary occurs is called “disassortative”. The distinction is important from the point of view of epidemics [16]. We measured for every host in our sample the ratio between its degree and the average degree of its neighbors (considering both in- and out-links). In Figure 4 (right) we can see that in our collection, there is a mixing of assortative and disassortative behavior. The home pages of the spam hosts tend to be linked to/by pages with relatively lower indegree. In our case, there is a peak at 10, meaning that for that group, their degree is 10 times larger than the degree of their direct neighbors. All of the measures in this section can be computed in one or two passes over the Web graph (and the transposed graph). Using only these attributes (17 features in total) we build two spam classifiers, as explained in section 2. Using them we can identify from 72.6% to 74.4% of the spam hosts with a false positive rate from 2.0% to 3.1%.
3.2 PageRank Let AN ×N be the citation matrix of graph G, that is, axy = 1 ⇐⇒ (x, y) ∈ E. Let PN ×N be the row-normalized citation matrix, such that all rows sum up to one, and rows of zeros are replaced by rows of 1/N . PageRank [22] can be described as a functional ranking [1], that is, a link-based ranking algorithm that computes a scoring vector S of the form: ∞ X damping(t) t S= P . N t=0
where damping(t) is a decreasing function of t, the lengths of the paths. In particular, for PageRank the damping function is exponentially decreasing, namely, damping(t) = (1−α)αt . We plot the distribution of the PageRank values of the home pages in Figure 5 (left). We can see a large fraction of pages sharing the same PageRank. This is more or less expected as there is also a large fraction of pages sharing the same in-degree (although these are not equivalent metrics). An interesting observation we obtained is that in the case of home pages the distribution seems to follow a power-law (in the graph of Figure 5 the bins are logarithmic), while
0 1e−08
1e−07
1e−06 PageRank
1e−05
0.0001
0 0
0.2
0.4 0.6 0.8 2 σ of the logarithm of PageRank
1
Figure 5: Left: histogram of the PageRank in the home page of hosts. Right: dispersion of PageRank values in the in-neighbors of the home pages.
for the pages with maximum PageRank on each host, the distribution seems to be log-normal. This deserves further studying in the future. Following an idea by Bencz´ ur et al. [4], we studied the PageRank distribution of the pages that contribute to the PageRank of a given page. In [4], this distribution is studied over a sample of the pages that point recursively to the target page (with a strong preference for shorter paths), while here we study the distribution of the PageRank of the direct in-neighborhood of a page only. The result is shown in Figure 5 (right), and it is clear that for most of the spammers in our sample, it is more frequent to have less dispersion in the values of the PageRank of the in-neighbors. Automatic classifiers built with the attributes we have described in this section (28 features in total), can identify from 74.4% to 77.3% of the spam hosts with a false positive rate of 1.7% to 2.6%.
3.3 TrustRank In [18] the TrustRank algorithm for trust propagation is described: it starts with a seed of hand-picked trusted nodes and then propagates their score by following links. The intuition behind TrustRank is that a page with high PageRank, but without relationship with any of the trusted pages, is suspicious. The spam mass of a page is defined as the amount of PageRank received by that page from spammers. This quantity cannot be calculated in practice, but it can be estimated by measuring the estimated non-spam mass, which is the amount of score that a page receives from trusted pages. For the purpose of this paper we refer to this quantity simply as the TrustRank score of a page. For calculating this score, a biased random walk is carried out on the Web graph. With probability α we follow an out-link from a page, and with probability 1 − α we go back to one of the trusted nodes picked at random. For the trusted nodes we used data from the Open Directory Project (available at http://rdf.dmoz.org/), selecting all the listed hosts inside the .uk domain. As of April 2006, this includes over 150,000 different hosts, from which 32,866 were included in our collection. Out of these, we have tagged 2,626 of them as normal hosts and 21 as spam. We removed those spam sites from the seed set (we also made some tests keeping them and the difference was not noticeable). As shown in Figure 6, the score obtained by the home page of hosts in the normal class and hosts in the spam class is very different. Also, the ratio between the TrustRank score
TrustRank score of home page
δ = 0.59 Normal Spam
0.4
0.3
Estimated relative non−spam mass 0.8 0.7 0.6 0.5 0.4 0.3 0.2
δ = 0.59 Normal Spam
TruncatedPageRank T=4 / PageRank δ = 0.33 Normal Spam
0.3
Maximum change of Truncated PageRank δ = 0.29 Normal Spam 0.2
0.1 0.2
0.2 0.1
0.1
0.01
0.1
0
0
1e−06 TrustRank
0.001
0.3
1
10 TrustRank score/PageRank
100
Figure 6: Left: histogram of TrustRank scores of home pages. Right: histogram of the estimated relative non-spam mass. and the PageRank (the estimated relative non-spam mass) is also very effective for separating spam from normal pages. Using degree correlations, PageRank and TrustRank as attributes (35 features in total), we built classifiers with detection rates from 77.0% to 77.3% and 1.8% to 3.0% of false positives.
3.4 Truncated PageRank In [3] we described Truncated PageRank, a link-based ranking function that decreases the importance of neighbors that are topologically “close” to the target node. In [26] it is shown that spam pages should be very sensitive to changes in the damping factor of the PageRank calculation; in our case with Truncated PageRank we modify not only the damping factor but the whole damping function. Intuitively, a way of demoting spam pages is to consider a damping function that removes the direct contribution of the first levels of links, such as:
damping(t) =
(
0 Cαt
t≤T t>T
Where C is a normalization constant and α is the damping factor used for PageRank. This function penalizes pages that obtain a large share of their PageRank from the first few levels of links; we call the corresponding functional ranking the Truncated PageRank of a page. The calculation of Truncated PageRank is described in detail in [3]. There is a very fast method for calculating Truncated PageRank. Given a PageRank computation, we can store “snapshots” of the PageRank values at different iterations and then take the difference and normalize those values at the end of the PageRank computation. Essentially, this means that the Truncated PageRank can be calculated for free during the PageRank iterations. Note that as the number of indirect neighbors also depends on the number of direct neighbors, reducing the contribution of the first level of links by this method does not mean that we are calculating something completely different from PageRank. In fact, for most pages, both measures are strongly correlated, as shown in [3]. In practice, we observe that for the spam hosts in our collection, the Truncated PageRank is smaller than the PageRank, as shown in Figure 7 (left). There is a sharp peak for the spam pages in low values, meaning that many spam pages loose a large part of their PageRank when Truncated
0.2
0.4 0.6 0.8 1 1.2 1.4 TruncatedPageRank(T=4) / PageRank
1.6
0 0.85
0.9
0.95 1 1.05 max(TrPR /TrPr ) i+1
1.1
i
Figure 7: Left: histogram of the ratio between TruncatedPageRank at distance 4 and PageRank in the home page. Right: maximum ratio change of the TruncatedPageRank from distance i to distance i−1.
PageRank is used. We also found that studying the ratio of Truncated PageRank at distance i versus Truncated PageRank at distance i−1 also helps in identifying Web spam, as shown in Figure 7 (right). A classifier using Truncated PageRank, as well as PageRank and degree-based attributes (60 features in total) can identify 76.9% to 78.0% of the spam hosts with 1.6% to 2.5% of false positives.
3.5 Estimation of supporters Following [4], we call x a supporter of page y at distance d, if the shortest path from x to y formed by links in E has length d. The set of supporters of a page are all the other pages that contribute to its link-based ranking. A natural way of fighting link spam is to count the supporters. The naive approach is to repeat a reverse breadthfirst search from each node of the graph, up to a certain depth, and mark nodes as they are visited [20]. Unfortunately, this is infeasible unless a subset of “suspicious” node is known a priori. A method for estimating the number of supporters of each node in the graph is described in [3] which improves [23]. The general algorithm (described in detail in [3]) involves the propagation of a bit mask. We start by assigning a random vector of bits to each page. We then perform an iterative computation: on each iteration of the algorithm, if page y has a link to page x, then the bit vector of page x is updated as x ← x OR y. After d iterations, the bit vector associated to any page x provides information about the number of supporters of x at distance ≤ d. Intuitively, if a page has a larger number of supporters than another, more 1s will appear in the final configuration of its bit vector. The algorithm is described in detail in [3]. In order to have a good estimation, d passes have to be repeated O(log N ) times with different initial values, because the range of the possible values for the number of supporters is very large. We have observed that counting supporters from distances d from 1 to 4 give good results in practice. We measured how the number of supporters change at different distances, by measuring, for instance, the ratio between the number of supporters at distance 4 and the number of supporters at distance 3. The histogram for the minimum and maximum change is shown in Figure 8 (left). This algorithm can be extended very easily to consider the number of different hosts contributing to the ranking of a given host. To do so, in the initialization the bit masks of all the pages in the same host have to be made equal. In Figure 8 (right), we plot the number of supporters at dis-
Minimum change of supporters
δ = 0.39
Hosts at Distance Exactly 4
δ = 0.39
0.4 Normal Spam
Normal Spam
0.4
0.3 0.3
0.2 0.2
0.1
0.1
0
1
5 min(S2/S1, S3/S2, S4/S3)
10
0 1
100 S4 − S3
1000
Figure 8: Left: histogram of the minimum change in the size of the neighborhood in the first few levels. Right: number of different hosts at distance 4 tance 4 considering different hosts contributing towards the ranking of the home pages of the marked hosts. We observed anomalies in this distribution for the case of the spam pages, and these anomalies are more evident by counting different hosts than by counting different pages. Considering distance 4, the estimation of supporters based on pages (62 attributes) yields a classifier with 78.9% to 77.9% of detection rate and 1.4% to 2.5% of false positives. If we base the estimation on hosts (67 attributes, slightly more because in-degree is not the number of neighbors at distance one in this case) allows us to build a classifier for detecting 76.5% to 77.4% of the spam with an error rate from 1.3% to 2.4%. The detection rate is two to three percentage points lower if distance 2 is considered, with roughly the same false positives ratio.
3.6 Everything By combining all of the attributes we have discussed so far (163 attributes in total), we obtained a better performance than each of the individual classifiers. The detection rate of the final classifier is between 80.4% and 81.4%, with a false positive rate of 1.1% to 2.8% respectively. The first classifier has 40 rules (which provides a robust classifier), while the second classifier has 175. The performance of our best classifier can be compared with content-based analysis [21], which with an equivalent, unrestricted, boosted classifier, achieves 86.2% of detection rate with 2.2% false positives using content features. The ten most important attributes in the complete set were obtained by using the attribute selection mechanism of Weka, that samples instances and consider the value of each attribute in the nearest same-class and different-class instance: 1. Binary variable indicating if home page is the page with maximum PageRank of the site 2. Edge reciprocity 3. Supporters (different hosts) at distance 4 4. Supporters (different hosts) at distance 3 5. Minimum change of supporters (different hosts) 6. Supporters (different hosts) at distance 2 7. Truncated PageRank at distance 1 divided by PageRank 8. TrustRank score divided by PageRank 9. Supporters (different hosts) at distance 1 10. Truncated PageRank at distance 2 divided by PageRank
4. CONCLUSIONS AND FUTURE WORK A first criticism of this study can be that the sample is not uniform, but is biased towards large Web sites and highly ranked Web pages. However, a uniform random sample in this case is much harder to obtain, as it requires to inspect a larger set of pages, which we can not do by ourselves at this moment. We are currently collaborating with other researchers in tagging a large uniform sample from a collection of Web pages. Our host-based approach also has some drawbacks. For instance, hosts can have mixed spam/legitimate content. In any case, we have seen that for several metrics it is important to measure the variables in both the home page of the host and the page with the maximum PageRank. For some metrics only one of the two pages provides useful information for the spam detection technique, and it is not always the same page. Another approach could be to evaluate each metric also by taking its average over each Web host. Finally, a better definition of Web site instead of host would be useful; for instance, considering multi-site hosts such as geocities.com as separated entities. Some authors have hinted that the arms race between search engines and spammers calls for a serious reconsideration of Web search. For instance, Gori and Witten argue that “one might try to address speculative Web visibility scams individually (as search engine companies are no doubt doing); however, the bubble is likely to reappear in other guises” [14]. It would be interesting to try to devise clear rules separating what is allowed and what is not allowed from the point of view of a search engine, instead of continuing playing “hide and seek” with the spammers. In an analogy with sport competitions, this set of rules would define a kind of “anti-doping rules” for Web sites. Our work contributes towards this goal by suggesting that it is possible to detect a large fraction of the spammers by analyzing linkbased metrics. Following the analogy, this could be used as part of an “anti-doping test” for Web pages, which should involve at least both link-based and content-based analysis. The source code of the implementation of the algorithms presented in this paper will be freely available under a GPL license at http://www.dis.uniroma1.it/∼ae/ for the final version of the paper, along with our data set of hosts and their class labels, for repeatability of these results and further testing of other web spam detection techniques.
5. REFERENCES [1] R. Baeza-Yates, P. Boldi, and C. Castillo. Generalizing PageRank: Damping functions for link-based ranking algorithms. In Proceedings of SIGIR, Seattle, Washington, USA, August 2006. ACM Press. [2] R. Baeza-Yates and B. Ribeiro-Neto. Modern Information Retrieval. Addison Wesley, May 1999. [3] L. Becchetti, C. Castillo, D. Donato, S. Leonardi, and R. Baeza-Yates. Using rank propagation and probabilistic counting for link-based spam detection. Technical report, DELIS – Dynamically Evolving, Large-Scale Information Systems, 2006. [4] A. A. Bencz´ ur, K. Csalog´ any, T. Sarl´ os, and M. Uher. Spamrank: fully automatic link spam detection. In Proceedings of the First International Workshop on Adversarial Information Retrieval on the Web, Chiba, Japan, May 2005. [5] L. Costa, F. A. Rodrigues, and G. a. Travieso. Characterization of complex networks: A survey of measurements, Jun 2005. [6] B. D. Davison. Recognizing nepotistic links on the web. In Aaai-2000 Workshop On Artificial Intelligence For Web Search, pages 23–28, Austin, Texas, July 2000. Aaai Press.
[7] C. Demetrescu, I. Finocchi, and A. Ribichini. Trading off space for passes in graph streaming problems. In Proceedings of the 7th annual ACM-SIAM Symposium on Discrete Algorithms, 2006. [8] I. Drost and T. Scheffer. Thwarting the nigritude ultramarine: learning to identify link spam. In Proceedings of the 16th European Conference on Machine Learning (ECML), volume 3720 of Lecture Notes in Artificial Intelligence, pages 233–243, Porto, Portugal, 2005. [9] N. Eiron, K. S. Curley, and J. A. Tomlin. Ranking the web frontier. In Proceedings of the 13th international conference on World Wide Web, pages 309–318, New York, NY, USA, 2004. ACM Press. [10] J. Feigenbaum, S. Kannan, M. A. Gregor, S. Suri, and J. Zhang. On graph problems in a semi-streaming model. In 31st International Colloquium on Automata, Languages and Programming, 2004. [11] D. Fetterly, M. Manasse, and M. Najork. Spam, damn spam, and statistics: Using statistical analysis to locate spam web pages. In Proceedings of the seventh workshop on the Web and databases (WebDB), pages 1–6, Paris, France, June 2004. [12] Y. Freund and R. E. Schapire. Experiments with a new boosting algorithm. In International Conference on Machine Learning, pages 148–156, 1996. [13] D. Gibson, R. Kumar, and A. Tomkins. Discovering large dense subgraphs in massive graphs. In VLDB ’05: Proceedings of the 31st international conference on Very large data bases, pages 721–732. VLDB Endowment, 2005. [14] M. Gori and I. Witten. The bubble of web visibility. Commun. ACM, 48(3):115–117, March 2005. [15] A. Gulli and A. Signorini. The indexable Web is more than 11.5 billion pages. In Poster proceedings of the 14th international conference on World Wide Web, pages 902–903, Chiba, Japan, 2005. ACM Press. [16] S. Gupta, R. M. Anderson, and R. M. May. Networks of sexual contacts: implications for the pattern of spread of hiv. AIDS, 3(12):807–817, December 1989. [17] Z. Gy¨ ongyi and H. Garcia-Molina. Web spam taxonomy. In First International Workshop on Adversarial Information Retrieval on the Web, 2005. [18] Z. Gy¨ ongyi, H. Garcia-Molina, and J. Pedersen. Combating web spam with trustrank. In Proceedings of the Thirtieth International Conference on Very Large Data Bases (VLDB), pages 576–587, Toronto, Canada, August 2004. Morgan Kaufmann. [19] M. R. Henzinger, P. Raghavan, and S. Rajagopalan. Computing on data streams. Dimacs Series In Discrete Mathematics And Theoretical Computer Science, pages 107–118, 1999. [20] R. J. Lipton and J. F. Naughton. Estimating the size of generalized transitive closures. In VLDB ’89: Proceedings of the 15th international conference on Very large data bases, pages 165–171, San Francisco, CA, USA, 1989. Morgan Kaufmann Publishers Inc. [21] A. Ntoulas, M. Najork, M. Manasse, and D. Fetterly. Detecting spam web pages through content analysis. In Proceedings of the World Wide Web conference, pages 83–92, Edinburgh, Scotland, May 2006. [22] L. Page, S. Brin, R. Motwani, and T. Winograd. The PageRank citation ranking: bringing order to the Web. Technical report, Stanford Digital Library Technologies Project, 1998. [23] C. R. Palmer, P. B. Gibbons, and C. Faloutsos. ANF: a fast and scalable tool for data mining in massive graphs. In Proceedings of the eighth ACM SIGKDD international conference on Knowledge discovery and data mining, pages 81–90, New York, NY, USA, 2002. ACM Press. [24] J. S. Vitter. External memory algorithms and data structures. ACM Computing Surveys, 33(2):209–271, 2001. [25] I. H. Witten and E. Frank. Data Mining: Practical Machine Learning Tools and Techniques with Java Implementations. Morgan Kaufmann, October 1999. [26] H. Zhang, A. Goel, R. Govindan, K. Mason, and B. Van Roy. Making eigenvector-based reputation systems robust to collusion. In Proceedings of the third Workshop on Web Graphs (WAW), volume 3243 of Lecture Notes in Computer Science, pages 92–104, Rome, Italy, October 2004. Springer.
Appendix: Full List of Attributes Included here for repeatability of the results:
Degree-based, 17 features (section 3.1) All of the following attributes for the home page and the page with the maximum PageRank, plus a binary variable indicating if they are the same page: - In-degree, out-degree, fraction of reciprocal edges - Degree divided by degree of direct neighbors - Average and sum of in-degree of out-neighbors - Average and sum of out-degree of in-neighbors
PageRank, 28 features (section 3.2) All of the above, plus the following for the home page and the page with maximum PageRank: - PageRank, In-degree/PageRank, Out-degree/PageRank - Standard deviation of PageRank of in-neighbors = σ 2 - σ 2 /PageRank Plus the PageRank of the home page divided by the PageRank of the page with the maximum PageRank.
TrustRank, 35 features (section 3.3) PageRank attributes of section 3.2, plus the following for the home page and the page with maximum PageRank: - TrustRank (estimated absolute non-spam mass) - TrustRank/PageRank, TrustRank/In-degree Plus the TrustRank in the home page divided by the TrustRank in the page with the maximum PageRank.
Truncated PageRank, 60 features (section 3.4) PageRank attributes of section 3.2, plus the following for the home page and the page with maximum PageRank: - TruncatedPageRank(T = 1 . . . 4) - TruncatedPageRank(T = i) / TruncatedPageRank(T = i − 1) - TruncatedPageRank(T = 1 . . . 4) / PageRank - Min., max. and avg. of TruncatedPageRank(T = i) / TruncatedPageRank(T = i − 1) Plus the TruncatedPageRank(T = 1 . . . 4) of the home page divided by the same value in the page with the maximum PageRank.
Estimation of supporters (section 3.5) PageRank attributes of section 3.2, plus the following for the home page and the page with maximum PageRank: - Supporters at 2 . . . 4 (supporters at 1 is equal to in-degree) - Supporters at 2 . . . 4 / PageRank - Supporters at i / Supporters at i − 1 (for i = 1..4) - Min., max. and avg. of: Supporters at i / Supporters at i − 1 (for i = 1..4) - (Supporters at i - Supporters at i − 1) / PageRank (for i = 1..4). The quantity (Supporters at i - Supporters at i − 1) is the number of supporters at distance exactly i. Plus the number of supporters at distance 2 . . . 4 in the home page divided by the same feature in the page with the maximum PageRank. For the estimation of supporters using hosts, the same attributes but considering that two supporters in the same host count as only one supporter.