In many social media tools, link prediction is used to detect the existence of ... One weakness with network-based link prediction techniques is that the links.
Link Prediction in Heterogeneous Collaboration Networks Xi Wang and Gita Sukthankar Department of EECS University of Central Florida {xiwang,gitars}@eecs.ucf.edu
Abstract. Traditional link prediction techniques primarily focus on the effect of potential linkages on the local network neighborhood or the paths between nodes. In this article, we study both supervised and unsupervised link prediction in networks where instances can simultaneously belong to multiple communities, engendering different types of collaborations. Links in these networks arise from heterogeneous causes, limiting the performance of predictors that treat all links homogeneously. To solve this problem, we introduce a new supervised link prediction framework, Link Prediction using Social Features (LPSF ), which incorporates a reweighting scheme for the network based on nodes’ features extracted from patterns of prominent interactions across the network. Experiments on coauthorship networks demonstrate that the choice for measuring link weights can be critical for the link prediction task. Our proposed reweighting method in LPSF better expresses the intrinsic relationship between nodes and improves prediction accuracy for supervised link prediction techniques. We also compare the unsupervised performance of the individual features used within LPSF with two new diffusion-based methods: LPDP (Link Prediction using Diffusion Process) and LPDM (Link Prediction using Diffusion Maps). Experiments demonstrate that LPDP is able to identify similar node pairs, even far away ones, that are connected by weak ties in the coauthorship network using the diffusion process; however, reweighting the network has little impact on prediction performance. Keywords: link prediction · social features · random walk · collaboration networks
1
Introduction
In many social media tools, link prediction is used to detect the existence of unacknowledged linkages in order to relieve the users of the onerous chore of populating their personal networks. The problem can be broadly formulated as follows: given a disjoint node pair (x, y), predict if the node pair has a relationship, or in the case of dynamic interactions, will form one in the near future [1]. Often, the value of the participant’s experience is proportional to the size of their
personal network so bootstrapping the creation of social networks with link prediction can lead to increased user adoption. Conversely, poor link prediction can irritate users and detract from their initial formative experiences. Although in some cases link predictors leverage external information from the user’s profile or other documents, the most popular link predictors focus on modeling the network using features intrinsic to the network itself, and measure the likelihood of connection by checking the proximity in the network [2, 3]. Generally, the similarity between node pairs can be directly measured by neighborhood methods such as the number of shared neighbors [4] or subtly measured by path methods [5]. One weakness with network-based link prediction techniques is that the links are often treated as having a homogeneous semantic meaning, when in reality the underlying relationship represented by a given link could have been engendered by different causal factors. In some cases, these causal factors are easily deduced using user-supplied meta-information such as tags or circles, but in other cases the provenance of the link is not readily apparent. In particular, the meaning of links created from overlapping communities are difficult to interpret, necessitating the development of heterogeneous link prediction techniques. In the familiar example of scientific collaboration networks, authors usually have multiple research interests and seek to collaborate with different sets of co-authors for specific research areas. For instance, Author A cooperates with author B on publishing papers in machine learning conferences whereas his/her interaction with author C is mainly due to shared work in parallel computation. The heterogeneity in connection causality makes the problem of predicting whether a link exists between authors B and C more complicated. Additionally, Author A might collaborate with author D on data mining; since data mining is an academic discipline closely related to machine learning, there is overlap between the two research communities which indicates that the linkage between B and D is more likely than a connection between B and C. In this article, we detect and leverage the structure of overlapping communities toward this problem of link prediction in networks with multiple distinct types of relationships. Community detection utilizes the notion of “structural equivalence” which refers to the property that two actors are similar to one another if they participate in equivalent relationships [6]. Inspired by the connection between structural equivalence and community detection, Soundarajan and Hopcroft proposed a link prediction model for non-overlapping communities; they showed that including community information can improve the accuracy of similarity-based link prediction methods [7]. Since community information is not always readily available, community detection techniques can be applied to partition the network into separate groups [8]. In this article, we present a new link prediction framework for networks with overlapping communities that accounts for the hidden community information embedded in a set of heterogeneous connections. When a person’s true affiliations are unknown, our proposed method, LPSF [9], models link heterogeneity by adding weights to the links to express the similarities between node pairs based on their social features. These social features
are calculated from the network topology using edge clustering [10] and implicitly encode the diversity of the nodes’ involvements in potential affiliations. The weights calculated from the social features provide valuable information about the true closeness of connected people, and can also be leveraged to predict the existence of the unobserved connections. In this article, different similarity-based prediction metrics were adapted for use on a weighted network, and the corresponding prediction scores are used as attributes for training a set of supervised link prediction classifiers. Experiments on a real-world scientific collaboration dataset (DBLP) demonstrate that LPSF is able to outperform homogeneous predictors in the unweighted network. In Section 5, we further compare the performances of unsupervised link prediction benchmarks used in LPSF with two proposed diffusion-based link predictors (LPDP and LPDM ). Recently, the use of random walk models for solving link prediction problems in coauthorship networks has attracted interest due to the finding that researchers are more interested in establishing long-range weak ties (collaborations) rather than strengthening their well-founded interactions [11]. By capturing the underlying proximities of long distant node pairs, LPDP demonstrates its superior link prediction performance on DBLP datasets.
2
Related Work
The link prediction problem has drawn increased attention over the past few years [12–14]. A variety of techniques for addressing this problem have been explored including graph theory, metric learning, statistical relational learning, matrix factorization, and probabilistic graphical models [1, 15–17]. This chapter is an extended version of our prior work on supervised link prediction models [9]. Most link prediction models assume that the links in the network are homogeneous. In this work, we focus on predicting links in link-heterogeneous networks such as coauthorship collaboration networks, which can be modeled as networks that contain different types of collaboration links connecting authors. From a machine learning point of view, link prediction models can be categorized as being supervised or unsupervised. Hasan et al. studied the use of supervised learning for link prediction in coauthorship networks [18]. They identify a set of link features that are key to the performance of their supervised learner including (1) proximity features, such as keywords in research papers, (2) aggregated features, obtained from an aggregation operator, and (3) topological features. The combination of these features showed effective prediction performance on two collaborative network datasets. Popescul et al. introduced an alternate approach to generating features. First, they represent the data in a relational format, generate candidate features through database queries, select features using statistical model selection criteria, and finally perform logistic regression using the selected features for classification [19]. Unlike these methods, in this work, our proposed LPSF only utilizes network information and does not use document properties; we believe that our proposed social features could
be used in conjunction with node features, when they are available, to improve classification performance. Unsupervised prediction methods, due to their simplicity, have remained popular in the link prediction literature but have been shown to be very sensitive to underlying network properties, such as imbalance in the size of network communities, and experience difficulty adapting to dynamic interdependencies in the network [17]. Davis et al. proposed an unsupervised extension of the common Adamic/Adar method to predict heterogeneous relationships in multi-relational networks [20]. Specifically, the proposed multi-relational link prediction (MRLP) method applies a weighting scheme for different edge type combinations. The weights are determined by counting the occurrence of each unique 3-node sub-structure in the network, traditionally termed a triad census. Supervised link prediction is employed after converting the heterogeneous network into a feature representation. Sun et al. proposed a path-based relationship prediction model, PathPredict, to study the coauthorship prediction problem in heterogeneous bibliographic networks [13]. First, the meta path-based topological features are symmetrically extracted from the network using measures such as path count and random walk, around the given meta paths. The meta path captures the composition relation over the heterogeneous networks. Logistic regression is then used to learn the weights associated with different topological features that best predict co-author relationships. Lee and Adorna proposed a random walk-based link prediction algorithm on a modified heterogeneous bibliographic network where all edges across heterogeneous objects in the network are weighted by using a combination of different importance measures [21]. Different to their work, our main focus in this article is weighting the heterogeneous collaboration links between authors. Relatively few works focus on link prediction tasks in weighted networks. De S´ a and Prudˆencio investigated the use of weights to improve the performance of supervised link prediction [22]. In their work, they extend eight benchmark unsupervised metrics for weighted networks, and adopt prediction scores as node pairs’ attributes for a supervised classification model. Murata et al. proposed a similar unsupervised metric that makes use of the weights of the existing links [23]; this outperforms traditional unsupervised methods especially when the target social networks are sufficiently dense. Experiments conducted on two real-world datasets (Yahoo! Answers and Windows Live QnA dataset) indicate that the accuracy of link prediction can be improved by taking weights of links into consideration. In those datasets, the weights of the links in the network are already available, in contrast to our work where we calculated the link weights based on node pairs’ social features extracted from an unweighted network. Recently, some researchers started applying random walk models to solve the link prediction problem. For instance, Backstrom and Leskovec developed a supervised random walk algorithm that combines the information from the network structure with node and edge level attributes and evaluated their method
on coauthorship networks extracted from arXiv. The edge weights are learned by a model that optimizes the objective function such that more strength is assigned to new links that a random walker is more likely to visit in the future [11]. However, they only focus on predicting links to the nodes that are 2-hops from the seed node. Liu et al. proposed a similarity metric for link prediction based on type of local random walk, the Superposed Random Walk (SRW) index [24]. By taking into account the fact that in most real networks nodes tend to connect to nearby nodes rather than ones that are far away, SRW continuously releases the walkers at the starting point, resulting in a higher similarity between the target node and the nearby nodes. Apparently this assumption is invalid in DBLP and other scientific collaboration datasets. Similarly Yin et al. estimated link relevance using the random walk algorithm on an augmented social graph with both attribute and structure information [25]. Their framework leverages both global and local influences of the attributes. Different to their model, our diffusion-based techniques LPDP and LPDM only rely on the network structural information without considering any node’s local (intrinsic) features. Additionally, the experiments described in [24] and [25] evaluated the problem of recognizing existent links in the network rather than predicting future ones.
3
Link Prediction in Collaboration Networks
In this article, we aim to predict future collaborations between researchers by observing the network at an earlier point of time t as the training sample and predicting the links to be added to the network during the time interval from time t to a given future time t0 . The network we consider consists of the following information: (1) a set of N individuals: V = {V1 , ..., VN }. Each person in the network can belong to K (K ≥ 1) different affiliations (communities). When K = 1, individuals are partitioned into non-overlapping groups. (2) The connections between actors are represented by the undirected, network graph G = {V, E}, in which edge e = (vi , vj ) denotes that vi shares certain relationships with vj . We also assume that the network is unweighted, which means w(vi , vj ) = 1 for all connected node pairs (vi , vj ). Given a new pair of nodes in the network, {vm , vn }, our task is to predict whether there exists a relationship between them. 3.1
Problems of Heterogeneity
Unsupervised link prediction methods mainly fall into two categories: neighborhood methods, such as Common Neighbors (CN) and Jaccard’s Coefficient (JC), which make predictions based on structural scores that are calculated from the connections in the node’s immediate neighbors, and path methods, such as PageRank, which predict the links based on the paths between nodes [5]. Essentially, the prediction score represents the similarity between the given pair of nodes: the higher the score, the more likely that there exists a connection between them. Using the Common Neighbors (CN) scoring method, two nodes
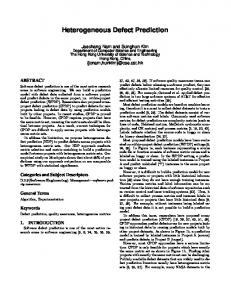
with 10 common neighbors are more likely to be linked than nodes with only a single common neighbor. However, these neighborhood approaches intrinsically assume that the connections in the network are homogeneous: each node’s connections are the outcome of one relationship. Directly applying homogeneous link predictors to overlapping communities can cause prediction errors. A simple example is shown in Figure 1, where two types of relationships co-exist within the same network. The solid line represents the coauthorship of a paper in a data mining conference and the dashed line represents the activity of collaborating on a machine learning paper. Note that the link types are hidden from the method — only the presence of a link is known. Author 1 is associated with 2 affiliations since he/she participates in both activities. If all interactions were considered homogeneously, the prediction score for linking authors 2 and 6, CN (2, 6), and that for authors 2 and 3, CN (2, 3), under the Common Neighbors scoring method would be the same, since both node pairs share only one common neighbor; yet this is clearly wrong. The question now becomes how can we capture type correlations between edges to avoid being misled by connection heterogeneity? In the next section, we describe how edges in the network can be analyzed using edge clustering [10] to construct a social feature space that makes this possible. 3.2
Edge-based Feature Extraction
The idea of constructing edge-based social dimensions was initially used to address the multi-label classification problem in networked data with multiple types of links [10]. Connections in human networks are often the result of affiliationdriven social processes; since each person usually has more than one connection, the involvements of potential groups related to one person’s edges can be utilized as a representation for his/her true affiliations. Because this edge class information is not always readily available in the social media application, an unsupervised clustering algorithm can be applied to partition the edges into disjoint sets such that each set represents one potential affiliation. The edges of actors who are involved in multiple affiliations are likely to be separated into different sets. In this article, we construct the node’s social feature space using the scalable edge clustering method proposed in [10]. However, instead of using the social feature space to label nodes, in this article our aim is to leverage this information to reweight links. First, each edge is represented in a feature-based format, where the indices of the nodes that define the edges are used to create the features as shown in Figure 1. In this feature space, edges that share a common node are more similar than edges that do not. Based on the features of each edge, k-means clustering is used to separate the edges into groups using this similarity measure. Each edge cluster represents a potential affiliation, and a node will be considered as possessing one affiliation as long as any of its connections are assigned to that affiliation. Since the edge feature data is very sparse, the clustering process can be significantly accelerated as follows. In each iteration a small portion of relevant instances
2
Edges 8
1
5
10
(a)
4
…
9
3
1 (1,3) 1 (1,5) 1 (2,3) 0
Features (Node Index) 2 3 4 5 6 7 8 9 10 0 1 0 0 0 0 0 0 0 0 0 0 1 0 0 0 0 0 1 1 0 0 0 0 0 0 0 …..…
(b)
Nodes 1 2 3
Features (Edge Cluster ID) 1 3 0 0
2 3 2 3
…
6
7
……
(c)
Fig. 1: A simple example of a coauthorship network (Figure (a)). The solid line represents coauthorship of a paper in a data mining conference and the dashed line represents the activity of collaborating on a machine learning paper. In edgebased social features (Figure (b)), each edge is first represented by a feature vector where nodes associated with the edge denote the features. For instance here the edge “1-3” is represented as [1,0,1,0,0,0,0,0,0,0]. Then, the node’s social feature (SF) is constructed based on edge cluster IDs (Figure (c)). Suppose in this example the edges are partitioned into two clusters (represented by the solid lines and dashed lines respectively), then the SFs for node 1 and 2 become [3,3] and [0,2] using the count aggregation operator. Employing social features enables us to score “2-6” (cross-affiliation link) lower than “2-3” even though they have the same number of common neighbors.
(edges) that share features with cluster centroids are identified, and only the similarity of the centroids with their relevant instance need to be computed. By using this procedure, the clustering task can be completed within minutes even for networks with millions of nodes. After clustering the edges, we can easily construct the node’s social feature vector using aggregation operators such as count or proportion on edge cluster IDs. In [10], these “social dimensions” are constructed based on the node’s involvements in different edge clusters. Although aggregation operators are simply different ways of representing the same information (the histogram of edge cluster labels), alternate representations have been shown to impact classification accuracy based on the application domain [26].
4
Proposed LPSF Framework: reweighting the network + supervised learning classifier
Most of previous work in link prediction focuses on node-similarity metrics computed for unweighted networks, where the strength of relationships is not taken into account. However, proximities between nodes can be estimated better by using both graph proximity measures and the weights of existing links [22, 23]. Much of this prior work uses the number of encounters between users as the link weights. However, as the structure of the network can be highly informative, social dimensions provide an effective way of differentiating the nodes in collaborative networks [10, 27].
In this article, the weights of the link are evaluated based on the user’s social features extracted from the network topology under different similarity measures. For our domain, we evaluated several commonly used metrics including inner product, cosine similarity, and Histogram Intersection Kernel (HIK), which is used to compare color histograms in image classification tasks [28]. Since our social features can be regarded as the histogram of person’s involvement in different potential groups, HIK can also be adopted to measure the similarity between two people. Given the social features of person vi and person vj , (SFi , SFj ) ∈ X × X , the HIK is defined as follows: KHI (vi , vj ) =
m X
min{SFi , SFj },
(1)
i=1
where m is the length of the feature vector. The closeness of users can also be evaluated by the total number of common link clusters they associate with. We call this measure Common Link Clusters (CLC). Section 4.4 compares classification performance of these similarity metrics. 4.1
Unsupervised Proximity Metrics
In order to investigate the impact of link weights for link prediction in collaboration networks, we compare the performances of eight benchmark unsupervised metrics for unweighted networks and their extensions for weighted networks. The prediction scores from these unsupervised metrics can further be used as the attributes for learning supervised prediction models. We detail the unsupervised prediction metrics for both unweighted and weighted networks in the following sections. Let N (x) be the set of neighbors of node x in the social network and let Dx be the degree (the total number of neighbors) of node x. Obviously, in an unweighted network, Dx = |N (x)|. Let w(x, y) be the link weight between nodes x and y in a weighted network. Note that in our generated weighted network, the weight matrix W is symmetric, i.e. w(x, y) = w(y, x). Number of Common Neighbors (CN) The CN measure for unweighted networks is defined as the number of nodes with direct connections to the given nodes nodes x and y: CN (x, y) = |N (x) ∩ N (y)|.
(2)
The CN measure is one the most widespread metrics adopted in link prediction, mainly due to its simplicity. Intuitively, the measure simply states that two nodes that share a high number of common neighbors should be directly linked [4]. For weighted networks, the CN measure can be extended as: X CN (x, y) = w(x, z) + w(y, z). (3) z∈N (x)∩N (y)
Jaccard’s Coefficient (JC) The JC measure assumes that the node pairs that share a higher proportion of common neighbors relative to their total number of neighbors are more likely to be linked. From this point of view, JC can be regarded as a normalized variant of CN. For unweighted networks, the JC measure is defined as: JC(x, y) =
|N (x) ∩ N (y)| . |N (x) ∪ N (y)|
For weighted networks, the JC measure can be extended as: P z∈N (x)∩N (y) w(x, z) + w(y, z) P JC(x, y) = P . a∈N (x) w(x, a) + b∈N (x) w(y, b)
(4)
(5)
Preferential Attachment (PA) The PA measure assumes that the probability that a new link is created from a node x is proportional to the node degree Dx (i.e., nodes that currently have a high number of relationships tend to create more links in the future). Newman proposed that the product of a node pair’s number of neighbors should be used as a measure for the probability of a future link between those two [4]. The PA measure for an unweighted network is defined by: P A(x, y) = |N (x)| × |N (y)|. The PA measure extended for a weighted network can be defined as: X X P A(x, y) = w(x, z1 ) × w(y, z2 ). z1 ∈N (x)
(6)
(7)
z2 ∈N (y)
Adamic/Adar Coefficient (AA) The AA measure is related to Jaccard’s coefficient with additional emphasis on the importance of the common neighbors [29]. AA defines higher weights for the common neighbors that have fewer neighbors. The AA measure for unweighted networks is defined as: X 1 AA(x, y) = . (8) log(N (z)) z∈N (x)∩N (y)
The AA measure extended for a weighted network can be defined as: AA(x, y) =
X z∈N (x)∩N (y)
w(x, z) + w(y, z) P . log(1 + c∈N (z) w(z, c))
(9)
Resource Allocation Index (RA) The Resource Allocation Index has a similar formula as the Adamic-Adar Coefficient, but with a different underlying motivation. RA is based on physical
processes of resource allocation [30] and can be applied on networks formed by airports (for example, flow of aircraft and passengers) or networks formed by electric power stations such as power distribution. The RA measure was first proposed in [31] and for unweighted networks it is expressed as follows: X
RA(x, y) =
z∈N (x)∩N (y)
1 . |N (z)|
(10)
The RA measure for weighted networks can be defined as: RA(x, y) =
X z∈N (x)∩N (y)
w(x, z) + w(y, z) P . c∈N (z) w(z, c)
(11)
Inverse Path Distance (IPD) The Path Distance measure for unweighted networks simply counts the number of nodes along the shortest path between x and y in the graph. Thus, when two nodes x and y share at least one common neighbor, then P D(x, y) = 1. In this article, we adopt the Inverse Path Distance to measure the proximity between two nodes, where IP D(x, y) = 1/P D(x, y). IPD is based on the intuition that nearby nodes are likely to be connected. In a weighted network, IPD is defined by the inverse of the shortest weighted distance between two nodes. Since IPD quickly approaches 0 as path lengths increase, for computational efficiency, we terminate the shortest path search once the distance exceeds a threshold L and approximate IPD for more distant node pairs as 0. PropFlow PropFlow [17] is a new unsupervised link prediction method which calculates the probability that a restricted random walk starting at x ends at y in L steps or fewer using link weights as transition probabilities. The walk terminates when reaching node y or revisiting any nodes including node x. By restricting its search within the threshold L, PropFlow is a local measure that is insensitive to noise in network topology far from the source node and can be computed quite efficiently. The algorithm for unweighted networks is identical to that for weighted networks, except that all link weights are set equal to 1. PageRank The PageRank (PR) algorithm of Google fame was first introduced in [32]; it aims to represent the significance of a node in a network based on the significance of other nodes that link to it. Inspired by the same assumption as made by Preferential Attachment, we assume that the links between nodes are driven by the importance of the node, hence the PageRank score of the target node represents a useful statistic. Essentially, PageRank outputs the ranking scores (or probability) of visiting the target node during a random walk from a source.
A parameter α, the probability of suffering to a random node, is considered in the implementation. In our experiment, we set α = 0.85 and perform an unoptimized PageRank calculation iteratively until the vector that represents PageRank scores converges. For weighted networks, we adopted the weighted PageRank algorithm proposed in [33]. P Rw (x) = α
X P Rw (x) w(x) + (1 − α) PN . L(k) y=1 w(y)
(12)
k∈N (x)
where L(x) is the sum of outgoing link weights from node x, and the total weights across the whole network. 4.2
PN
y=1
w(y) is
Supervised Link Predictor
As mentioned in [23], unsupervised link prediction methods exhibit several drawbacks. First, they can only perform well if the network link topology conforms to the scoring function a priori. In other words, the assumption is both the links in the existing network and the predicted links score highly on the given measure. Second, the ranking of node pairs is performed using only a single metric, and hence the strategy may completely explore different structural patterns contained in the network. By contrast, supervised link prediction schemes can integrate information from multiple measures and can usually better model real-world networks. Most importantly, unlike in other domains where supervised algorithms require access to appropriate quantities of labeled data, in link prediction we can use the existing links in the network as the source of supervision. For these reasons, supervised approaches to link prediction are drawing increased attention in the community [18, 19, 17]. In this article, we follow a standard approach: we treat the prediction scores from the unsupervised measures as features for the supervised link predictor. We compare the accuracy of different classifiers on both unweighted and weighted collaboration networks. 4.3
Experimental Setup
Multi-relational Dataset Our proposed method is evaluated on two real-world multi-relational collaboration networks extracted from the DBLP dataset1 . The DBLP dataset provides bibliographic information for millions of computer science references. In this article we only consider authors who have published papers between 2006 and 2008, and extract their publication history from 2000 to 2008. In the constructed network, authors correspond to nodes, and two authors are linked if they have collaborated at least once. The link prediction methods are tested on the new 1
http://www.informatik.uni-trier.de/~ley/db/
co-author links in the subsequent time period [2009, 2010]. For the weighted variant, the number of coauthored publications is used as the weight on each link. Link heterogeneity is induced by the broad research topic of the collaborative work. • DBLP-A: In the first DBLP dataset, we select 15 representative conferences in 6 computer science research areas (Databases, Data Mining, Artificial Intelligence, Information Retrieval, Computer Vision and Machine Learning), and each paper is associated with a research area if it appeared in any conferences listed under that area. The collaboration network is constructed only for authors who have publications in those areas. • DBLP-B: In the second DBLP dataset, we select 6 different computer science research areas (Algorithms & Theory, Natural Language Processing, Bioinformatics, Networking, Operating Systems and Distributed & Parallel Computing), and choose 16 representative conferences in these areas. Similar DBLP datasets have previously been employed by Kong et al. to evaluate collective classification in multi-relational networks [34]. In this article, we aim to predict the missing links (coauthorship) in the future based on the existing connection patterns in the network.
Table 1: Data Statistics Data
DBLP-A
DBLP-B
Categories 6 6 # of Nodes 10,708 6,251 # of New Links 12,741 5,592 # of Existing Links 49,754 30,130 Network Density 9.78 × 10⁻⁴ 1.7 × 10⁻³ Maximum Degree 115 72 Average Degree 5.2 5.3
Evaluation Framework In this article, the supervised link prediction models are learned from training links (all existing links) in the DBLP dataset extracted between 2000 and 2008, and the performance of the model is evaluated on the testing links, new coauthor links generated between 2009 and 2010. Link prediction using supervised learning model can be regarded as a binary classification task, where the class label (0 or 1) represents the link existence of the node pair. When performing the supervised classification, we sample the same number of non-connected node pairs as that of the existing links to use as negative instances for training the supervised classifier. In our proposed LPSF model, the edge clustering method is adopted to construct the initial social dimensions. When conducting the link prediction experiment, we use cosine similarity while clustering the links in the training set.
The edge-based social dimension in our proposed method, LPSF, is constructed based on the edge cluster IDs using the count aggregation operator, and varying numbers of edge clusters are tested in order to provide the best performance of LPSF. The weighted network is then constructed according to the similarity score of connected nodes’ social features under the weight measure selected from Section 4. The search distance L for unsupervised metrics Inverse Path Distance and PropFlow is set to 5. We evaluate the performance of four supervised learning models in this article, which are Naive Bayes (NB), Logistic Regression (LR), Neural Network (NN) and Random Forest (RF). All algorithms have been implemented in WEKA [35], and the performance of each classifier is tested using its default parameter setting. In the DBLP dataset, the number of positive link examples for testing is very small compared to negative ones. In this article, we sample an equivalent number of non-connected node pairs as links from the 2009 and 2010 period to use as the negative instances in the testing set. The evaluation measures for supervised link prediction performance used in this article are precision, recall and F-Measure.
4.4
Results
This section describes several experiments to study the benefits of augmenting link prediction methods using LPSF. First, we compare the performance of different weighting metrics used in LPSF. Second, we evaluate how the number of social features affects the performance of LPSF. Finally, we examine how several supervised link prediction models perform on unweighted and weighted networks, and the degree to which LPSF improves classification performance under different evaluation measures.
Effect of Similarity Measure A critical procedure in LPSF is reweighting the original networks according to the similarity of the node pair’s social features. Figure 2 shows the F-Measure performance of LPSF using different weighting metrics on DBLP datasets. Here the number of edge clusters is set to 1000 for all conditions, and different classifiers have been adopted for the purpose of comparison. We observe that in the DBLP-A dataset, even though the performance of each weighting metric is mainly dominated by the choice of classifier, Histogram Intersection Kernel (HIK) and Inner Product perform better than CLC and Cosine in most cases. HIK dramatically outperforms Cosine in Naive Bayes by about 20% and Inner in Logistic Regression for 7%. The Cosine measure performs almost equally well for all classifiers but with a relatively low accuracy unfortunately. In the DBLP-B dataset, while Inner Product performs well on Random Forest, HIK outperforms other weighting metrics using the other classifiers. Accordingly, we select HIK as our default weighting metric in LPSF for the remainder of the experiments.
HIK
CLC
Inner
60 40 20 0
80
Cosine
F−Measure (%)
F−Measure (%)
80
RF
NN
NB
CLC
Inner
Cosine
60 40 20 0
LR
HIK
(a) DBLP-A Dataset
RF
NN
NB
LR
(b) DBLP-B Dataset
Fig. 2: Classification performance of LPSF on the DBLP Dataset using different similarity measures on node’s social features. The number of edge clusters is set to 1000, and Histogram Intersection Kernel (HIK) performs the best in both datasets. Varying the Number of Social Features Here, we evaluate how the number of social features (edge clusters) affects the link prediction performance of LPSF, and Figure 3 shows the corresponding classification accuracy under the F-Measure metric. In the DBLP-A dataset, Naive Bayes and Random Forest are relatively robust to the number of social features while Logistic Regression and Neural Network perform better with a smaller number of social features (less than 500). Similarly in the DBLP-B dataset, LPSF demonstrates better performance with fewer social features. Therefore we set the number of social features to 300 and 500 for the DBLP-A and DBLP-B datasets respectively.
80
NB
RF
NN
LR
70 60 50 40 30 01 3 5 7 10 15 20 25 30 Number of social features (× 100)
(a) DBLP-A Dataset
90
F−Measure (%)
F−measure (%)
90
NB
RF
NN
LR
80 70 60 50 40 01 3 5 7 10 15 20 Number of social features (× 100)
(b) DBLP-B Dataset
Fig. 3: Classification performance of LPSF using HIK on the DBLP Dataset with varying number of social features, using different supervised classifiers.
Supervised Link Prediction: LPSF Reweighting Figure 4 and 5 display the comparisons between LPSF and the baseline methods on the DBLP datasets using a variety of supervised link classification techniques,
90 Weighted
LPSF
Recall (%)
Precision (%)
70 60 50
Weighted
LPSF
60 40
RF
NN
NB
LR
0
Unweighted
80
Weighted
LPSF
60 40 20
20
40 30
Unweighted
80
F−Measure (%)
Unweighted 80
RF
NN
NB
LR
0
RF
NN
NB
LR
Fig. 4: Comparing the classification performance of supervised link prediction models on unweighted and weighted DBLP-A networks using Precision, Recall and F-Measure. The proposed method (LPSF ) is implemented using 300 edge clusters and the HIK reweighting scheme. Results show that LPSF significantly improves over both unweighted and weighted baselines, especially under Recall and F-Measures.
against both the unweighted and weighted supervised baselines. The same features are used by all methods, with the only difference being the weights on the network links. In this article, we compare the proposed method LPSF with alternate weighting schemes, such as the number of co-authored papers, as suggested in [22]. We see that in both DBLP datasets, Unweighted, Weighted and LPSF perform almost equally under Precision, though LPSF performs somewhat worse for some classifiers (Random Forest and Naive Bayes). When considering the number of collaborations between author pairs, the Weighted method slightly improves upon the performance of the Unweighted method. The proposed reweighting (LPSF ) offers substantial improvement over both the Unweighted and Weighted schemes on Recall and F-Measure in both datasets. In the DBLP-A dataset, LPSF outperforms the unweighted baseline the most dramatically on Logistic Regression, with about 23% improvement and 40% on Recall and F-Measure respectively. In the DBLP-B dataset, LPSF shows the best performance using Neural Network with accuracy improvements over baselines for 13% on Recall and 30% on F-Measure. LPSF calculates the closeness between connected nodes according to their social dimensions, which captures the nodes’ prominent interaction patterns embedded in the network and better addresses heterogeneity in link formation. By differentiating different types of links, LPSF is able to discover the possible link patterns between disconnected node pairs that may not be determined by the Unweighted and simple Weighted method, and hence exhibits great improvement on Recall and F-Measure. Since LPSF can be directly applied on the unweighted network, without considering any additional node information, it is thus broadly applicable to a variety of link prediction domains. Supervised Link Prediction: Choice of Classifier Figures 4 and 5 compare the performance of different supervised classifiers for link prediction. We found that the performance of the classifiers varies between datasets. Logistic Regression, Naive Bayes and Neural Network exhibit compara-
90 LPSF
70 60 50 40
Unweighted
80
Recall (%)
Precision (%)
Weighted
Weighted
LPSF
Unweighted
Weighted
LPSF
80
F−Measure (%)
Unweighted
80
60 40
60
40
20 20
30 RF
NN
NB
LR
0
RF
NN
NB
LR
RF
NN
NB
LR
Fig. 5: Comparing the classification performances of supervised link prediction models on unweighted and weighted DBLP-B networks using Precision, Recall and F-Measure. The proposed method (LPSF ) is implemented using 500 edge clusters and the HIK reweighting scheme. Results show that LPSF significantly improves over both unweighted and weighted baselines, especially under Recall and F-Measures.
ble performance. Somewhat surprisingly, Random Forest does not perform well with LPSF. We also observe that LPSF using Naive Bayes will boost the Recall performance over baseline methods at the cost of lower Precision. Therefore Logistic Regression and Neural Network are a better choice for LPSF in that they improve the Recall performance without decreasing the Precision. Using the traditional weighted features [22] does not help supervised classifiers for link prediction to a great extent. As discussed above, reweighting the unweighted collaboration network using our proposed technique, LPSF, performs the best.
5
Unsupervised Diffusion-based Link Prediction Models
Traditional unsupervised link prediction methods aim to measure the similarity for a node pair and use the affinity value to predict the existence of a link between them. The performance of link predictor is consequently highly dependent on the choice of pairwise similarity metrics. Most widely used unsupervised link predictors focus on the underlying local structural information of the data, which is usually extracted from the neighboring nodes within a short distance (usually 1-hop away) from the source. For instance, methods such as Common Neighbors and Jaccard’s Coefficient calculate the prediction scores based on the number of directly shared neighbors between the given node pair. However, a recent study of coauthorship networks by Backstrom and Leskovec shows that researchers are more interested in establishing long-range weak ties (collaborations) rather than strengthening their well-founded interactions [11]. Figure 6 shows the distance distribution of newly collaborating authors between 2009 and 2010 in the DBLP datasets. We discover that in both datasets the majority of new links are generated by a node pair with a minimal distance equal to or greater than two. This poses a problem for local link predictors which ignore information from the intermediate nodes along the path between the node pair. In the past few years, the diffusion process (DP) model has attracted an increasing amount of interest for solving information retrieval problems in different
35.75
31.4 Percentage (%)
Percentage (%)
28.6
23.5
15.7
7.8
0 0
21.45 14.3 7.15
2 4 6 8 10 12 14 Distance between node pairs in future links
0 0
(a)DBLP-A Dataset
2 4 6 8 10 12 Distance between node pairs in future links
(b)DBLP-B Dataset
Fig. 6: Probability distribution of the shortest distance between node pairs in future links (between 2009 and 2010) in the DBLP datasets. Distances marked as “0” are used to indicate that no path can be found that connects the given node pair.
domains [36–38]. DP aims to capture the geometry of the underlying manifold in a weighted graph that represents the proximity of the instances. First, the data are represented as a weighted graph, where each node represents an instance and edges are weighted according to their pairwise similarity values. Then the pairwise affinities are re-evaluated in the context of all connected instances, by diffusing the similarity values through the graph. The most common diffusion processes are based on random walks, where a transition matrix defines probabilities for walking from one node to a neighboring one, that are proportional to the provided affinities. By repeatedly making random walk steps on the graph, affinities are spread on the manifold, which in turn improves the obtainable retrieval scores. In the context of social network data, the data structure naturally leads to graph modeling, and graph-based methods have been proven to perform extremely well when combined with Markov chain techniques. In the following sections, we will explore the effectiveness of diffusion-based methods on solving link prediction problems. The next section introduces the diffusion process model (DP) and an embedding method based on diffusion processes, diffusion maps (DM). Our proposed diffusion-based link prediction models (LPDP and LPDM ) are discussed in 5.1 and 5.2. 5.1
Diffusion Process
We begin with the definition of a random walk on a graph G = (V, E), which contains N nodes vi ∈ V , and edges eij ∈ E that link nodes to each other. The entries in the N × N affinity matrix A provide the edge weights between node pairs. The random walk transition matrix P can be defined as P = D−1 A
(13)
where D is a N × N diagonal matrix defined as: � deg(i) if i = j dij = 0 otherwise
(14)
and deg(i) is the degree of the node i (i.e., the sum over its edge weights). The transition probability matrix P is a row-normalized matrix, where each row sums up to 1. Assuming f0 , a 1 × N dimensional vector of the initial distribution for a specific node, the single step of the diffusion process can be defined by the simple update rule: ft+1 = ft P (15) Therefore, it is possible to calculate the probability vector ft after t steps of random walks as ft = f0 P t (16) where Pt is the power of the matrix P. The entry fjt in ft measures the probability of going from the source node to node j in t time steps. The PageRank algorithm described in Section 4.1 is one of the most successful webpage ranking methods and is constructed using a random walk model on the underlying hyperlink structures. In PageRank, the standard random walk is modified: at each time step t a node can walk to its outgoing neighbors with probability α or will jump to a random node with probability (1−α). The update strategy is as follows: ft+1 = αft Pt + (1 − α)y (17) where y defines the probabilities of randomly jumping to the corresponding nodes. The PageRank algorithm iteratively updates the webpage’s ranking distribution (f ) until it converges. One extension of the PageRank algorithm is random walk with restart (RWR) [39], which considers a random walker starting from node i, who will iteratively move to a random neighbor with probability α and return to itself with probability 1−α. In the RWR update, y in Equation 17 is simply a 1 × N vector with the ith element equal to 1 and others to 0. The diffusion process can further be extended to different independent instances by updating the probability matrix as follows: Wt+1 = αWt Pt + (1 − α)Y
(18)
where W is a N × N matrix that represents the local relationships (weights) between different instances. For networked data, the adjacency matrix A can be directly used as W, and P can be formed by normalizing matrix W such that its rows add up to 1. Similarly, the N × N matrix Y consists of N personalized row vectors y. In the literature, a number of diffusion models have been proposed by tuning the functions for W for different application domains [39, 36, 38]. Our studies also reveal the choice of diffusion scheme has a substantial impact on the link prediction accuracy. In this article, we adopt the updating scheme used for Random Walk with Restart in Equation 18. To apply the diffusion model on the link
prediction problem, we calculate the prediction score for a given node pair (i, j) based on the corresponding entries in the final diffusion matrix: (t)
(t)
LP DP (i, j) = Wij × Wji
(19)
(t) Wij
is the corresponding (i, j) entry in Wt . Note that Wt is not neceswhere t sarily a symmetric matrix, meaning Wijt 6= Wji . 5.2
Diffusion Maps
The diffusion maps technique (DM), first introduced by Coifman and Lafon, applies the diffusion process model toward the problem of dimensionality reduction; it aims to embed the data manifold into a lower-dimensional space while preserving the intrinsic local geometric data structure [40]. Different from other dimensionality reduction methods such as principal component analysis (PCA) and multi-dimensional scaling (MDS), DM is a non-linear method that focuses on discovering the underlying manifold generating the sampled data. It has been successfully used on problems outside of social media analysis, including learning semantic visual features for action recognition [41]. (t) As discussed in the previous section, in diffusion models, each entry Wij indicates the probability of walking from i to j in t time steps. When we increase t, the diffusion process moves forward, and the local connectivity is integrated to reveal the global connectivity of the network. Increasing the value of t raises the likelihood that edge weights diffuse to nodes that are further away in the original graph. From this point of view, the Wt in the diffusion process reflects the intrinsic connectivity of the network, and the diffusion time t plays the role of a scaling factor for data analysis. Subsequently, the diffusion distance D is defined using the random walk forward probabilities ptij to relate the spectral properties of a Markov chain (its matrix, eigenvalues, and eigenvectors) to the geometry of the data. The diffusion distance aims to measure the similarity of two points (Ni and Nj ) using the diffusion matrix Wt , which is in the form of: [D(t) (Ni , Nj )]2 =
(t) (t) X (Wiq − Wjq )2 q∈Ω
ϕ(Nq )(0)
(20)
where ϕ(Nq )(0) is the unique stationary distribution which measures the density of the data points. Since calculating the diffusion distance is usually computationally expensive, spectral theory can be adopted to map the data point into a lower dimensional space such that the diffusion distance in the original data space now becomes the Euclidean distance in the new space. The diffusion distance can then be approximated with relative precision δ using the first k nontrivial eigenvectors and eigenvalues of Wt according to [D(t) (Ni , Nj )]2 '
k X s=1
(λts )2 ∗ (vs (Ni ) − vs (Nj ))2
(21)
Table 2: Algorithm: Diffusion maps on unweighted networked data Objective: Given a weighted graph W with N nodes, embed all nodes into a k-dimensional space.
1. Create Markov transition matrix P by normalizing matrix W such that each row sums to 1. 2. Compute diffusion matrix Wt at diffusion time t using Equation 18. 3. Perform eigen-decomposition on Wt , and obtain eigen-value λs and eigenvectors vs , such that Wt vs = λs vs . 4. Embed data by DM using Equation 22.
where λtk > δλt1 . If we use the eigenvectors weighted with λ as coordinates on the data, D(t) can be interpreted as the Euclidean distance in the low-dimensional space. Hence, the diffusion map embedding and the low-dimensional representation are given by Πt : Ni ⇒ {λt1 v1 (Ni ), λt2 v2 (Ni ), . . . , λtk vk (Ni )}T
(22)
The diffusion map Πt embeds the data into a Euclidean space in which the distance is approximately the diffusion distance: [D(t) (Ni , Nj )]2 'k Πt (Ni ) − Πt (Nj ) k2
(23)
The diffusion maps framework for the proposed method Link Prediction using Diffusion Maps (LPDM) is summarized in Table 2. LPDM defines the link prediction score for a given node pair (Ni , Nj ) by the diffusion distance, D(t) (Ni , Nj ), between them. 5.3
Evaluation Framework
In this article, we evaluate the performance of our proposed diffusion-based link prediction models (LPDP and LPDM ) on the same DBLP datasets mentioned in Section 4.3, and compare them with the eight unsupervised baselines listed in Section 4.1. Similar to the LPSF model, LPDP and LPDM can be applied on the weighted networks constructed with the edge clustering method. In the later section, we compare the performance of LPDP and LPDM on both unweighted and weighted DBLP networks. We use cosine similarity while clustering the links in the training set. Then the edge-based social dimension is constructed based on the edge cluster IDs using the count aggregation operator. We tested the algorithms with various numbers of edge clusters, and report the one offering the best performance of LPDP and LPDM. The similarity scores of the connected
nodes’ social features are measured using the Histogram Intersection Kernel, which are then used to construct the weighted network. The search distances L for unsupervised metrics Inverse Path Distance and PropFlow are set to 7 and 11 for the DBLP-A and DBLP-B datasets respectively. We sample the same number of non-connected node pairs as that of the existing future links to be used as the negative training instances. The Area Under the Receiver Operating Characteristic curve (AUROC) is a standard measure of accuracy that relates the sensitivity (true positive rate) and specificity (true negative rate) of a classifier. In this article, we report the performance of all unsupervised link prediction methods using AUROC. 5.4
Results
We conduct several experiments for evaluating the performance of the diffusionbased link predictors. First, we evaluate the link prediction performance of LPDP and LPDM on the unweighted DBLP datasets under different model parameter settings, such as the damping factor α and diffusion time t. For LPDM, we also examine how different sizes of the embedded diffusion spaces affect its link prediction performance. Additionally, we compare the diffusion-based link prediction models with other unsupervised benchmarks on both unweighted and weighted networks. Effects of Diffusion Time on LPDP As mentioned before, in diffusion processes, the diffusion time t controls the amount of weight likelihood that diffuses between long distance node pairs. The higher the value of t is, the more likely the link weights are to diffuse to the nodes that are further away. Figure 7 shows the effect of varying diffusion time on the LPDP link prediction accuracy for the DBLP dataset. In this experiment, we fix the value of α to 0.9 which offers LPDP the best performance. We discover that setting t to a higher value does not guarantee higher link prediction accuracy. LPDP performs best when t = 15, yielding an AUROC accuracy 84.61% and 85.49% on DBLP-A and DBLP-B datasets respectively. Effects of Damping Factor and Embedded Space Size on LPDM Here, we evaluate how the size of the embedded space and the value of the damping factor affect the link prediction performance of LPDM. Figure 8 shows the corresponding classification accuracy measured by AUROC. The diffusion time t has an insignificant effect on the performance of LPDM, and the results we report here are based on setting t to 100 and 60 for DBLP-A and DBLP-B respectively. In both datasets, a lower damping factor α yields higher accuracy, and LPDM demonstrates the best performance when α equals 0.55 and 0.65 on DBLP-A and DBLP-B respectively. Note that in Equation 18, a lower α results in a reduced probability of exchanges between a node and its connected neighbors. Our results reveal that the size of the embedded diffusion space greatly
AUROC accuracy (%)
0.86 DBLP−A DBLP−B
0.85 0.84 0.83 0.82 0.81 5
15
25
35 45 55 65 Diffusion time (t)
75
85
Fig. 7: Link prediction performance (AUROC) of LPDP with fixed damping factor α = 0.9 and varying diffusion time (t) on unweighted DBLP-A and DBLPB datasets. LPDP performs best on both datasets when t = 15.
0.8
0.78 0.76 0.74 0.72
α=0.55 α=0.5 α=0.65 α=0.75 α=0.85 α=0.9
0.7 1 10 20 30 40 50 60 70 80 90 Size of the embedded space for LPDM
(a) DBLP-A Dataset
AUROC accuracy (%)
AUROC accuracy (%)
0.8
0.75 0.7 0.65 0.6 0.55 1
α=0.5 α=0.55 α=0.65 α=0.75 α=0.85 α=0.9
10 20 30 40 50 60 70 80 90 Size of the embedded space for LPDM
(b) DBLP-B Dataset
Fig. 8: AUROC accuracy of LPDM on DBLP datasets with varying damping factor α and embedded space size. The diffusion time t for LP DM is set to 100 and 60 for DBLP-A and DBLP-B dataset respectively. affects the performance of LPDM. Here we report experimental results for embedded diffusion space dimensions ranging from 1 and 100. As shown in Figure 8, the diffusion maps technique is able to identify semantically similar nodes by measuring distance on an embedded space with a much smaller dimensionality. LPDM exhibits the best performance (79.61% and 79.08%) when the size of the embedded space equals 25 and 15 on DBLP-A and DBLP-B respectively.
Comparing Unsupervised Link Prediction Methods In Section 4.4, we evaluate our supervised link classifier LPSF which employs
an ensemble of unsupervised measures as features. These unsupervised measures can themselves be used for classification, although we do not expect an individual feature to be competitive with the supervised combination. Here, we compare these unsupervised measures with our proposed diffusion-based measures LPDP and LPDM on unweighted and reweighted graphs. Table 3 and Table 4 summarize the link prediction performance (AUROC) of individual unsupervised features on DBLP. We make several interesting observations. First, we note that among the individual features, PA is by far the best performer. This is because PA’s model for link generation is a particularly good fit to the DBLP network structure and real-world academic publishing. It is true that highly published authors generate many more publications than their less prolific peers and will also seek to collaborate with other highly influential (high degree) authors in the future. Hence the “richer get richer” phenomenon definitely exists in coauthorship networks. Since the preferential attachment model is already a good match for the academic publishing domain, reweighting the links does not improve link prediction performance; in fact, performance drops slightly. This highlights the sensitivity of unsupervised classifiers to the link prediction domain. Second, we observe that methods that rely on information gathered from node pairs’ directly connected neighbors, such as CN, JC, AA and RA, perform poorly with accuracies only slightly above 50%. This result is not unexpected, given that the authorship distribution shown in Figure 6 reveals that DBLP authors are more likely to form future collaborations with authors with whom they share longer range ties. By collecting structural information from all nodes in the path, IPD, PropFlow, PR, LPDP and LPDM significantly improve the link prediction performance. Furthermore, in both the DBLP-A and DBLP-B datasets, the models that incorporate the random walk technique (PR, LPDP and LPDM ) outperform the other two methods (IPD and PropFlow ). LPDP performs the best among the three with an AUROC accuracy of 85.49% and 84.61% on DBLP-A and DBLP-B datasets respectively. Unfortunately the diffusion maps in LPDM are not able to capture the semantically similar nodes after the diffusion process which results in inferior performance to LPDP. LPDM ’s performance is worse than LPDP by around 5%, while still performing better than IPD and PropFlow. This might be because the diffusion process after t diffusion time steps is good enough to capture the underlying similarity between nodes at farther distances using the node similarity extracted from the final diffusion matrix. Third, Tables 3 and 4 also include the comparison results of different unsupervised link predictors on weighted DBLP networks constructed using edge cluster information. On one hand, we found that in methods such as CN, JC, AA and RA, the weighting scheme does not affect the corresponding link prediction accuracy much. On the other hand, the weighting scheme helps to improve the performance of IPD, PropFlow, PageRank as well as LPDM by around 2%-3%. On both weighted datasets, PageRank performs best among all unsupervised features. It is also surprising that LPDP performs poorly on the weighted network,
Table 3: Link prediction accuracy of individual (unsupervised) classifiers on the DBLP-A dataset. Performance is evaluated on both unweighted networks and weighted networks constructed using social context features. Note that the reweighting scheme does not always improve accuracy at the individual feature level. AUROC (%) PA
AA
CN
JC
RA IPD PropFlow PageRank LPDP LPDM
Unweighted 86.68 50.95 50.95 50.95 50.20 77.46 Weighted 85.16 50.95 50.95 50.95 50.20 80.06
77.52 79.71
82.54 85.61
85.49 79.61 83.08 80.43
Table 4: Link prediction accuracy of individual (unsupervised) classifiers on the DBLP-B dataset. Performances are evaluated on both unweighted networks and weighted networks constructed using social context features. Note that the reweighting scheme does not always improve accuracy at the individual feature level. AUROC (%) PA
AA
CN
JC
RA IPD PropFlow PageRank LPDP LPDM
Unweighted 87.97 52.15 52.15 52.14 50.66 77.09 Weighted 87.11 52.15 52.15 52.15 50.66 76.23
76.98 76.66
83.60 87.14
84.61 79.08 80.11 80.09
reducing the accuracy by 2% on the DBLP-A dataset and 4% on the DBLP-B dataset. In summary, we observe that the reweighting scheme yields dramatic improvements in LPSF which integrates the first eight features listed in Table 3 in a supervised setting; however, it fails to boost the unsupervised performance of individual features. As mentioned in [42], the utility of using weights in link prediction is a somewhat controversial issue. Some case studies have shown that prediction accuracy can be significantly harmed when weights in the relationships were considered [42]. Our experiments reveal a more nuanced picture: although link weights (using the proposed approach) may not generate a large improvement for some individual unsupervised feature-level techniques, employing an appropriate choice of link weights (e.g., using LPSF ) in conjunction with a supervised classifier enables us to achieve more accurate classification results on the DBLP datasets.
6
Conclusion
In this article, we investigate the link prediction problem in collaboration networks with heterogeneous links. Most commonly-used link prediction methods assume that the network is in unweighted form, and treat each link equally. In this article, we proposed a new link prediction framework LPSF that captures nodes’ intrinsic interaction patterns from the network topology and embeds the similarities between connected nodes as link weights. The nodes’ similarity is
calculated based on social features extracted using edge clustering to detect overlapping communities in the network. Experiments on the DBLP collaboration network demonstrate that a judicious choice of weight measure in conjunction with supervised link prediction enables us to significantly outperform existing methods. LPSF is better able to capture the true proximity between node pairs based on link group information and improves the performance of supervised link prediction methods. However, the social features utilized effectively by the supervised version of LPSF are less useful in an unsupervised setting both with the raw proximity metrics and our two new diffusion-based methods, (LPDP and LPDM ). We observe that in the DBLP dataset researchers are more likely to collaborate with other highly published authors with whom they share weak ties which causes the random-walk based methods (PR, LPDP and LPDM ) to generally outperform other benchmarks. Even though the reweighting scheme greatly boosts the performance of LPSF, it does not always have significant impact on its corresponding unsupervised features. In conclusion we note that any weighting strategy should be applied with caution when tackling the link prediction problem.
7
Acknowledgments
This research was supported in part by NSF IIS-08451.
References 1. Xiang, E.W.: A survey on link prediction models for social network data. Science and Technology (2008) 2. Jin, E.M., Girvan, M., Newman, M.E.J.: The structure of growing social networks. Physical Review E (2001) 3. Salton, G., McGill, M.J.: Introduction to Modern Information Retrieval. McGrawHill, Inc., New York, NY, USA (1986) 4. Newman, M.: Clustering and preferential attachment in growing networks. Physical Review E 64(2) (2001) 5. Lu, L., Zhou, T.: Link prediction in complex networks: A survey. Physica A 390(6) (2011) 1150–1170 6. Newman, M.E.J.: Detecting community structure in networks. The European Physical Journal B - Condensed Matter and Complex Systems 38(2) (Mar 2004) 321–330 7. Soundarajan, S., Hopcroft, J.: Using community information to improve the precision of link prediction methods. In: Proceedings of the International Conference on the World Wide Web. (2012) 607–608 8. Ahn, Y.Y., Bagrow, J.P., Lehmann, S.: Link communities reveal multi-scale complexity in networks. Nature 466 (Oct 2010) 761–764 9. Wang, X., Sukthankar, G.: Link prediction in multi-relational collaboration networks. In: Proceedings of the IEEE/ACM International Conference on Advances in Social Networks Analysis and Mining, Niagara Falls, Canada (August 2013) 1445–1447
10. Tang, L., Liu, H.: Scalable learning of collective behavior based on sparse social dimensions. In: Proceedings of International Conference on Information and Knowledge Management (CIKM). (2009) 11. Backstrom, L., Leskovec, J.: Supervised random walks: Predicting and recommending links in social networks. In: Proceedings of the Fourth ACM International Conference on Web Search and Data Mining. (2011) 635–644 12. Pujari, M., Kanawati, R.: Tag recommendation by link prediction based on supervised machine learning. In: Proceedings of the International Conference on Weblogs and Social Media. (2012) 13. Sun, Y., Barber, R., Gupta, M., Aggarwal, C.C., Han, J.: Co-author relationship prediction in heterogeneous bibliographic networks. In: Proceedings of the International Conference on Advances in Social Networks Analysis and Mining. (2011) 121–128 14. Benchettara, N., Kanawati, R., Rouveirol, C.: Supervised machine learning applied to link prediction in bipartite social networks. In: Proceedings of the International Conference on Advances in Social Network Analysis and Mining. (2010) 326–330 15. Liben-Nowell, D., Kleinberg, J.: The link-prediction problem for social networks. Journal of the American Society for Information Science and Technology 58(7) (May 2007) 1019–1031 16. Taskar, B., Wong, M.F., Abbeel, P., Koller, D.: Link prediction in relational data. In: Neural Information Processing Systems. (2003) 17. Lichtenwalter, R.N., Lussier, J.T., Chawla, N.V.: New perspectives and methods in link prediction. In: Proceedings of the ACM SIGKDD International Conference on Knowledge Discovery and Data Mining. (2010) 243–252 18. Hasan, M.A., Chaoji, V., Salem, S., Zaki, M.: Link prediction using supervised learning. In: Proceedings of the SDM Workshop on Link Analysis, Counterterrorism and Security. (2006) 19. Popescul, A., Popescul, R., Ungar, L.H.: Statistical relational learning for link prediction. In: IJCAI Workshop on Learning Statistical Models from Relational Data. (2003) 20. Davis, D., Lichtenwalter, R., Chawla, N.V.: Supervised methods for multirelational link prediction. Social Network Analysis and Mining (2012) 1–15 21. Lee, J.B., Adorna, H.: Link prediction in a modified heterogeneous bibliographic network. In: Proceedings of International Conference on Advances in Social Networks Analysis and Mining (ASONAM). (2012) 442–449 22. de S´ a, H.R., Prudˆencio, R.B.C.: Supervised link prediction in weighted networks. In: International Joint Conference on Neural Networks (IJCNN). (2011) 2281–2288 23. Murata, T., Moriyasu, S.: Link prediction of social networks based on weighted proximity measures. In: Web Intelligence. (2007) 85–88 24. Liu, W., Lu, L.: Link prediction based on local random walk. EPL (Europhysics Letters) 85(5) (2010) 25. Yin, Z., Gupta, M., Weninger, T., Han, J.: A unified framework for link recommendation using random walks. In: 2010 International Conference on Advances in Social Networks Analysis and Mining (ASONAM). (2010) 152–159 26. Sen, P., Namata, G., Bilgic, M., Getoor, L., Gallagher, B., Eliassi-Rad, T.: Collective classification in network data. AI Magazine (2008) 93–106 27. Wang, X., Sukthankar, G.: Extracting social dimensions using Fiedler embedding. In: Proceedings of IEEE International Conference on Social Computing. (2011) 824–829
28. Barla, A., Odone, F., Verr, A.: Histogram intersection kernel for image classification. In: Proceedings 2003 International Conference on Image Processing. Volume 3. (2003) III–513–16 29. Adamic, L., Adar, E.: Friends and neighbors on the Web. Social Networks 25(3) (2003) 211–230 30. Ou, Q., Jin, Y.D., Zhou, T., Wang, B.H., Yin, B.Q.: Power-law strength-degree correlation from resource-allocation dynamics on weighted networks. Phys. Rev. E 75 (2007) 021102 31. Zhou, T., L¨ u, L., Zhang, Y.C.: Predicting missing links via local information. The European Physical Journal B - Condensed Matter and Complex Systems 71(4) (October 2009) 623–630 32. Brin, S., Page, L.: The anatomy of a large-scale hypertextual web search engine. Comput. Netw. ISDN Syst. 30(1-7) (1998) 107–117 33. Ding, Y.: Applying weighted pagerank to author citation networks. CoRR abs/1102.1760 (2011) 34. Kong, X., Shi, X., Yu, P.S.: Multi-label collective classification. In: SIAM International Conference on Data Mining (SDM). (2011) 618–629 35. Hall, M., Frank, E., Holmes, G., Pfahringer, B., Reutemann, P., Witten, I.H.: The WEKA data mining software: an update. SIGKDD Explorations Newsletter 11(1) (November 2009) 10–18 36. Donoser, M., Bischof, H.: Diffusion processes for retrieval revisited. In: Proceedings of IEEEE Conference on Computer Vision and Pattern Recognition (CVPR). (2013) 1320–1327 37. Yang, X., K"okar-tezel, S., Latecki, L.J.: Locally constrained diffusion process on locally densified distance spaces with applications to shape retrieval. In: Proceedings of IEEEE Conference on Computer Vision and Pattern Recognition (CVPR). (2009) 38. Wanga, J., Lia, Y., Baib, X., Zhanga, Y., Wangc, C., Tang, N.: Learning contextsensitive similarity by shortest path propagation. Pattern Recognition 44(10-11) (2011) 2367 – 2374 39. Pan, J.Y., Yang, H.J., Faloutsos, C., Duygulu, P.: Automatic multimedia crossmodal correlation discovery. In: Proceedings of the Tenth ACM SIGKDD International Conference on Knowledge Discovery and Data Mining. (2004) 653–658 40. Coifman, R.R., Lafon, S.: Diffusion maps. Applied and Computational Harmonic Analysis 21(1) (July 2006) 5–30 41. Liu, J., Yang, Y., Shah, M.: Learning semantic visual vocabularies using diffusion distance. In: Proceedings of IEEEE Conference on Computer Vision and Pattern Recognition (CVPR). (2009) 461–468 42. L¨ u, L., Zhou, T.: Role of weak ties in link prediction of complex networks. In: Proceedings of the ACM International Workshop on Complex Networks Meet Information and Knowledge Management. (2009) 55–58