The Time Dimension within Balanced Scorecard-Methodology . ... Balanced Scorecard for causal-oriented performance management is discussed. On this basis ...
Supporting Causal-Oriented Performance Management by a Dynamized BSC
1
Supporting Causal-Oriented Performance Management by a Dynamized Balanced Scorecard
Wolfgang Ossadnik / Franziska Rosenkranz / Jan Steins
Content
Abstract.................................................................................................................................................................. 1 1.
Introduction ................................................................................................................................................. 2
2.
A Design-Methodology for Performance Management Systems ............................................................ 3
3.
4.
2.1
The concept of the Balanced Scorecard ................................................................................................ 5
2.2
The Time Dimension within Balanced Scorecard-Methodology ......................................................... 10
A Dynamized Balanced Scorecard ........................................................................................................... 12 3.1
Purposes of dynamic BSC-modelling .................................................................................................. 12
3.2
A dynamized BSC-model ..................................................................................................................... 13
Conclusion.................................................................................................................................................. 23
Appendix.............................................................................................................................................................. 25 References............................................................................................................................................................ 28
Electronic copy available at: http://ssrn.com/abstract=2208528
Supporting Causal-Oriented Performance Management by a Dynamized BSC
1
Abstract The claim of performance management systems is to enhance managers’ knowledge about the events, circumstances and processes, which constitute organisational performance. Performance management systems serve as instruments to reconstruct the complexity of the value creation process. Thereby, modern companies, especially service companies, are confronted with a highly dynamic environment. Against this background, a performance management system is conceptualized as continuous process of redesigning performance management systems. Against this background, the suitability of the Balanced Scorecard for causal-oriented performance management is discussed. On this basis, the benefits of integrating a time dimension into BSC-methodology are evaluated from a designtheoretical point of view. Based on the developed design-framework and deficiencies of the standard Balanced Scorecard-methodology, a dynamic BSC is modelled. The aim of this model is to support managers understanding of the complex causal system, which constitutes the value creation process. Concerning the needs of causal performance management, the opportunities and limitations of dynamic models are discussed.
Keywords: Performance Measurement, Balanced Scorecard, System Dynamics
Electronic copy available at: http://ssrn.com/abstract=2208528
Supporting Causal-Oriented Performance Management by a Dynamized BSC
2
1. Introduction Performance Management is a complex and holistic process of conceptualizing and controlling organizational performance (cf. in the following Ossadnik, Rosenkranz, and Steins 2009, 1-30). In comparison to traditional, financial- and past-oriented instruments of management control, performance management systems (PMS) try to reconstruct and measure the past cause(s) of actual performance as well as the present circumstances, which influence the future development of performance. Therefore, performance management is an integrative part of formulating and implementing corporate strategy. Due to the objective of performance management, managers and management accountants are forced to develop a more causal-oriented view of organizational performance. Mathematic-logical management control systems, like the DuPont System of financial control or the systematic of double-entry book-keeping are not able to support managers by reconstructing the causal relations, which constitute the value creation process. Those instruments make the actual value realisation transparent, but cannot uncover the causes of the realized financial performance. For this purpose, managers need sound knowledge about the financial and non-financial success factors as well as their impact on the value creation process over the course of time. Therefore, managers and management accountants have to analyse the opportunities and limitation of reconstructing causal relations being used in defined means-end-relationships, which constitute corporate strategy. Against this background, the suitability of Kaplan’s and Norton’s Balanced Scorecard (BSC) (1992, 1993, 1996a, 1996b, 1997, 2000, 2001) for supporting a causal-oriented performance management can be questioned. This instrument should support managers and management accountants by conceptualising strategic decisions-making and strategic control on a consequently causal-oriented basis. This article points out, that the standard BSC-concept is not suitable to meet the causal demand of performance management. Especially, the understanding of leading indicators and lagging indicators as well as single-loop-learning and double-loop-learning within the BSC-methodology seems to be too simplistic for the complex task of performance management. Against this background, this article
Electronic copy available at: http://ssrn.com/abstract=2208528
Supporting Causal-Oriented Performance Management by a Dynamized BSC
3
shows possibilities to use the standard BSC-concept as a basis for designing a more causal-oriented, dynamic PMS. A dynamized BSC on the basis of System Dynamics-modelling is presented as a possibility to enhance the complexity of causal-oriented performance management to meet the complexity of the value creation process as the reference system of management control.
2. A DesignMethodology for Performance Management Systems Performance management may be readily understood as designing and executing corporate strategy by a coherent system of actions (Ossadnik, Rosenkranz, and Steins 2009, 3-4). Its objective is to enhance organisational effectiveness by means of optimizing the process of actual value realisation and future value creation within the organizational context (Cokins 2004, 1; Innes 2004, 826-832; Chenhall 2005, 396; Martin and Martin 2005, 51; Otley 1999, 364; Lebas 1995, 24-6, 29). Therefore, organizational performance as a complex causal construct combines a past- and future-oriented perspective of corporate management and strategy implementation. Performance management has to be supported by suitable technologies (Neely et al. 2002, 12), i.e. performance measurement systems. Such systems are sets of logically or causally connected indicators, which describe organizational performance at the level of value creation as well as value realisation. The design and implementation of performance measurement systems is a highly complex and firmspecific process. This is especially true, if value creation is not a mechanistic process (industrial enterprises) of producing standardized tangible products. Mechanistic processes are highly transparent, can be described deterministically and are often performed within a relatively stable environment. In this case, the future process of value creation can be controlled by past-oriented informations about value realisation. Thus, the specification and interpretation of indicators, which map organizational performance, do not evoke serious problems of performance control. If companies, especially service companies act in fast changing markets, the requirements for effective performance management, i.e. designing performance management systems (PMS) are far more complex. The effective design of a PMS requires sound knowledge about the causal relations which
Supporting Causal-Oriented Performance Management by a Dynamized BSC
4
constitute organizational performance as a complex construct. The complexity results from considering the influence of success factors, like customer satisfaction, customers, customer loyalty, service quality etc. not only on actual performance realized, but also on performance to be created. Therefore, these two levels of performance, value creation and value realisation, have to be integrated within the design of management control and PMS. In so far, an integrative methodology of reconstructing the value creation and designing PMS could support the effectiveness of corporate performance management. Such a methodology contains five phases: -
Analyzing the value creation process by means of formulating cause-effect-hypotheses;
-
Identifying controllable indicators to represent cause-effect-hypotheses;
-
Quantitative modelling of the resulting causal system;
-
Executing simulations and generating further knowledge about the dynamic and complexity of the causal system to create value;
-
Using the resulting knowledge for developing applications of the real process as well as readjustments of the formulated quantitative model.
In most firms some form of a PMS already exists. The implementation of a new PMS is a process of changing management control or performance management practice. This can be considered by analyzing a popular and widespread used PMS, the Balanced Scorecard by Kaplan and Norton. In the following, it is assumed, that the BSC-design seems to be too simplistic, i.e. its complexity is not suitable to enhance managers’ understanding of the complex causal system of value creation and value realisation. The BSC serves as a map of the value creation process, which is not adequate to its complexity in reality. Problems within performance management result, if managers use the BSCmodel for developing management procedures to optimize the real system of value creation. But the map is not the territory. To prevent managers from misinterpreting the causal relations relevant for the value creation process, detailed knowledge about the value creation process as well as theoretical knowledge about the construct ‘causality’ itself and the limits of the BSC methodology is necessary.
Supporting Causal-Oriented Performance Management by a Dynamized BSC
2.1
5
The concept of the Balanced Scorecard
The BSC-concept combines financial and non-financial, quantifiable and non-quantifiable, as well as past- and future-oriented performance measures in one coherent strategic management system (Kaplan and Norton 1992, 1993, 1996a, 1996b, 1997, 2000, 2001; Hansen and Mouritsen 2005). The defined objective of the BSC is to support the implementation of predefined strategic targets (cf. in the following Ossadnik, Rosenkranz, and Steins 2009, 4-10). Four perspectives of control are designed to map the key performance indicators (KPIs) of strategic control. In order to keep these informations at a controllable level, it is suggested approximately 25 indicators should be used (Kaplan and Norton 1992, 171-2; 1996b, 71, 76-7). Although referred as a balanced scorecard, the financial perspective is the key perspective of the BSC. The financial targets in the form of lagging indicators represent requested effects in a causal sense. The financial indicators of value realisation are top-down linked by cause-and-effect hypotheses to leading indicators of three perspectives mapping the process of value creation (customer perspective Æ ‘internal business process’-perspective Æ ‘learning & growth’-perspective). These perspectives serve as means for predefined financial ends. According to Kaplan and Norton (1996a), bottom-up analyses based on the defined relationships enable ex post (diagnostic) control of the value creation process underlying the realized financial output. The customer perspective shall support an optimal positioning of the company´s product on the market, and thereby the sales and turnover development as a source of performance (Kaplan and Norton 1992, 173, 177). KPIs of these perspectives are, for example, customer satisfaction, customer loyalty, intensity of customer relationships, number of new customers etc. The ‘internal business process’-perspective displays the processes, which influence product quality as well as service quality and therefore the customers’ perception of the company. Here, KPIs are, for example, throughput times, deficiency quotas, quality cost, productivity and profitability levels etc. The ‘learning & growth’-perspective represents the strategic sources of the company´s internal processes and therefore future performance. KPIs at this perspective are, for example, the number of patents, employee satisfaction, employee qualification, training cost etc. (Kaplan and Norton 1992, 174-6; 1993, 135).
Supporting Causal-Oriented Performance Management by a Dynamized BSC
6
Figure 1 (Ossadnik, Rosenkranz, and Steins 2009, 6) shows a typical causal chain within BSCmethodology (Kaplan and Norton 1997, 29). Financial Profitability
Learning& Growth
Employee Skills
Customer Satisfaction
Customers
Customer Loyalty
Advice Quality Execution Time Internal Business Processes
Figure 1: Cause-effect chain A problem of such an unidirectional understanding arises, if its complex success factors are incorporated in the causal system ‘value creation’. This can be explained with respect to hypotheses about causes and effects of quality, in the following exemplified by ‘service quality’. Service quality is a multidimensional construct, which causes indirect effects on the financial performance of a company (Ittner and Larcker 1996, 4-5; Rust et al. 1995). The multidimensionality comprises (1) the physical environment, (2) the reliability of implementation, (3) the competency of the implementers, (4) the (customer-focused) ability to emphasize and (5) employees’ willingness to perform (empathy and responsiveness) (Parasuraman et al. 1985; 1988, 35-8; 1991). Therefore, service quality can not be reconstructed as a single indicator within one perspective of the BSC (van Veen-Dirks and Wijn 2002). It is a construct which affects at least three BSC-perspectives: the ‘learning & growth’perspective (qualification/motivation of employees), the internal process perspective (physical environment) and the customer perspective (customers’ ability to emphasize). In this respect, at least three indicators of three different perspectives constitute service quality in the BSC. Managers are forced with the necessity to manage these dimensions of service quality not successively, as indicated by Kaplan and Norton, but simultaneously. Service quality is constituted by the causal interdependencies between indicators representing its dimensions (Figure 2 (Ossadnik, Rosenkranz, and Steins 2009, 7; Ossadnik and Steins 2011, 394)).
Supporting Causal-Oriented Performance Management by a Dynamized BSC
7
Financial
Customer Loyalty Employee Skills
(Perceived) Service Quality
Customer Satisfaction
Customer
Learning & Growth
Profitability
Advice Quality Execution Time Internal Business Processes
Figure 2: Service Quality as a causal system
It gets obvious, that complex success factors like service quality cannot be mapped adequately by using causal chains as they were used in the standard BSC-concept. Hence, a more sophisticated BSCapproach is necessary to make the value creation process transparent. In order to manage the causal dynamics constituting the value creation process, it is necessary to identify and analyse the timedepending, overlapping and/or amplifying effects of different management procedures. Even necessary, Kaplan and Norton don’t consider a time dimension within BSC-methodology explicitly (1996a). Therefore, managers can’t enhance their knowledge about value creation dynamics as well as the possibilities to exert influence on that system. From the perspective of complexity theory, a dilemma of the BSC-methodology arises. According to well-structured problems of control or to static environments, the implementation of the comprehensive BSC-methodology seems to be too time-consuming or costly, especially for SMEs. From a complexity-theorical point of view, the BSC seems to be too complex. A companywide set of cause-effect-hypotheses is not necessary for performance management, because business processes can be described mechanistically and control problems deterministically. On the other side, with respect to unstructured problems or in a highly dynamic context, another problem results. In this case, it is not possible to identify cause-effect-relations with adequate accuracy. Even if that would be possible, they are not stable over time, but permanently changing, so that it seems unrealistic to plan strategy implementation, which is a time-consuming process, on such a
Supporting Causal-Oriented Performance Management by a Dynamized BSC
8
basis. Strictly speaking, if strategy is a set of cause-effect-hypotheses and if these hypotheses are permanently changing, then the BSC cannot support strategic control and strategic learning effectively on the basis of one ex ante-defined set of causal hypotheses. From a complexity theoretical point of view, the BSC-methodology is not complex enough in such situations respectively for such problems of organizational control. According to Ashby, only complexity can absorb complexity (Ashby 1956), so that it is the dilemma of the BSC to be either too complex or too simplistic to serve as an effective PMS. If this is true, managers are faced with the problem that the BSC generates only such informations, which necessitate the employment of this concept. Over the time, a BSC-based management inevitably looses its connection to the real process of value creation, but without being aware of this problem. Against this background, two consequences for the BSC as a strategic management-technology result. First, the complexity of the standard BSC-concept could be reduced to fit this approach to wellstructured management problems. But this would mean designing the BSC as a deterministic measurement system like the ‘DuPont-System of Financial Control’. But such an approach is not suitable for strategic performance management purposes. Second, the complexity of the standard BSC-concept could be intensified to capture some of the complexity of the strategic management process. The aim of the BSC as a strategic management system is to support the implementation of corporate strategy, which encompasses the communication about the key characteristics of the value creation process, viz. its dynamics. Therefore, it is necessary to upgrade the static view of cause-effect-chains within the BSC, which results from an understanding of causal relations as representation of actually existing economic laws. Against this background, a defined set of causal hypotheses is sufficient to control the value creation process. But such an understanding of causality is not suitable due to a permanently changing environment. Rather, a PMS has to support managers’ understanding of the dynamics, that are the overlapping and amplifying causal effects, which constitute value creation. This is necessary for effectively planning of coordinated actions to optimize value creation and therefore for the implementation of corporate strategy.
Supporting Causal-Oriented Performance Management by a Dynamized BSC
9
In the following, the modelling approach System Dynamics is used to integrate a time dimension in the BSC-methodology. By this, it is possible to uncover and simulate the dynamics within the value creation process over the course of time. Moreover, a dynamic modelling supports managers’ understanding of interdependencies and causal feedbacks, which influence value creation and value realisation. Consequently, such an approach is aligned with the regulative guideline of ‘conceptualising complexity’ optimally. In practice, this guideline can scarcely be achieved. But on a lower level of aspiration (than ‘optimality’), an ‘adequate conceptualisation of complexity’ can be realized in firmspecific situations. As a consequence, the designed prototype of a dynamic BSC-model is based on the guideline of an adequate (and not an optimal) conceptualisation of complexity. Anticipating this, the following model as a hypothesized system of causal and logical relations is justified not by means of optimality, but of plausibility. Plausibility proves to be a presumption for developing and supporting a collective understanding of performance managers due to the complexity and dynamics of the value creation process, which depends on the firm specific organizational infrastructure as well as the corporate strategy. According to that, a coherent and plausible system of logical and causal relations supports the firm-specific concept of value creation. According to the explained design methodology of PMS, managers have to refine a dynamic BSC due to firm-specific characteristics and changes of the value creation process over the course of time. By using a dynamic BSC, managers are able to model a variety of hypothesized causal relations and simulate the effects of management activities, alternative causes, competitive scenarios etc. By this managers are able to enhance their causal knowledge about value creation dynamics. Insofar, dynamic BSC-modelling supports organizational learning. With System Dynamics, the complexity of a dynamized BSC can be varied due to firm-specific needs or the skills of managers using the concept. The complexity of a dynamic BSC-model itself is influenced by the complexity-dimensions of the (underlying) reference system, viz. the value creation process: (1) Number of elements (variety); (2) number of interdependencies between elements (connectivity); (3) form of the interdependencies (functionality).
Supporting Causal-Oriented Performance Management by a Dynamized BSC
10
In the following, the standard BSC-methodology will be discussed. It gets obvious, that causal oriented performance management on a BSC-basis is confronted with serious problems of control, because it is more complex than the BSC indicates. Ignoring this complexity would correspond to the aim of designing a model of the value creation process without considering constitutive aspects of this process! Therefore, the BSC implies an illusion of control, because value creation “… is under control on paper … but not in reality” (Hofstede 1978, 453; Langer 1975; Salancik and Meindl 1984; Dermer and Lucas 1986).
2.2
The Time Dimension within Balanced ScorecardMethodology
The use of mechanistic, unidirectional causal relations within the BSC-concept shall enable the management to operationalize the company’s strategy by a coherent system of actions (cf. in the following Ossadnik, Rosenkranz, and Steins 2009, 10-2). Assuming that enterprise planning without control is not sufficient, Kaplan and Norton (1996a, 1996b, 1997) deem the BSC to be suitable as a strategic control system. Kaplan and Norton define strategy as a set of hypotheses about cause-and-effect relationships (1996a, 30; 1997, 23). Causal related KPIs should illustrate the effects determining performance and thus allow strategy implementation and performance control. The underlying assumption of actually existing, objectifiable causal relations is understood in the form of an axiom, viz. it is not questionable within BSC-methodology (Kaplan and Norton 2000, 168). Like logical relationships, which are always valid by definition, such relationships are assumed as correct by causal laws (Kaplan and Norton 1996a, 67-71; Nørreklit 2000, 70-7; 2003, 610). These implicit assumptions lead to the negligence of the problem of whether and how at a determined point in time identified and defined causes and effects as well as the relationships between them can be controlled at a later point in time (Wong-On-Wing et al. 2007). Kaplan and Norton only implicitly provide a time dimension in BSC-methodology by declaring indicators as leading or lagging (Nørreklit 2000, 71-2; Ittner et al. 2003, 717). If a time dimension is explicitly integrated in BSC-methodology, serious problems due to the possibility of single-looplearning and double-loop-learning occur. By means of single-loop-learning, time is considered as a
Supporting Causal-Oriented Performance Management by a Dynamized BSC
11
source of deviations from planned values. The non-achievement of objectives is accordingly attributed back to unconsidered or ex ante inconsiderable disturbances in the scope of the hypothesized causeand-effect relationship(s). But analyses of deviations are problematic as causality is depicted as a construct in a one-sided manner. Causality formulates a connection that enables conclusions to be drawn on resulting effects assuming the existence of causes. Thus, an incident A (cause) would lead to an incident B (effect) occurring. But backtracking is by definition excluded (Luhmann 1999, 26-7). The observed effect does not permit the conclusion to be drawn that there are exactly those underlying causes as hypothesized and no others. Therefore, if the occurrence of B is observed, it cannot be proved that A was the cause of it. Moreover, if B cannot be observed (’Not-B’), it cannot be assumed that A has not been existed that is to say that ’Not-A’ is responsible for this. Incidents and circumstances could be causally responsible for the existence of B, which actually exist but were not observed or could not be observed (Bouwens and Abernethy 2000; Nørreklit 2000). This and the aforementioned problems create the danger of misinterpreting causal relations, especially if they are overlapping or amplifying each other. Therefore the suitability of the standard BSC-concept for feedback analyses or single-loop-learning in terms of Kaplan and Norton is limited (Luft and Shields 2003, 201-3). The aforementioned handling of causal relations within the BSC-concept refers to another aspect. The concepts of single-loop learning and double-loop-learning don’t expound the problem of analyzing the process that connects cause(s) and effect(s), viz. the effectuation. A cause neither leads to an effect automatically nor in a deterministic sense. Rather, the effect has to be effectuated by actions of individuals (Luhmann 1999, 24-6). The causal terminology of Kaplan and Norton (1996b, 2001) and their illustration of causal chains (Figure 1) neglects the existence of equifinality (Slife and Williams 1995; Gresov and Drazin 1997). Assuming the existence of exactly one identifiable cause and effect, this effect can be generated through a myriad of different, equally effective and equally efficient sets of actions, without a change in the observed cause and effect (Gresov and Drazin 1997, 416-18). So, even provided that causes and effects are exactly known, the concrete set of actions, which leads to the observed effect, cannot be assumed to be known (Gresov and Drazin 1997, 406-9). Therefore,
Supporting Causal-Oriented Performance Management by a Dynamized BSC
12
managers are forced to permanently search for alternative actions, which lead to a desired effect. This is not provided by the causal understanding within the standard BSC-methodology. In the following, the modelling approach System Dynamics is used to integrate a time dimension in the BSC on a conceptual level. This allows to model complex interdependencies of multiple causes and effects within a closed system of value creation and value realisation. If the model is adjusted to firm-specific needs, it can serve as a support for simulations and feedback-analyses of alternative strategic actions.
3. A Dynamized Balanced Scorecard 3.1
Purposes of dynamic BSCmodelling
System Dynamics (cf. in the following Ossadnik, Rosenkranz, and Steins 2009, 12) offers the chance to model and simulate dynamic structures in cause-and-effect networks (Coyle 1996, 10). The complexity and non-linearity of the models, the consideration of time lags and feedback-effects prove to be the key aspects of this approach (Legasto et al. 1980, 7; Forrester 1994, 245). The model enables deeper insights into the complexity and dynamics of value creation, especially if complex constructs like service quality, the satisfaction of customers and employees etc. are considered within performance management and performance measurement (Wolstenholme 1990, 3-5). Typically, the System Dynamics-modelling is characterized by a myriad of remodelling activities, because modelled cause-effect relationships change over the course of time. Therefore, causal relations between KPIs have to be tested empirically and evaluated by expert opinions (Büssow and Mainz 2002, 46). This complies with single-loop-learning and double-loop-learning within a dynamized BSC. The modelled BSC is first and foremost a generic framework, of which the usefulness for strategic purposes depends on adjustments due to the firm-specific causal structure of the value creation process. Albeit, interpretations of explicitly modelled relationships between KPIs could clarify key characteristics and problems of causal-oriented performance management. The purpose of the following BSC-prototype is to design a dynamic system of causal relations to exemplify possible enhancements for performance management vis-à-vis the standard BSC-concept.
Supporting Causal-Oriented Performance Management by a Dynamized BSC
3.2
13
A dynamized BSCmodel
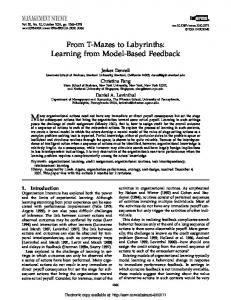
In the following, the dynamic BSC-model of a service company (i.e. a consulting company) is designed (cf. in the following Ossadnik, Rosenkranz, and Steins 2009, 12- 23; Ossadnik and Steins 2001, 395 - 408). This allows to model intangible success factors, like service quality, customer and employee satisfaction etc. as a complex causal construct. The integration of such constructs requires to consider overlapping and amplifying causal relations and causal feedbacks within the value creation process between indicators of a single BSC-perspective and between indicators of different BSCperspectives (Ittner et al. 2003). By considering time lags between causes and effects as well as feedback-loops over the course of time, a time dimension is integrated into BSC-methodology. Figure 3 shows the causal model of a dynamic BSC. The model contains the four perspectives of the standard BSC-concept. In addition, a further perspective of control is considered, the external perspective. This perspective maps the competitive environment (behavior of competitors, market potential etc.), which influences not only the relative market share, i.e. (number of customers), but also the customers’ perception of the produced service quality, that is perceived service quality. The transparency of the value creation process, as a necessary, but not sufficient presumption of managing and measuring the value creation process, requires more than 16 to 25 indicators, as estimated by Kaplan and Norton (1996a, 162-163). The model presented in Figure 3 contains 41 endogenous and 19 exogenous variables. So the complexity of the standard-BSC is intensified by means of variety and by means of connectivity, because causal interdependencies between leading and lagging indicators are explicitly considered. The dynamic BSC contains 83 direct causal or logical connections. Moreover, the interdependencies exhibit a higher functionality. First, causal relations and logical relations are explicitly differentiated to prevent managers from misinterpreting cause-effectrelationships as logical relations. In Figure 3 (Ossadnik, Rosenkranz, and Steins 2009, 149; Ossadnik and Steins 2011, 396), causal relations are marked with two crossing lines (time delay marks). Second, specifically presumed time lags form the basis of every hypothesized cause-effect-relationship within the model (see the Appendix for the quantitative declaration of the variables). Third, the dynamic
Supporting Causal-Oriented Performance Management by a Dynamized BSC
14
model contains more than 50 direct and indirect feedback-loops. These loops lead to a certain selfdynamic, if the model is simulated over a defined time period. To sum up, the dynamic BSC possesses a higher order of complexity than the standard BSC. Qualitatively, the model presented in Figure 3 can be described as following. The offered service of the modelled company respectively the produced service quality causes (with a time delay) a certain degree of perceived service quality as a representation of customer satisfaction (Upah and Fulton 1985; Zeithaml et al. 1985; Sundstrom and Altman 1989). This KPI causes an effect on the number of new and the customers’ migration to competitors (lost customers) per period, which lead (on average) to a higher total turnover per period (Kadampully 1998). At the same time, the reputation of the perceived service quality leads to a higher turnover per customer. In sum, these variables cause a positive effect on the Economic Value Added (EVA) as the KPI of financial performance (Stern et al. 1996). In contrast, the modelled cost of capital, influenced by the executed investments, has a negative effect on the EVA (Figure 3). It is assumed, that a part of the realized EVA is used in the following period for investments in the quality of the executed service and for marketing investments, which aim to achieve a positive effect on customers’ behavior. Quality investments have either the form of investments in the IT-infrastructure of the company or investments in the qualification of the employees, which are engaged in the service. Investments in trainings are directly considered as cost of human capital. Combining these cost with the depreciation of the existing IT leads to the cost of capital, considering a constant capital cost rate. These cost of capital have a negative effect on the modelled EVA of the next period. The allocation of the quality investments is based on an allocation coefficient. This coefficient compares the effects of investments in the IT infrastructure (IT investments) and investments in trainings, which depend on the existing quality of the IT infrastructure respectively the employees’ skills. The quality investments are distributed to the place of higher efficiency. The average quality level of the IT infrastructure as well as the average level of employees’ skills has a positive effect on the produced service quality and by considering expectations of customers also on the perceived service quality (Figure 3).
Supporting Causal-Oriented Performance Management by a Dynamized BSC
Financial External
Total Turnover
Turnover per + Customer +
+
Capital Cost Rate
NOPAT
+
+
Table Marketing +
-
STEP Marketing
Depreciation IT of IT Assets
+ +
Investment Cost
Cumulative EVA
Quality Investments
+
Table Investment Coefficient
Planning Coefficient
-
Quality of IT + Infrastructure Investments in IT Infrastructure
Investment Effect
+
Internal Processes
Allocation Coefficient
-
Total Number of Trainings
Produced Service Quality
Next Purchase
-
+
+
Number of Training Programs
+
+
Employee Skills
Table Learning Curve +
-
Quality of Advice -
Training + Effect
+
+
Average Execution Time of the Service
Planning Coefficient +
Table Allocation
Necessity of Trainings
+ -
Learning & Growth
Figure 3: Dynamic Balanced Scorecard
-
Table Available Employees
+
+
Training Costs
Service + Quality
-
Investments in Employee qualification
+
Perceived Service Quality
Expected Service Quality
+
+
+
Table Training Cost
Table + Image
Increase of + Expectations
+
+ STEP QI
Customer Potential
Marketing Effect
Planning Coefficient + IT Obsolescence
-
+
+
+
Increase of Investment Coefficient
+
Lost Customers
+ Planning Coefficient
-
+ +
Indirect New Customers
+ New Customers + by Marketing
Relative Image Intensity
-
+
Table Lost Customers
+ +
+
+
+
+
+
-
+
+
Marketing Investments
EVA
+
Planning Coefficient
+
-
Customer Base
STEP MC
+
Marketing Competitors Cost of Capital
+
Customer
+
Increase + in Time Uncertainty of Business Cycle Total Time + Oscillation Elapsed Market + Oscillation Business + Potential Cycle
15
Average Time of Research
Percentage of Available Employees
Supporting Causal-Oriented Performance Management by a Dynamized BSC
16
On the basis of the aforementioned qualitative description, the dynamic BSC can be modelled quantitatively. Vensim DSS 5.6a as a System Dynamics-standard software is used to compile the dynamic BSC. The preconditions for using this software are not excessively demanding. So the model is applicable in day-to-day practice. The model is configured for simulations over a strategic planning horizon of five years, viz. 60 periods (months). Therefore, the effects respectively the development of KPIs over the course of time can be evaluated by executing dynamic simulations. Especially, it is possible to analyse the interrelation of short-term and long-term effects. According to the aforementioned explanations, the EVA is chosen as starting point of the quantitative modelling phase. The Appendix contains the quantitative description of all endogenous and exogenous variables of the dynamic BSC-model. The EVA as an accounting concept of periodical residual income is defined as “NOPAT-Cost of Capital” with NOPAT as difference between total turnover per period, investment cost and cost of capital as IT Assets multiplied with a capital cost rate (Dillon and Owers 1997). The investment cost are defined as sum of investments in trainings, marketing investments, depreciation of IT and the cost of the average execution time of the service (Ittner and Larcker 1996, 3). IT Assets are modelled as the accumulation of the difference between IT investments and the depreciation of IT per period over the course of time. The capital cost rate is causally influenced by the oscillation of the market potential. With this variable of the external BSC-perspective, the effects of cyclical movements of the market on financial and non-financial KPIs of the company are considered. The quality investments per period are assumed as 10 % of the EVA of the previous period plus a rate, defined by the variable increase of investment coefficient. Desinvestments are excluded from the model. The time delay is modelled by the DELAY-function of Vensim. In the same way, 2% of the EVA of a period are used for marketing investments in the following period. Via the increase of investment coefficient, the percentage of the EVA used for quality investments increases the higher, the lower the level of perceived service quality in the previous period. This is modelled by a concave relationship using the LOOK UP-function of Vensim. The variable quality investments is therefore an endogenous part of the dynamic BSC-model. The quality investments calculated in one period can be effectively used as investments in trainings and investments in IT in same period. Accordingly, investments in trainings are defined as “Quality Investments·Allocation
Supporting Causal-Oriented Performance Management by a Dynamized BSC
17
Coefficient” and the investments in IT infrastructure as “Quality Investments·(1-Allocation Coefficient)”. The allocation coefficient varies between -1 and 1. The necessary adjustments to use it for the allocation of investments allocation is modelled by the IF-THEN-ELSE-function of Vensim. The allocation coefficient is modelled time delayed as relationship between training effect and investment effect. If the training effect exceeds the investment effect, the investments in trainings exceed the investments in IT infrastructure in the following period. This effect is smoothed exponentially over five periods. Depending on the cost of employee trainings, a number of trainings can be executed to enhance employees’ skills. A learning effect is integrated in the model as the cost per training decreases with total number of (executed) trainings. The number of training programs realized in one period affects percentage of employees, which are available to communicate and interact with customers. By this, it is assumed that every executed training program draws upon 3 1/3 % of the total number of employees. The training effect, which influences the allocation coefficient is modelled as number of training programs multiplied with the necessity of trainings with a time delay of one period. The necessity of trainings is the lower, the higher the level of employees’ skills. Employees’ skills are scaled by points, which can be seen as proxy for a skills-index, which has to be designed due to firm-specific characteristics. The relationship of the necessity of trainings and the level of employees’ skills is modelled by a learning curve. This curve implies a negative decreasing effect of the existing level of employees’ skills on the necessity of trainings. This effect is smoothed exponentially over one period. Employees’ skills are modelled as a level variable, which is defined as the cumulative difference of the training effect and the investment effect. Such a design implies that the effectiveness of employees’ skills within the value creation process has to be evaluated not absolutely, but relatively. If IT investments lead to the implementation of new IT technologies, the skills of employees to use the existing IT infrastructure effectively will reduce. Trainings are necessary to enhance employees’ skills, so that the IT infrastructure can be used adequately. Therefore, the level of employees’ skills increases, if the training effect exceeds the investment effect in one period. This effect is smoothed exponentially over six periods, because enhancing the average level of operative skills and the underlying knowledge
Supporting Causal-Oriented Performance Management by a Dynamized BSC
18
takes time by definition. Here, a negative causal feedback-loop between the employees’ skills, the necessity of trainings and the training effect exists. The variable employees’ skills has a positive effect on the objectifiable quality of the advices given to customers. The average time of research for professional advices determines over how many periods the effect of employees’ skills on the quality of advice is smoothed. The average time of executing the service is an important indicator of the dynamic BSC-model as it integrates main effects of the ‘learning & growth’- and ‘internal processes’ perspective. It is exponentially smoothed over four periods (Appendix). Thus, the quality of IT infrastructure as well as employees’ skills and the percentage of available employees to execute the service have a negative effect on the average execution time of the service. Due to value creation, a decreasing average time has to be evaluated positively, because of the positive effect on produced service quality. The quality of IT infrastructure-level is the accumulated difference of the investment effect, which is determined by the IT investments and the IT obsolescence over course of time. The variable produced service quality is modelled as a combined causal effect of the objectifiable characteristics of service quality, viz. the average execution time of the service, the quality of the IT infrastructure and the quality of advice. The effect of these variables, represented by the produced service quality, is realized at the next purchase of the service to customers. With the variable expected service quality, it is considered, that quality as a complex construct is usually influenced by external effects, like the relative image of a company, which serves as proxy for the relative quality level compared to competitors. Moreover, increasing expectations of customers, caused by intensified competition and technological progress, lead to an increase of expected service quality over the course of time. The variable perceived service quality represents the combined effect of the relational and objectifiable dimension of quality and is therefore modelled as a causal effect of perceived and produced service quality. It is the lower, the higher the expected service quality, and the higher, the higher the perceived service quality. The perceived service quality causes a positive, exponentially smoothed effect on the number of indirect new customers per period for the following five periods (under the condition, that the actual customer base of each period is lower than the customer potential). The variable indirect new customers represents the number of customers, which
Supporting Causal-Oriented Performance Management by a Dynamized BSC
19
use the service not because of direct marketing activities, but because of the reputation of the service, communicated by the actual customers. Simultaneously, it is plausible to assume, that the average number of lost customers per period, decreases, if the perceived service quality increases. According to empirical findings by Ittner and Larcker and Homburg et al., the negative relationship between perceived service quality and lost customers is modelled by a hyperbolic function of customers’ migration (Ittner and Larcker 1996; Homburg et al. 1999, 184-5). Though, multiple positive effects of perceived service quality on average number of loyal customers are considered. The initial value of the customer base is 600 customers. Moreover, the perceived service quality has a positive effect on the turnover per customer, because it is plausible to assume, that these are willing to pay (on average) a higher price for high-quality services. The turnover per customer is also influenced by the oscillation of the market potential, i.e. cyclical developments of customers’ buying power. The customer base is also affected by the market potential respectively its oscillation caused by cyclical movements of the market. The oscillation of the market potential is defined as SINUSfunction with the product of the total time of the simulation elapsed and the uncertainty of the business cycle, modelled as normally distributed random variable with an expected value of 0,1 and a standard deviation of 0,01. The oscillation of the market potential causes an effect on the marketing investments respectively marketing activities of the modelled company as well as its competitors (marketing competitors). These marketing activities cause an effect on the relative image intensity, which is defined as the quotient of the company’s marketing investments and the marketing of competitors. The relative image intensity determines the effectiveness of marketing investments with regard to the acquisition of new customers (by marketing). Therefore, a positive direct and indirect effect and a negative effect determine the development of the customer base over the course of time. The average number of loyal customers (customer base) multiplied with the turnover per customer lead to the total turnover per period. It is obvious, that this is not a causal relation, but a logical relation, which is correct by mathematic-logical definition. With such logical relationships, the NOPAT, cost of capital and last but not least the EVA are modelled. The aforementioned explanations describe the cycle, which influences the behavior of all endogenous variables as a dynamic system
Supporting Causal-Oriented Performance Management by a Dynamized BSC
20
over the course of time. A simulation of the model allows developing further insights into the multiple interdependencies constituting this quantitatively modelled, dynamic system of cause-effecthypotheses. As previously described, a strategic horizon of 60 periods (60 month) is simulated. Within this time span, scenarios are designed to analyse the dynamic behavior of the modelled value creation system. The overlapping and amplifying changes of the value creation process over the course of time are caused by an assumed behavior of competitors (Figure 4 (Ossadnik, Rosenkranz, and Steins 2009, 20; Ossadnik and Steins 2011, 404)).
Competitive Scenario (CS 1) Intensification of marketing investments by competitors + 20% as from time period 10
Competitive Scenario 2 (CS 2)
Competitive Scenario 3 (CS 3)
Intensification of marketing investments (direct response) +20% as from time period 13
Intensification of quality investments (indirect response) +20% as from time period 13
Figure 4: Scenarios
As from time period it is assumed that competitors raise their marketing activities about 20% each time period (CS 1). With CS 2, it is further assumed that the modelled company raises the marketing investments about 20% each time period as from time period 13 to compensate the negative effects of this intensified competitive situation on the EVA, viz. value creation (Figure 5 (Ossadnik, Rosenkranz. and Steins 2009, 20; Ossadnik and Steins 2011, 405)). As an alternative strategic option to CS 2, the modelled company has the possibility to raise the quality investments about 20% each time period as from time period 13 (CS 3). Figure 5 - Figure 11 (Ossadnik, Rosenkranz, and Steins 2009, 20-1; Ossadnik and Steins 2011, 407) indicate that CS 1 has sound negative effects on the process of value creation and especially the perceived service quality as a KPI of the dynamic model, which integrates effects of three BSC-perspectives.
Supporting Causal-Oriented Performance Management by a Dynamized BSC
21
Figure 5: EVA 200.000
150.000
100.000 MU 0 50.000
0 0
6
12
18
24
30 36 Time (Month)
42
48
54
60
CS 3: Marketing Competitors +20% as from time period 10, Quality Investments +20% as from time period 13 CS 2: Marketing Competitors +20% as from time period 10, Own Marketing +20% as from time period 13 CS 1: Marketing Competitors +20% as from time period 10 Basis Scenario
CS 1 shows a critical situation with respect to perceived service quality. Customers are more satisfied with the service. But this positive effect is not primarily caused by the in-house produced characteristics of the service (produced service quality). The intensified marketing activities of competitors cause a negative effect on the image of the company and its services (relative image intensity). Therefore, they drop their expectations of the services’ quality (expected service quality), which lead to a positive effect on the perceived service quality by customers as well as the average number of indirect new customers. At the same time, the intensified marketing activities of competitors lead to a negative effect on the average number of new customers. Ceteris paribus, this causal effect leads to decreasing average number of loyal customers (customer base). But the relationship between new customers and the customer base is a logical, not causal relation (see table 1 for the quantitative declaration of the customer base). With CS 2, it is possible to compensate competitors’ intensified marketing activities. The CS 2-effects overlap the CS 1-effects, so that the EVA increases (Figure 5). The main cause of this effect is an increased customer base. Simultaneously, the perceived service quality decreases, caused by the increased expectations of customers. The IT
Supporting Causal-Oriented Performance Management by a Dynamized BSC Figure 7: Perceived Service Quality
Figure 6:Customer Base
800
22
100
75
600 Kunden
Points
400
50
200
25
0 0
6
12
18
24 30 36 Time (Month)
42
48
54
0
60
0
6
12
18
24 30 36 Time (Month)
42
48
54
60
Figure Expected Service Quality
Figure 8: Produced Service Quality 100
60
75
50
Points
Points
50
40
25
30
20
0 0
6
12
18
24 30 36 Time (Month)
42
48
54
60
0
6
12
24 30 36 Time (Month)
42
48
54
60
48
54
60
Figure 11: IT Quality
Figure 10: Employee Skills 80
60
60
50
Points
%
40
40
20
30
0
18
20 0
6
12
18
24 30 36 Time (Month)
42
48
54
60
0
6
12
18
24 30 36 Time (Month)
42
CS 3: Marketing Competitors +20% as from time period 10, Quality Investments +20% as from time period 13 CS 2: Marketing Competitors +20% as from time period 10, Own Marketing +20% as from time period 13 CS 1: Marketing Competitors +20% as from time period 10 Basis Scenario
quality reaches the level of the basis scenario, because higher investments are possible, caused by the increased EVA. With CS 3, an alternative strategic response to CS 1 is designed. As Figure 5 - Figure 11 indicate, intensified quality investments have a positive effect on KPIs of the value creation process within all 5 perspectives of the dynamic BSC-model. With such investments, the perceived service
Supporting Causal-Oriented Performance Management by a Dynamized BSC
23
quality, IT quality and employees’ skills reach the highest levels compared to CS 1 and CS 2. An essential advantage of dynamic BSC-modelling gets obvious, because it is possible to analyse the complex construct service quality according to alternative scenarios in detail. In CS 2, the perceived service quality increases, compared to the basis scenario. This is caused by the decreased expectations of customers. Thereby, the intensified marketing activities in CS 1 have a negative effect on IT quality as from time period 30. Moreover, CS 2 has a negative effect on the development of the produced service quality, that is to say, the objectifiable characteristics of the service, which are produced inhouse. Although KPIs of two BSC-perspectives show negative effects, the perceived service quality shows a positive effect, as well as the EVA as KPI of the financial perspective. Therefore, the dynamic BSC provides differentiated informations about value creation and value realisation as two levels of the causal construct organisational performance. The decision between CS 2 and CS 3 as strategic responses to CS 1 demands a reference to firm specific characteristics (strategy, organizational infrastructure etc.) and preferences of managers. According to the explained design approach of PMS, firm-specific adjustments of the presented prototype of a dynamic BSC and the comparison of simulations with the real process of firm-specific value creation and value realisation are next steps in the process of continuous redesigning PMS.
4. Conclusion Within the scope of holistic performance management, managers are faced with the task to integrate the measurement and management of the value creation- and the value realisation-level of organizational performance (Ossadnik, Rosenkranz, and Steins 2009, 23-4). By using dynamic PMS, like the presented, dynamized BSC, managers are able to focus their attention on the complex system of overlapping and amplifying cause-and-effect relationships, which constitute the value creation process. If causal relationships are used as basis of the strategic management process respectively strategy implementation, managers are faced with the need to develop sound knowledge about causality. The standard BSC-concept seems to be limited for such control- or learning purposes. In this respect, a dynamic model, designed according to the System Dynamics-methodology, has a potential to enhance managers’ understanding of the value creation process. This is especially true, if complex
Supporting Causal-Oriented Performance Management by a Dynamized BSC
24
constructs like ‘service quality’ and ‘organisational performance’ exert a great influence on the effectiveness of value creation. Due to changes of the environment and the causal system which represents the value creation, a dynamic modelling approach supports single-loop-learning as well as double-loop-learning. The premises of such a dynamized BSC-model have to be controlled continuously. This is a presumption of effective feedback-analyses within the closed dynamic BSC-model. The feedback-analyses offer managers an opportunity to assess the overlapping and amplifying causal effects, which lead to the financial performance of the company. In this regard, the dynamic BSC can serve as a learning tool for managers and management accountants. With reference to the SERVQUAL-approach, only three of the five dimensions of service quality are considered explicitly within the dynamic BSC-model, that are assurance, tangibility and reliability (Parasuraman et al. 1985, 1988, 1991). Future research is needed to incorporate the dimensions of staff empathy and responsiveness into the model. In addition, the dynamic BSC represents just a conceptual framework, which has to be adjusted to firm-specific characteristics of the value creation process.
Supporting Causal-Oriented Performance Management by a Dynamized BSC
25
Appendix
Allocation Coefficient (points)
Average Excecution Time of the Service (%) (time) Average Time of Reasearch (time) Capital Cost Rate (MU/MU) Cost of Capital (MU) Cumulative EVA (MU) Customer Base (customers) Customer Potential (customers) Decrease of Employee Competence (points) Depreciation of IT (MU) Employee Skills (points) EVA (MU) Expected Service Quality (points) Increase in Time (time) Increase Investment Coefficient (%) Increase of Expectations (points) Indirect New Customers (customers) Investment Cost (MU) Investment Effect (points)
Investments in IT (MU)
Investments in Trainings (MU)
0.4+DELAY1( IF THEN ELSE(Table Employee Competence(Training Effect)-Table Employee Competence(Decrease of Employee Competence)=0, IF THEN ELSE(Allocation Coefficient>=0.5, Quality Investments·(1-Allocation Coefficient), Quality Investments·Allocation Coefficient), Quality Investments·(1+Allocation Coefficient)), Quality Investments·-Allocation Coefficient), Quality Investments·0.9),1,5000) DELAY FIXED(I F THEN ELSE(Allocation Coefficient>-1, IF THEN ELSE(Allocation Coefficient=-0.5, IF THEN ELSE(Allocation Coefficient>=0, IF THEN ELSE(Allocation Coefficient>=0.5, Quality Investments·Allocation Coefficient, Quality Investments(1- Allocation Coefficient)), Quality Investments·-Allocation Coefficient), Quality Investments·(1+Allocation Coefficient)), Quality Investments·0.1),1,5000)
Supporting Causal-Oriented Performance Management by a Dynamized BSC IT Assets (MU) IT Obsolescence (points)
Quality of IT Infrastructure (points) Lost Customers (%) Marketing Competitors (MU) Marketing Effect (points)
New Customers (customers) New Customers Marketing (customers) Next Purchase (time) NOPAT (MU) Number of Training Programs (number) Oscillation Business Cycle (%) Oscillation Market Potential (Turnover·Customers/Time)
Own Marketing (MU)
Perceived Service Quality (points) Percentage of Available Employees (%) Planning Coefficient Planning Coefficient Indirect New Customers (points) Planning Coefficient IT Planning Coefficient MC Planning Coefficient Training Cost Produced Service Quality (points) Quality Investments (MU) Quality of Advice (points) Relative Image Intensity (points) Requirement of Trainings (points) STEP Marketing (MU) STEP Marketing Competitors (MU) STEP Quality Investment (MU)
Table Available Employees (%)
26
INTEG(Investments in IT-Depreciation of IT,0) WITH LOOKUP(Quality of IT Infrastructure·Planning Coefficient IT, ,([(0,0)-(150,20)],(0,0),(41.2844,0.482456),(56.8807,1.49123), (65.1376,2.2807),(74.3119,3.50877),(80.7339,4.82456), (111.927,13.8596))) INTEG(DELAY1(Investment Effect/1-IT Obsolescence,6),35) DELAY1I( MAX(Table Lost Customers(Perceived Service Quality) ·0.73,0),1,0.3) (Planning Coefficient of Marketing Competitors·Oscillation Market Potential)·(1+STEP Marketing Competitors) DELAY1I((100·EXP(-0.999^(Table Marketing(Own Marketing)1100))·Table Image(Relative Image Intensity)·10),4,75) Indirect New Customers+New Customers Marketing IF THEN ELSE(Customer Base