Apr 22, 2013 - The device also broadcasts its MAC address, a globally unique identifier ... Various sources of Wi-Fi related potential for privacy loss have been ...
Linking wireless devices using information contained in Wi-Fi probe requests Mathieu Cunche, Mohamed Ali Kaafar, Roksana Boreli
To cite this version: Mathieu Cunche, Mohamed Ali Kaafar, Roksana Boreli. Linking wireless devices using information contained in Wi-Fi probe requests. Pervasive and Mobile Computing, Elsevier, 2013, .
HAL Id: hal-00816374 https://hal.inria.fr/hal-00816374 Submitted on 22 Apr 2013
HAL is a multi-disciplinary open access archive for the deposit and dissemination of scientific research documents, whether they are published or not. The documents may come from teaching and research institutions in France or abroad, or from public or private research centers.
L’archive ouverte pluridisciplinaire HAL, est destinée au dépôt et à la diffusion de documents scientifiques de niveau recherche, publiés ou non, émanant des établissements d’enseignement et de recherche français ou étrangers, des laboratoires publics ou privés.
Linking Wireless Devices Using Information Contained in Wi-Fi Probe Requests Mathieu Cunche† , Mohamed-Ali Kaafar∗† , Roksana Boreli∗ † INRIA
Rhˆ one-Alpes Grenoble France ∗ National ICT Australia
Abstract Active service discovery in Wi-Fi involves wireless stations broadcasting their Wi-Fi fingerprint, i.e. the SSIDs of their preferred wireless networks. The content of those Wi-Fi fingerprints can reveal different types of information about the owner. We focus on the relation between the fingerprints and the links between the owners. Our hypothesis is that social links between devices owners can be identified by exploiting the information contained in the fingerprint. More specifically we propose to consider the similarity between fingerprints as a metric, with the underlying idea: similar fingerprints are likely to be linked. We first study the performances of several similarity metrics on a controlled dataset and then apply the designed classifier to a dataset collected in the wild. Finally we discuss potential countermeasures and propose a new one based on geolocation. This study is based on a dataset collected in Sydney, Australia, composed of fingerprints belonging to more than 8000 devices. Key words: Link prediction, Privacy, Social matching systems, Wi-Fi, IEEE 802.11
1
Introduction
The huge popularity of mobile and portable wireless devices, including smart phones, tablets and laptops, has further increased the widespread of one of the most used wireless technologies, IEEE 802.11 or Wi-Fi. Included in over a billion of mobile and portable devices in use worldwide, Wi-Fi is provided by Access Points (AP) from a vast majority of homes in the developed and developing world, businesses and by around 750,000 worldwide hotspots. The extensive availability of Wi-Fi connectivity, together with a growing popularity of community networks, has resulted in mobile and portable devices establishing connections to an increasingly large number of APs in various locations. Preprint submitted to Elsevier
17 January 2013
The open nature of Wi-Fi connectivity has raised a number of privacy concerns in both the media and research literature [11,14,7], including the well publicized Google Street View collection of traffic from home Wi-Fi APs. Mobile and portable devices are likely to move across the coverage areas of different APs, e.g. while a person is travelling between home and work. In this likely scenario, low-latency service discovery is a highly desirable feature, as it will maximize the amount of connection time for such devices. We note that the Wi-Fi passive discovery mode, in which the AP periodically sends beacons announcing the AP’s Service Set IDentifier (SSID), and where devices listening to these probes select the desired specific SSID, can lead to high discovery delays. In the active discovery mode, the device periodically and actively probes the neighborhood for known APs. This mode, which is supported by operating systems and Wi-Fi chipset drivers on the majority of devices and often activated by default, allows a much lower discovery delay. However, the active discovery mode also raises privacy concerns. Indeed, while in active discovery mode, the mobile or portable device is periodically broadcasting, in the clear, the SSIDs of the APs to which this device has previously been connected to. The device also broadcasts its MAC address, a globally unique identifier. As a consequence, the device is not only advertising its presence to any eavesdropping equipment, but, as an associated issue, this also makes the owner vulnerable to location tracking and possibly profiling attacks. In this paper, we introduce and study a new privacy threat caused by the Wi-Fi active discovery mode, that is the possibility to infer a relation between devices (and hence the owners of these devices) based on their device’s “publicly” announced preferred networks. We refer to the list of preferred networks stored on a device, either partially or globally collected by monitoring wireless probes, as a device Wi-Fi fingerprint. Various sources of Wi-Fi related potential for privacy loss have been addressed in the research literature. The timing pattern of the probe messages can be used to identify the wireless interface’s driver[6], or to create a unique device identifier[4]. Our work considers the list of preferred networks as the fingerprint, rather than the timing of probes. We use this fingerprint to link selected devices with similar fingerprints, with the aim of grouping devices and, by association, the owners of these devices. The SSID of the probed network can also reveal sensitive information about the user, as shown in [7,10,9]. In particular, SSIDs can reveal geographical location of users [13] when combined with specific databases containing APs’ location coordinates, like [1]. Our work is complimentary to the research showing how user location can be derived from AP locations, as e.g. users who are detected by our methodology as linked socially or professionally, may also reside in a similar location. This enables additional location detection of users 2
who have APs which may not be in publicly available data bases, or which do not have globally unique SSIDs. In regard of the various problems caused by the current probing process, a privacy preserving access-point discovery has been proposed by Lindqvist et. al [9]. In general, discovering links between any two devices is a challenging task. In [12] the geographical proximity sensing capabilities of bluetooth technology have been used to suggest potential friendship links between users. This approach relies on an always-on application running on the user’s phone, which constantly monitors surrounding bluetooth-enabled devices. In [5] friendship links are predicted using a large set of information collected from mobile phones. In both research works, discovering a relationship is seen from the perspective of one of the partners’, and assumes the collection of a sustainable amount of complete information both in terms of temporal data and number of attributes. In our case, the amount of information is quite limited and often partial (Wi-Fi fingerprints consist of small pieces of information, and the information is sparse). On the other hand, the datasets we consider are composed of a much larger set of samples, and thus contain much more possibilities, which in turn makes the task of linking the devices more challenging. We propose to exploit the device’s Wi-Fi fingerprint to group devices and the owners of those devices. The techniques presented hereafter are widely applicable to all devices that publicly expose the SSIDs to which they have been previously associated. Our purpose is to show that the evaluation of fingerprint similarity enables simple, yet efficient tracking and profiling of mobile devices users. In light of these findings, it is desirable that the research community investigates the capabilities and limits of these techniques. This will, in turn, allow for the design of appropriate countermeasures to protect users’ privacy. The contributions of this paper are manifold. First, we introduce the problem of linking devices relying on monitored wireless probes. This problem is, to the best of our knowledge, novel and has not been explored in the literature. Second, we consider and adapt several record linkage techniques as fingerprint similarity metrics, to build a classifier that, given two fingerprints, can determine with high accuracy whether the two devices belong to individuals with an established relationship. This tool, when used with suitable record linkage techniques, validates an intuitive observation: the two separate devices belonging to two socially linked individuals most likely share common SSIDs. However, only the existence of a large and/or rare overlap in SSIDs between the two fingerprints results in establishing the links between individuals with an established social relationship. These results are tested and validated on real world data. By passively monitoring broadcast Wi-Fi probes in the city of Sydney, Australia for a period of 100 days, we have collected fingerprints of more than 8K unique devices and more than 24K different SSIDs. Addi3
tionally, we have collected a control dataset comprising of device fingerprints representing 30 social relationships, which we use to validate the classifier. We then apply selected metrics to the public dataset and analyse the characteristics of the detected links. Finally, we introduce and examine the potential of several possible countermeasures that can be implemented to circumvent the privacy threat identified in this paper. We propose a geolocation-assisted service discovery that can be easily implemented at the level of users’ devices. We analyze our proposed solution and discuss some implementation details by considering the Android operating system as a use case. We envision several possible uses of these techniques, not all of them malicious. In particular, in cases of criminal investigations, where the Wi-Fi device fingerprint of a known suspect is collected. Forensics analysts can for instance, collect the fingerprints of users in the suspect’s neighborhood, and our classifier could allow them to distinguish if a set of individuals are likely to have a social relationship with the suspect. As a second use case, wireless service providers could gather valuable information across a specific geographical area to send extremely targeted advertisements to users they deem to be socially linked to their (known) customers. For example, when a group of people have been identified as linked through a friendship relation, the knowledge of a single individual’s age can allow the service provider to infer the whole group’s age category. This would enable very targeted and efficient ad campaigns. This paper extends a prior report [3] in many aspects. First, we provide a deeper analysis of the data collection process. We introduce practical challenges for Wi-Fi fingerprints collection, and describe the main characteristics of our collected data by analyzing for example the rate at which Wi-Fi fingerprints can be collected in practice and the time required to collect a full fingerprint from a device (Section 2.3). We also extend the analysis of the collected dataset (Section 3) by including a study of the uniqueness of the collected fingerprints (Section 3.1 ) as well as the devices’ vendor distribution amongst all the observed devices (Section 3.2). In addition, we propose in Section 6.2 new techniques that would help improve the link detection between wireless devices. Specifically, we discuss how leveraging potential ordered probe requests and the use of unique network identifiers can be used to establish relationship between Wi-Fi devices. Furthermore, we provide in Section 7 an extensive review of the possible countermeasures, and detail their feasibility, ease of adoption and impact on the Wi-Fi performance. Finally, we present a new technique which allows a privacy-preserving active service discovery in Section 7.1. The paper is organized as follows. In Section 2, we overview the related work, and present the background related to the IEEE 802.11 standard probe re4
quests, along with the details of our data collection. In Section 3 we present observations on the collected dataset. The feasibility of discovering links between devices based on their fingerprint is analyzed in Section 4. In Section 5 the proposed detection mechanism is applied to a wild dataset. We address potential limitations and enhancements of our linkage technique in Section 6. In Section 7, we overview of the possible countermeasures and propose another technique that diminishes the privacy threat. Finally, we conclude in Section 8.
2
Wi-Fi Service Discovery and Device Fingerprint Collection
In this section, we introduce the Wi-Fi service discovery and present the underlying mechanisms of the IEEE 802.11 protocol. We then describe the methodology we have used to collect the set of Wi-Fi fingerprints belonging to various Wi-Fi enabled devices and finally we present some observations on the collected dataset.
2.1 Wi-Fi Service Discovery The service discovery feature is a key element of the IEEE 802.11 standard family, which allows a Wi-Fi station to detect other stations and access points in range. The 802.11 standard implements two modes of service discovery. Passive service discovery: In passive mode, APs are advertising services to stations in range using beacons, which are broadcast periodically on the AP’s operating channels. Stations passively listen for these beacons, while switching through the set of possible channels. Depending on the frequency on which the beacons are transmitted, and the channel switching speed and strategy, the resulting lengthy discovery of an AP [8] may not be suitable for mobile devices. Active service discovery: In this mode, the wireless station actively searches for known APs by probing each channel. The probing consists of broadcasting probe request messages for known APs and then listening for probe response messages. The probe request messages are management frames defined by the 802.11 standard, which embed the SSID of the target AP. The probing is repeated on each channel until the station successfully associates to an AP. Compared to the passive mode, actively probing the network for known APs has the advantage of reducing potentially long service discovery delays. In5
deed, following a complete cycle through the channels, the wireless station is guaranteed to discover all the known APs in range. In addition, the active service discovery mode is required in the case of wireless networks with a hidden SSID. Hidden APs do not broadcast beacons, therefore passive service discovery cannot be used and active service discovery is the only viable alternative.
2.2 Wi-Fi Fingerprint of a Device We note that the active service discovery process is enabled on a large number of operating systems (e.g. iOS, Google Android, Windows). As a consequence, when the devices running those OSs are out of range of a known AP, they continuously broadcast probe request messages. The latter contain the MAC address of the device , and as such uniquely identify the device. While listening in to traffic containing these management frames (broadcasted in plain text), an eavesdropper can easily collect the set of announced SSIDs i.e. the Wi-Fi fingerprint and associate them with a specific device. In the following subsections, we present our experimentation approach and characteristics of the collected Wi-Fi fingerprints.
2.3 Fingerprint Collection For our dataset collection, we have used a netbook with a Wi-Fi interface set to monitoring mode 1 and a packet analysis tool to filter out the probe messages 2 . For each probe request, we record a time stamp, the source MAC address, the destination MAC address, and the content of the SSID field. As mentioned previously, in active probing mode, the probe requests are broadcasted. Notably, since the MAC address of the AP associated to the target SSID is not available, we cannot uniquely identify the AP to which the device has been previously associated. Indeed, the same SSID can simply be used by several APs, and the number of APs associated to an SSID ranges from one, e.g. a personal AP with a “unique” name such as the concatenation of the first bytes of the AP MAC address and the Internet service provider name, to several thousands of APs, default equipment SSIDs such as NETGEAR or common hotspot names such as BTOpenzone or McDonald’s FREE WiFi. Our study was conducted on two types of Wi-Fi fingerprint data sets. First, we collected fingerprints advertised by wireless devices in the city of Sydney, 1
We used the driver and software provided by the aircrack suite to monitor Wi-Fi frames. 2 We used tshark, the command-line version of wireshark.
6
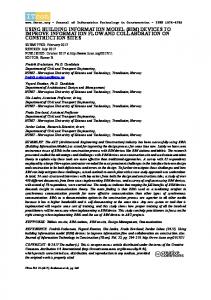
Australia over a period of 6 months. The monitoring (fingerprint collection) was performed by one of the authors, during the daily commute and various social activities. The collected dataset initially contained over 24000 unique devices and 30000 different advertised SSIDs and was first filtered to suit the purpose of this study. In this dataset a large fraction (more than 60%) of the devices had a fingerprint reduced to one SSID. As it is unlikely that a large number of devices have been associated to only one AP, we believe that there are additional reasons for the large number of such devices in our dataset. First, Wi-Fi channel conditions may prevent some of the probe requests to be correctly received by our monitoring equipment. Then, when a device is configured for hidden networks, active service discovery must be used for such networks, while passive discovery can be used for other configured APs. Hence, a device which may have a number of configured networks may in our dataset be associated with only the single (hidden) network SSID. Finally, the roaming functionality of 802.11 includes periodical broadcast of probe requests for the currently connected SSID, to evaluate the signal strength of an existing connection and, if appropriate, associate to an AP that has a higher signal strength. The roaming mechanism, as opposed to active service discovery, is enabled in all 802.11 stations and the roaming probe may have been recorded by our monitor, again resulting in records that include a device associated with a single SSID. Due to the number of potential issues that would result in incorrectly recording a single SSID as the device’s fingerprint, we filter out such data from our dataset and we base our study only on the devices with fingerprints with at least two SSIDs. After this filtering, the dataset still contained 8834 devices and 26262 SSIDs. This dataset is referred to as PubProbes. A second dataset has been collected from a set of volunteers, with known device MAC addresses, also by our monitoring devices. This dataset is composed of 30 fingerprint pairs with a well established and known (disclosed) underlying social link. This dataset is referred to as VolunteerProbes. During our fingerprint collection campaign, we have observed that the frequency at which the fingerprints are collected depends on the density of devices in the surrounding area, capturing up to several 10’s of devices per minute. Figure 1 presents an example of collection rate on a typical commute from home to work. Generally, on any device, probe requests with different SSIDs are transmitted in bursts 3 , the frequency of which depends on the OS and Wi-Fi chipset driver [6]. The interval between bursts typically varies between 3
Some devices also transmit ordered probe requests, which will will consider for a potential extension of the proposed technique in Section 6.1.
7
18
40 nb device per minute nb probe per minute
16
35 30
12
25
10 20 8 15
6
Nb probes/min
Nb device/min
14
10
4 2
5
0
0
09
09
09
08
08
08
08
08
08
0 :2
0 :1
0 :0
0 :5
0 :4
0 :3
0 :2
0 :1
0 :0
Time
● ●●
●
●
●
●
●
●
● ●● ● ●● ●
0.0
CDF
● ●●●●● ● ● ● ● ● ● ●
0.4
0.8
Fig. 1. The collection rate for devices and Wi-Fi probes, for a typical monitoring run.
0
1000
2000
3000
Delay (in second)
Fig. 2. CDF of the delay required to collect a full fingerprint.
50-60 seconds. Conservatively, being in range of any station for 60 seconds could be sufficient to collect the whole fingerprint of a device. It is important to note that due to potential loss of frames (e.g. when the quality of the channel is low), several bursts may be required to collect the complete set of SSIDs broadcast by a device. In addition, the probes may cease after the wireless station has associated with an AP. Therefore, monitoring may result in a partial fingerprint. Considering devices which have no current AP association, like the ones typically encountered when commuting (as is the case in our data collection), results in the best candidates to contribute to fingerprint data collection. Figure 2 depicts the cumulative distribution function of the time required to collect probe data (time duration between the first and the last unique SSID probe request collected for a single MAC address), which we consider to be full fingerprints for all the devices seen during a particular collection run. We observe that more than 70% of the fingerprints are collected within a second, which indicates that all the probes of the burst have been correctly received. For a vast majority of devices, the fingerprint collection needs less than 60 seconds, while for 10% of the observed devices, the first burst of probe 8
requests has been partially received, and more time and bursts were needed to collect the remaining SSIDs.
Observations on the Collected Dataset
0.8 CDF
●●●● ● ● ●●●
● ●●
●
●
●
●
0.4
●
● ●●● ●● ●● ● ● ● ● ●● ● ●● ● ● ● ● ● ● ● ● ● ● ● ● ● ● ● ● ● ● ● ●
0.0
0.4
● ●
0.0
CDF
●
●
●●●●●●●●●● ●● ●● ● ●● ● ●● ●● ●● ● ● ● ●
0.8
3
0
20
40
60
80
0
Fingerprint size
200
400
600
800
1000 1200
Nb device per ssid
(a) CDF of the fingerprint size.
(b) CDF of the number of devices per SSID.
Fig. 3. Cumulative distribution functions of the number of SSIDs per device and SSID popularity
Within the PubProbes dataset, the size of the fingerprints varies from one to 100 SSIDs, and has an average size of 5.34. Figure 3(a) shows the cumulative distribution of the number of SSIDs per fingerprint. We observe that a large majority of the fingerprints have a size lower than 20, while some fingerprints contain more than 80 SSIDs. Although the fingerprint size might have an impact on the similarity between the WiFi-fingerprints, we note that our intuition which considers similar fingerprints to carry social relationship information, heavily relies on the popularity (and rarity) of the SSIDs inside the fingerprint rather than the size of the latter. 3.1 SSID Popularity We analyze the popularity of SSIDs by examining in how many fingerprints an SSID may be found. Figure 3(b) shows the cumulative distribution of the number of devices whose fingerprints contain a particular SSID. We observe that a large fraction of the SSIDs are unique to a single device while on the other hand, a few very popular SSIDs are shared among a large number of devices. As a consequence of this SSID diversity, each device fingerprint might be unique, resulting in a unique identifier well suited for our purpose of evaluating the similarity between device fingerprints. Note that our observations are similar to the statistics reported in [13], where authors presented a dataset collected on a university campus. Figure 4(a) shows the fraction of devices associated to the most popular SSIDs. 9
14
80
12
70 Fraction of device (%)
Fraction of device (%)
11% of the devices’ Wi-Fi fingerprints comprise TOMIZONE @ Sydney Ferries. The latter is the most popular hotspot, as it is installed on board vessels operated by Sydney Ferries used in the regular commute during which the PubProbes dataset was collected. We note that 50% of the devices in our dataset connected to at least one of the 10 most popular APs.
10 8 6 4 2
60 50 40 30
g ot 54 p in ts lk Ho be go S in S Bo ELE IR i W ult D iF fa B W C _ de a e r t e ls Fr i Te n_ iF yd ree W us Sc EE e R l af C ide ’s F ria iw ld i_T un ona iF cD l_W M ai R re ity to es C S e rri pl Fe Ap ys y ne ks yd lin K N R S LI A D GE E @ ET N N IZO M TO
20 10 0
ny So on r te te Li k te pu em om G C y ke ve As Wa e ur Az ia ok N ung s m Sa er th O nn o xc Fo l te In TC
H
IM R e pl Ap
(a) Fraction of Wi-Fi fingerprints including a given SSID (only the top 15 SSIDs in PubProbes dataset).
(b) Distribution of interface vendor.
Fig. 4. Distribution of most popular SSIDs and presence of vendors interfaces.
3.2 Device Vendor Distribution Wi-Fi probe requests contain the MAC address of the source device, that reveals information about the device type. Using the Organizationally Unique Identifier (OUI) 4 we identified, for each device, the vendor of the wireless interface 5 . Figure 4(b) shows the distribution of vendors in the collected dataset. Each of the 11 most popular vendors is displayed as one category, while the rest of the vendors are grouped as Other. Note that less than 0.1% of the collected MAC addresses could not be resolved and appear as Unknown. This could result from fake MAC addresses, i.e. wireless interfaces that have their original MAC address modified by the operating system 6 or recently allocated MAC addresses that did not appear in our OUI table. The most common manufacturer in our dataset is Apple (77.11%), followed by RIM (7.07%), HTC (6.10%) and Intel (3.45%). The over-representation of Apple can be explained by the way that Apple’s operating systems handle the Wi-Fi service discovery. We have tested a number of mobile devices and found, for instance, that Android devices were not broadcasting any probe requests containing SSIDs in plaintext. On the other 4
http://www.iana.org/assignments/ethernet-numbers Since a company can be associated to multiple vendor names, we grouped the vendor names per company name. 6 possible cases of MAC address spoofing 5
10
hand, we found that the majority of the devices running iOS were using the active service discovery mode and broadcasting SSIDs in clear. Similarly, Linuxbased laptops do not expose SSIDs, while we found that most of the Windows and Apple laptops operate in the same way as the iOS mobile devices.
4
Linkability of the Devices
As outlined in the introduction, our interest is in measuring the similarity between the Wi-Fi fingerprints of various devices, which can in turn allow us to link the devices and the owners of these devices. Many well-known Record Linkage (RL) (alternatively, Entity Resolution) techniques have been successfully used to find records that may belong to the same entity in two or more databases. In RL terminology, two records that have been matched are said to be linked (we will use the same term throughout this work). To the best of our knowledge, the application of record linkage techniques to link Wi-Fi fingerprints is novel and it presents several challenges on its own. Information retrieval techniques typically measure distances between two documents (or a search query and a document), which are a set of words and thus need to be adapted for our purpose. Therefore, before presenting the study of fingerprint similarity in the wild, we start by studying the characteristics of fingerprint pairs with a known underlying link. For this purpose, we use ground truth evidence (the VolunteerProbes dataset) in which social links between devices’ holders are known.
4.1 The (VolunteerProbes) Dataset Characteristics We have collected the Wi-Fi fingerprints from a set of volunteers, along with the fingerprints of individuals with whom they maintain a strong social relationship (family members, close friends, flat mates). Once the VolunteerProbes dataset has been collected, all the devices pairs have been considered and categorized into two groups: those for which we verified that their owners are linked (we refer to this set as L for linked), and others for which we verified that their owners are not linked, referred to as N L for non linked group of device pairs. To assist with the analysis, we first define the frequency of an SSID z within a corpus, F, that is the ratio between the fingerprints X containing the SSID z∈X | . In z, over the total number of fingerprints in the corpus: F as fz = |X|F | our case, the corpus F is the set of total fingerprints from the PubProbes and VolunteerProbes datasets. The PubProbes dataset serves as a reference, since we can be confident that the SSID frequency estimation, although coarse, 11
Fraction of device pairs (%)
Fraction of device pairs (%)
100 L pairs 80 60 40 20 0 0
1
2
3
4
5
100
Intersection size
NL pairs 80 60 40 20 0 0
1
2
3
4
5
Intersection size
Fig. 5. Intersection size distribution for Wi-Fi fingerprints pairs collected from volunteers.
gives a stable frequency measure of the common SSIDs. Indeed, in fz we will measure the number of occurrences of SSIDs in the collected sample, and hence we are assigning maximum probability to the observed samples and zero to all the others. Since, as we will discuss next, we are interested in the rarity of SSIDs in intersections and it is highly likely that common SSIDs would be overrepresented in the PubProbes dataset, a simple frequency estimation as defined by fz can be used for this purpose. 4.2 Characteristics of Fingerprint Pairs Our approach determines the similarity between any two fingerprints primarily on the SSIDs they have in common, rather than on the semantic analysis of the Wi-Fi fingerprints. We focus on two aspects of the fingerprint intersections: the size and the rarity. The size of the intersection simply represents the number of SSIDs shared by the two fingerprints. The rarity of the intersection of any two fingerprints X and Y , denoted Rarity(X, Y ) hereafter, measures its uniqueness and is equal to the product of the frequency estimation of the elements in the intersection. The higher the rarity score, the more unique the intersection is. X
Rarity(X, Y ) = z∈X∩Y
− log fz if X ∩ Y 6= ∅ (1) 0
otherwise
where fz is the frequency of the element z. Figure 5 shows the distributions of the intersection for both sets L and N L of fingerprint pairs. In particular, we can clearly observe that the size of the intersection is at least equal to one for all pairs with an established social link, while it is empty for more than 90% of the pairs that are not linked. Put simply, Wi-Fi fingerprints of devices with owners who are socially linked are more 12
0.8 0.4
CDF
●
●
● ●
●
●
●
●
●
●
●
L pairs NL pairs
0.0
●
●
●
0
10
20
30
40
Intersection rarity
Fig. 6. Intersection rarity distribution for device pairs with and without social link.
likely to have a non-empty intersection. The size of the intersection seems to be the first discriminatory characteristic for the existence of a relation between devices holders. However, as illustrated by Figure 5, matching the intersection sizes, although the two distributions differ, does not always indicate that the two devices belong to socially linked individuals. The probability that two devices are linked should then depend on: (1) the size of the intersection between the two fingerprints; and (2) how likely is that intersection in the other samples. Figure 6 shows the cumulative distribution of the rarity for the Intersection sets of pairs (again for both L and N L). We observe that the linked pairs are characterized by the highest rarity scores whereas a large majority of the non linked pairs have a low score. In general, almost all the rarity scores of the “linked” fingerprints intersection (in L) are higher than the non linked devices rarity scores. This validates an intuitive observation: having a non empty intersection between two device fingerprints is not sufficient to consider a social link between the devices holders, as it should be necessary to include the rarity of the shared SSIDs. The underlying idea is that a common SSID does not provide much information on a potential social link between specific users. As shown in Section 2, some SSIDs might be shared by a large number of devices’ fingerprints, e.g. hotspots and redundant by-default SSIDs. 4.3 Similarity Metrics To infer a social link between two devices holders, we need to compare the similarity between two sets of SSIDs. In this paper, we consider a well known set of similarity metrics, used in record linkage related problems. The argument for using the theory and techniques utilised for information retrieval i.e. computing of document similarity, is that we can view the SSIDs as a collection of words. We have tested a number of similarity metrics and in this paper we present those that produce the best results, based on considering either the size or the rarity of the SSID intersection sets. 13
4.3.1 Jaccard Index The Jaccard index simply considers the similarity of two samples, as the ratio the ratio of the intersection’s cardinal by the union’s cardinal, i.e. J(X, Y ) = |X∩Y | . The Jaccard Index ranges from 0 (disjoints sets) to 1 (identical sets). |X∪Y | It only consider the intersection size and does not take into account the rarity of the elements in the intersection.
4.3.2 IDF Similarity In this case we use a well known information retrieval tool called TF-IDF. However, TF-IDF similarity measures the distance between two documents (or a search query and a document), which are set of words. We need to slightly alter the TF-IDF measure to apply it to Wi-Fi fingerprints instead. The term frequency-inverse document frequency (TF-IDF) is a weight used to evaluate how important is a word to a document that belongs to a corpus. The weight assigned to a word increases proportionally to the logarithm of the number of times the word appears in the corpus but the importance decreases for common words in the corpus. The TF-IDF of term i in document X is TF-IDF(X, i) = TFX,i .IDFi , where TFX,i is the term frequency of i in document X defined as TFX,i = |{t∈X:t=i}| |X| and IDFi is the inverse document frequency of the term i in the considered corpus. In our case the inverse document frequency is simply the logarithm of the SSID’s frequency inverse: IDFi = log f1i . The TF-IDF is often used to measure the similarity between two documents, in the following way: first the TF-IDF is computed over all the terms in the two documents, and the results are stored in two vectors; then the similarity between the two vectors is computed, for example using a cosine similarity measure. In our case, terms appear at most once in a fingerprint. Therefore, we replaced the term frequency component by a binary function: 1 if the fingerprint contains the term, 0 otherwise. The modified cosine similaritybased IDF is:
X
IDFx 2
Cosine-IDF(X, Y ) = s X x∈X∩Y s X IDFx 2 IDFy 2 x∈X
y∈Y
The Cosine-idf ranges from 0 (disjoints sets) to 1 (identical sets). 14
(2)
4.3.3 Adamic Similarity In [2], Adamic & Adar proposed a metric to estimate between personal pages similarities, and used this metric to infer social links. The Adamic metric takes into account the frequency of the pages elements by considering the logarithm of their frequency, as follows: Adamic(X, Y ) =
X
z∈X∩Y
1 log fz
(3)
where fz is the frequency of the element z. The Adamic metric ranges from 0 (disjoints sets) to a given maximum value depending on the considered corpus. Notably, this metric takes into account both the rarity and the size of the intersection.
4.3.4 Modified Adamic Similarity Since the Adamic metric considers the logarithm of the element’s frequency, it naturally tends to reduce the impact of the rarest elements. We argue that the rarest elements, i.e. those shared by only two fingerprints, are actually those containing the more information about a potential link. In order to strengthen the similarity metric, we propose to modify the Adamic metric by replacing the logarithm of the frequency by a power of the frequency. Using a power of the frequency instead of a logarithm-based value will strengthen the importance of the rarest SSIDs among the sample. Our modified Adamic similarity, called Psim-q, is as follows:
Psim-q(X, Y ) =
X
z∈X∩Y
1 fzq
(4)
where fz is the frequency of the element z, and q is the power considered. This metric ranges from 0 (disjoints sets) to a given maximum value depending on the considered corpus. Similarly to the original Adamic metric, the Psim-q metric takes into account both the rarity and the size of the intersection. Several values for q have been tried, and the best results were obtained for q = 3. Therefore, from now on, we will consider the metric Psim-3.
4.4 Evaluation Our goal is to assess how accurately Wi-Fi fingerprints can be used to link two different individuals. For this purpose, we build a classifier to separate the two sets L and N L, respectively of linked and non linked pairs of devices fingerprints. In order to fairly estimate the performance of the classifier, the 15
1 0.9 0.8 0.7 TPR
0.6 0.5 0.4 0.3 0.2
cosine_idf jaccard adamic Psim-3
0.1 0 0
0.1
0.2
0.3
0.4
0.5
0.6
0.7
0.8
0.9
1
FPR
Fig. 7. ROC curve of the classifier.
fingerprint pairs were separated, shuffled and a list of fingerprints derived from L and N L was constructed. The task of the classifier is to re-link the fingerprints in L maximizing the fingerprints couples correctly linked while linking as few incorrect couples as possible. In practice, for each possible couple in the list our classifier computed the similarity metrics and kept only the couples with highest similarity. If the fingerprints pair similarity value is above a threshold then the candidate couple is considered linked; otherwise it is nonlinked.
Classification Performance: Binary classifiers are primarily evaluated using the classical false/true positives/negatives indicators. We can consider our binary classifier as a simple hypothesis test where the classifier is a detection scheme that tests the following null hypothesis: The pair of devices corresponds to an underlying social link. Given a set of n pairs of devices, containing nP pairs with a social link (positive) and nN with no social link (negative). In our case, we are interested in finding fingerprint pairs that are actually linked (true positives which number is nT P ) while minimizing the number of pairs that are linked by mistake (false positives, which number is nF P ). In addition, let us consider nF N as the number of false negatives and nT N as the number of true negatives. The false positive rate (FPR) is the proportion of all devices do not corresponding to an underlying link that have FP . Similarly, been wrongly reported as positive by the test, so FPR = nF Pn+n TN the true positive rate (TPR) is the proportion of linked devices that have been TP rightly reported as such by the test, and we have TPR = nT Pn+n . FN To evaluate the efficiency of the classifier, we first plot in Figure 7, the ROC (Receiver Operation Characteristics) curves observed for different similarity metrics and several thresholds. These plots show, for each threshold, the point corresponding to the false positive rate along the x-axis and to the true positive rate along the y-axis, with one curve per similarity metric. Obviously, the 16
1
Cosine-IDF TPR Cosine-IDF FPR
Probability
Probability
1 0.8 0.6 0.4 0.2
0.8
Psim-3 TPR Psim-3 FPR
0.6 0.4 0.2 0
0
1
1 0.
01 0. 1 00 0. 01 00 0. 5 -0 1e 6 -0 1e 7 -0 1e 8 -0 1e 9 -0 1e
1
1 0.
01 0.
1 00 0.
Threshold
Threshold
Fig. 8. TPR and FPR as a function of the threshold for Cosine-IDF and Psim-3 metrics.
closer to the upper left corner of the graph a curve is, the better, since such points correspond to high true positive rates (i.e. a high proportion of positives being reported as such by the test) for low false positive rates (i.e. a small proportion of negatives incorrectly reported as positives). We observe that from this perspective Cosine-IDF and Psim-3 metrics outperform the other metric, offering excellent compromises between high true positive rates and law false positive rates. Since the Jaccard index does not take into account the rarity of the common SSIDs, and hence suggests that the rarity of the intersection is less important than its cardinal, with no surprise, we can verify that it performs less efficient results than other metrics. Comparing the results of the Adamic metric and our modified version, the Psim-q, we can observe that the change of weighting function, i.e. power of the frequency rather than a logarithmic function, has significantly improved the performances. Where the Adamic displayed poor performances, the Psim-3 performs as well as the two best metrics. Another interesting property of ROC curves is that they show the optimal range for the threshold. Indeed, as the slope of the ROC curve flattens, the increase in true positive rate is proportionally smaller than the corresponding increase in false positives. In other words, a lower threshold, although it always increases the true positive rate of the test, is not always productive as it eventually does more damage than good through increased false positive rates. In general, this means that the threshold of the similarity tests should be set to a value that yields a point in the “elbow” of the ROC curve. In practice, the choice of the threshold depends on the application of the classifier: one might favor detecting as much true positives as possible at the expense of a higher false positive rate; while in other cases, one might be interested in increasing the threshold so as to detect fewer true positives but minimizing the probability of mistakenly linking any two devices. We will now concentrate on the Cosine-IDF and Psim-3 metrics as both of them yield at least similar results than the other considered metrics. Figure 8 shows the true positive rates and false positive rates variation for various thresholds, respectively for the Psim-3 and Cosine-IDF metrics. As expected, a higher threshold results in a more aggressive classification test 17
that correctly classifies only a few of actually linked devices, but on the other end wrongly reports a tiny proportion of non linked devices. Our study focuses on a set of thresholds providing optimal performances. Social and professional graphs are rather sparse, i.e. the number of existing edges is much smaller than the number of potential edges. Therefore the number of false, i.e. vertex pairs not connected by an edge, will be much higher than the number of true, i.e. vertex pairs connected by an edge. Given the difference between the size of the positive and negative sets, we focus on thresholds with low corresponding FPR, namely F P R < 0.1. Even with this strict constraint, thresholds with high and medium TPR are possible. For instance, for the Psim-3 a threshold of t = 1.5710−5 leads to a TPR= 0.8 and FPR= 0.0772. Even if a part of the positive sets are missed, this will limit the number of false positive. In our use case example, the investigation of a criminal group, two cases may be possible: either the goal is to reduce the set of suspects to a more manageable size, or to use the result of the classifier as an evidence. In the first case, additional information may be available on the potential suspects, and could be be used to further refine the results returned by the classifier. Therefore having a high FPR may not be an issue. On the other hand, as missing positives is not acceptable, a high TPR should be targeted, e.g. by using Cosine-IDF with a threshold t = 0.0153, which results in T P R = 1 and F P R = 0.2446. In the second case, false positives are not acceptable, hence the FPR must be as small as possible. Therefore, a good threshold for the Cosine-IDF could be t = 0.188 which results in T P R = 0.5 and F P R = 0.
5
Linking Devices in the Wild
We apply the link detection scheme using the metrics defined in Section 4.4 to the public PubProbes dataset. This dataset is composed of more than 8K unique device identifiers, with collected fingerprints comprising of more than 26K distinct SSIDs. We note that, since this dataset consists of fingerprints collected in the wild, no information on the links between the devices is available. In the light of our results in Section 4.4, we will focus on two similarity metrics: Cosine-IDF and Psim-3. We consider three threshold values for each metric. The three thresholds have been selected respectively to yield (resp.) to values of F P R = 0, T P R = 1 and a desired trade-off between between FPR and TPR, from the results in Section 4.4. In the following, we analyze the characteristics of the resulting set of linked devices from the PubProbes dataset. We derive additional insights about the general applicability of the selected metrics. 18
Table 1 Selected threshold and associated number of pairs detected in the PubProbes dataset. Corresponding TPR and FPR on the controlled dataset.
Cosine-IDF
Psim-3
Thresh.
Nb. detected pairs
TPR7
FPR7
0.188
215 384
0.5
0
0.117
502 102
0.8
0.0300
0.0153
3 934 564
1
0.2446
0.162
408
0.1
0
1.57 10−5
88 476
0.8
0.0772
1.19 10−8
3 812 524
1
0.2618
5.1 Results
Table 1 summarizes the threshold values chosen for the Cosine-IDF and the Psim-3 metrics, with the corresponding FPR and TPR values as obtained for the VolunteerProbes dataset. Our classifier looks for potentially similar fingerprints based on the selected threshold. Table 1 shows the number of linked device pairs for both chosen metrics. The Cosine-IDF metric, independently from the used threshold, detects a relatively large number of device pairs, compared to the Psim-3 metric. We note a property of the Cosine-IDF metric, which may result in inconsistencies when attempting to detect links between devices in the wild. When two fingerprints are identical, the resulting similarity score is always the highest (i.e. equal to one), regardless of the size of the fingerprints and the frequency of those SSIDs in the corpus.On the other hand, we note that Psim-3 (and more generally Psim-q) is more sensitive to both the variations in the number of SSIDs shared between the two compared fingerprints and the rarity of those SSIDs. In particular, in case of identical fingerprints, the Psim-3 similarity score still depends on the frequency (rarity) and the number of the common SSIDs. Given the device pairs detected in PubProbes dataset, we further explore the underlying reasons why the devices have been linked. We now focus on the characteristics of the intersections of linked fingerprints. The rarity of SSIDs comprising these intersections is shown in Figure 9, while the size of intersections is shown in Figure 10. 7
The TPR and FPR in this table are those obtained with the VolunteerProbes dataset in Section 4. They do not imply related values on the PubProbes dataset.
19
●
●
●
● ●●●● ● ● ● ● ● ● ● ● ● ●● ● ●●●● ●●●● ●●● ● ● ● ●● ●●●● ●●●
●
● ● ● ● ● ●● ●● ●● ●● ● ● ● ● ●●
0.0 0
10
20
30
40
50
●
●
●
0.0
● ● ● ●
t=0.188 t=0.117 t=0.0153
0.4
●
CDF
0.8
● ●● ●●● ● ●●
● ● ● ● ● ● ● ● ● ● ● ● ● ● ● ●
0.4
CDF
0.8
●● ● ● ●● ● ● ● ● ● ● ● ●● ● ● ● ● ● ● ● ● ● ● ● ● ● ● ● ● ● ● ● ● ● ● ● ● ● ● ● ● ● ● ●
●
●
●
t=0.162 t=0.0000157 t=1.19*10^−8
●
60
0
20
Intersection rarity
40
60
80
Intersection rarity
(a) Cosine-IDF
(b) Psim-3
100 90 80 70 60 50 40 30 20 10 0
t=0.188 t=0.117 t=0.0153
0
1
2
3
4
5
6
7
Fraction (%)
Fraction (%)
Fig. 9. CDF of the Intersection rarity for device pairs detected in the PubProbes dataset for selected thresholds.
8
9 10
100 90 80 70 60 50 40 30 20 10 0
t=0.162 t=1.57e-05 t=1.19e-08
0
Intersection size
1
2
3
4
5
6
7
8
9 10
Intersection size
(a) Cosine-IDF
(b) Psim-3
Fig. 10. Intersection size for device pairs detected in the PubProbes dataset for selected thresholds.
We observe that for the Psim-3 metric, when the highest threshold is applied (curve labeled t = 0.162 in Figures 9 and 10), more than 60% of the intersections of linked devices fingerprints have their sizes larger than 2, while for the two lower thresholds (t = 1.71 10−4 and 1.19 10−8 ), the vast majority of the intersections are reduced to one SSID. In addition, these two lower thresholds result in a set of links in which a large majority of the intersection SSIDs have a rarity of less than 18. When applying the the highest threshold (t = 0.162), the majority of linked fingerprints possess rare SSIDs. For the Cosine-IDF, the thresholds variation seems to have a small impact on the rarity and the size of the intersections of linked fingerprints. Indeed for the three thresholds, almost all the intersections are reduced to only one SSID. The rarity for the two higher thresholds appear to be sensibly similar and in the three cases the majority of intersections has a rarity lower than 10. 5.2 Detecting Links from the VolunteerProbes Dataset Embedded in the PubProbes Dataset We now focus on a scenario where given a device and its fingerprint, we would like to detect the potentially linked devices from a large dataset. For this purpose, the VolunteerProbes dataset is embedded into the PubProbes dataset and 20
Table 2 Number of candidates for each device in the VolunteerProbes dataset when inserted in the PubProbes dataset.
Cosine-IDF
Psim-3
Thresh.
Average
Min
Max
0.188
34.025
0
142
0.117
80.65
2
307
0.0153
555.175
2
1411
0.162
0.475
0
2
1.57 10−5
28.125
0
238
1.19 10−8
437.425
2
1208
we apply the classifier (considering our chosen two metrics) to retrieve the links a priori known from the VolunteerProbes dataset established relationships. For each device in the VolunteerProbes dataset, we collect all the devices returned by the classifier as linked to the considered device. The number of returned candidates is considered as a performance metric as it quantifies how well the initial set, composed of more than 8000 devices, can be reduced to a more manageable size. Table 2 presents the average/min/max number of retrieved candidates for each threshold. Obviously, for both metrics decreasing the threshold value significantly increases the number of candidates. Again, depending on the application, one might favor detecting all the positives at the expense of false positives and a larger number of candidates. The Cosine-IDF returns much larger sets of candidates than the Psim-3. Focusing on the Psim-3 metric, we observe that the most restrictive threshold (t = 1.57 10−5 ) yields to 0.475 candidates in average and a maximum of 2. The candidates’ set is rather small, but the threshold is so high that it may miss some positives (in this case the TPR is only 0.1). For the intermediate threshold (t = 1.57 10−5 ) we observe that on average 28.125 candidates are returned, which represents 0.35% of the PubProbes dataset. For the lowest threshold (t = 1.19 10−8 ), the average number rises to 437.425, i.e. 5.4% of the full set. This last threshold yields a TPR of 1 on the VolunteerProbes dataset, but when it is applied to the PubProbes dataset it returned a large set of candidates.
6
Addressing Potential Limitations and Enhancements
The linked device pairs we used as ground truth have been collected from a set of volunteers devices. We have shown that, in this sample dataset, Wi-Fi 21
fingerprints can be used to infer the relationship between the devices owners. However, one might argue that this sample may not be sufficiently representative of the whole population. We tested our tool in linking devices of other unknown individuals with no a priori knowledge of any established relationship. This was due to the difficulty of gathering ground truth evidence. However, a more thorough analysis of the collected public Wi-Fi fingerprints is left for future work, to try to establish implicit relationship (e.g. based on semantic analysis of some SSIDs in the fingerprints). We note the importance of the corpus of fingerprints used for the link prediction. Considering the impracticality of collecting a corpus that includes the fingerprints of all the devices globally, in practice, the collected dataset should be representative of the studied population and large enough to ensure that the common SSIDs are recognized as such. Finding linked devices in a population requires time that is quadratic in the population size, as all possible pairs must be tested for similarity. This may be too costly if one has millions of devices to match. A solution to this problem is to divide the matching task in two phases. First, divide devices in clusters that are likely be linked. For example, one could choose devices that share at least one (even very popular) SSID, thus restricting the number of combinations that need to be tried. Second, test all possible combinations within a cluster. Finally, during our experiments, we noted that some operating systems broadcast the SSIDs in a meaningful order, which represents either the preferences of users or the most recent associations to the APs. Our technique could be improved by exploiting this additional information, as outlined in section 6.1. We also explore the potential for using unique network identifiers for improving the performance of the proposed linking technique in 6.2. 6.1 Ordered Probe Requests On some operating systems, the order in which the networks are probed will depend on the association history: from the most recently connected to the oldest. The observed association history could be used to improve our link detection mechanism. Indeed, the most recently used network would most likely be at the top of such an ordered list, while the less commonly used networks would be lower in the list. The similarity metrics presented in Section 4.3 could exploit this new dimension by adding a weight to each SSID depending on its position in the ordered list. By doing so, we would give more importance to the most recently used networks while reducing that of the oldest ones. There are a number of difficulties which could limit the utility of this approach. First, the connection history of a device is not stable in time, as it is modified 22
at each new association and can therefore change e.g. several times a day. Ideally, to obtain an homogeneous dataset, it would be necessary to obtain all the ordered Wi-Fi fingerprints in a short period of time. A large number of simultaneous monitoring devices would be required to achieve this, The second limitation comes from technical aspects of the data collection, that make collecting of ordered probes difficult. Indeed, due to channel overlap, probe requests coming from contiguous channels may be received; in addition, probe request may be lost due to lossy channel conditions. As a consequence, the order in which the probes are received by our monitor is likely to be different from the real order on the device. Note that these technical limitations could be overcome by using higher grade monitoring hardware.
6.2 Using Unique Network Identifiers
In this work, the APs were identified by their SSID, which is a non-unique identifier (i.e. some SSIDs are used by multiple APs). As a consequence, there is a number of commonly used SSIDs, which provide limited information for our linking mechanism. On the other hand, each access point can be uniquely identified through it’s BSSID, which is also the AP’s MAC address. Using Wi-Fi fingerprints consisting of such unique identifiers (in place of SSIDs) could be used to improve the performance of our scheme. Unfortunately, the probe requests used in this work do not include the BSSIDs of the probed AP. However, it has been noted 8 that upon connection to a network, some devices reveal the MAC addresses of the three last access points they have been connected to. This is caused by an optimisation of the ARP protocol implemented on iOS: in order to speed up the gateway discovery, the device sends ARP requests directed to the last three used gateways. By doing so, the device exposes a unique identifier for it’s recent connection history. This data may be easily collected from open public wireless networks. This variation of our scheme should improve the performance, although only for linking iOS devices (which, as seen in Figure 7, represent over 75% of the collected dataset) and requires additional monitoring of device communications at the time they are associating to a network.
7
Countermeasures: How to Avoid Device Linkage
Our technique relies on the ease with which wireless fingerprints can be collected, while relying on the active service discovery. Broadcasting SSIDs in 8
http://arstechnica.com/apple/2012/03/anatomy-of-an-iphone-leak/
23
plaintext results in a number of issues, as identified in [7,11,10]. Multiple solutions have been proposed to achieve privacy preserving service discovery, which we review in the following paragraphs. We then introduce a new Wi-Fi privacy preserving service discovery technique based on geolocation. Disabling service discovery: Having no active service discovery would solve the issues related to plaintext SSID broadcast, but would also reduce the performances of Wi-Fi communications. In addition active service discovery mode would still be required to connect to APs with a hidden SSID (see section 2.1). Reducing the scan frequency: Increasing the interval between probe requests would not resolve the issue, but it would increase the difficulty of Wi-Fi fingerprint collection and device tracking. However, the main advantage of active service discovery mode is to provide a faster service discovery compared to the passive mode; therefore reducing the probing frequency would reduce the benefits of the active mode and may totally negate it for the case of the scanning frequency being overly low. Blind probe requests: In Blind probe requests, the field reserved for the SSID contains an empty string. Any AP receiving such a request perceives it as a wild card, responding with a probe response. Although with this approach the wireless stations do not broadcast SSIDs and the contents of their Wi-Fi fingerprint remains private, however they are still vulnerable to tracking considering they broadcast packets containing a unique identifier (the MAC address). This solution includes another drawback, which is the inefficient use of wireless resources. Indeed, in this case the AP will respond to all probe requests emitted by the surrounding stations, rather than selectively responding only when a matching SSID is received. The overhead in communications has a potential to reduce the overall service quality for stations using Wi-Fi in areas with large numbers of stations and APs. Cryptographic obfuscation: Several privacy preserving service discovery schemes based on cryptographic primitives have been proposed. In Tryst Pang et al. propose a mechanism that relies on a trust relationship between devices and APs. A similar approach was introduced in in [9] and both solutions rely on using encrypted identifiers for APs and stations. These solutions, in isolation or combined, will achieve the goal of protecting users privacy by hiding the probed SSIDs as well as the device’s unique identifier. However they require software modifications in both APs and the devices. Even if those modifications are minor, their implementation on the already deployed devices (in particular APs) is a difficult task, which will hamper the adoption of such proposals. As an alternative to the existing solutions, we propose a new approach based on geolocation, which would only require simple 24
changes to the client (i.e. mobile device) software.
7.1 Geolocation Assisted Active Service Discovery Wi-Fi APs are generally static and have a range of under 100 meters, therefore each AP can be associated with a fixed coverage area. Our proposal relies on the stations having knowledge of their geographical position and links APs to specific geographical coordinates; using this information, a station would only probe for known APs which are in the immediate vicinity. This has multiple benefits: First, the station would only broadcast probe requests when it is in the vicinity of a known AP and hence reduce significantly the broadcast volume of its ID (the MAC address). Second, it would only broadcast SSIDs for APs that are geographically close, rather than the full list of configured SSIDs, therefore capturing the probe requests would provide limited information to a potential eavesdropper. To obtain a larger fingerprint of a device, an eavesdropper would need to be in range of the device every time it connects to a new network, requiring a significantly larger effort than what is currently the case. We have investigated the implementation of our proposal on the two most popular mobile operating systems: iOS and Android. On both systems, using the API available to the applications developer 9 is not sufficient to enable fine tuning of the Wi-Fi service discovery. Indeed, only a full scan can be triggered and it is not possible to select the network that should be either scanned or ignored. Modifying the behavior of the service discovery mode requires a modification of the operating system and the use of a rooted device. We describe the required modifications to the Android classes in order to implement our solution. The data structure associated with the Wi-Fi network is the WiFiConfiguration class. The first modification is to add a field related to geolocation, i.e. (longitude, latitude) to the existing network information consisting of SSID, pre-shared key, supported authentication etc. For an SSID which exists in multiple locations, a related list of locations could be allocated. Additionally, a modification in the method for creating and updating the WiFiConfiguration should also take into account the new field. I.e. each time a WiFi network is added, the current location of the device should be obtained 10 and added to the WiFiConfiguration. The second step includes modifying the network manager (Android NetworkManager class) to integrate the 9
Android API at http://developer.android.com/guide/components/ index.html and Apple developer tools at https://developer.apple.com/ technologies/tools/. 10 Current location can be obtained through the location manager http:// developer.android.com/reference/android/location/Location.html.
25
geographical context in the probing strategy. The enhanced scanning method would include a suitability check for including a specific network from the WiFiConfiguration in the list of networks to be probed, based on the distance between mobile’s current location and the previously recoded location of this network, dAP . Conservatively, we consider an AP to be in the vicinity of a mobile device, and then candidate for a probe request, if the calculated distance dAP is lower than two times the maximum range (here chosen as 100m). Optimizing the candidate selection mechanism is left for future studies. The availability of location information on smartphones and other mobile devices is widespread (using GPS, or mobile network based methods) and indeed due to their high mobility such devices benefit most from the active service discovery functionality. Therefore, geolocation-assisted active service discovery could be a practical way to provide this functionality to mobile devices, while preserving the privacy of their users. We note that the modification required to enable our proposal are by no means extensive and could be easily implemented in the future versions of the mobile operating systems.
8
Conclusion
We have presented a mechanism capable of detecting links between individuals, by exploiting the information broadcast in plaintext by their wireless devices. To the best of our knowledge this is the first use of wireless data to establish link between users. This work demonstrates yet another privacy breach allowed by the 802.11 probe requests, and this should further support the initiatives aiming at privacy preserving Access Point discovery [9]. Our proposed technique can be utilized as an additional tool when investigating real world crimes, for e.g. narrowing down a list of associates. It may however also be subject to abuse and could result in breaches of privacy. We proposed a simple and easy to implement geolocation-assisted service discovery that can drastically reduce the risks of revealing the history of the device’s connections, which allows to circumvent the privacy threat identified in this paper.
References [1] WiGLE: Wireless Geographic Logging Engine. http://wigle.net/, 2001. [2] Lada A. Adamic and Eytan Adar. Friends and Neighbors on the Web. SOCIAL NETWORKS, 25, 2001.
26
[3] Mathieu Cunche, Mohamed Ali Kaafar, and Roksana Boreli. I know who you will meet this evening! linking wireless devices using Wi-Fi probe requests. In 13th IEEE WoWMoM, San Francisco, June 2012. [4] Loh Chin Choong Desmond, Cho Chia Yuan, Tan Chung Pheng, and Ri Seng Lee. Identifying unique devices through wireless fingerprinting. In Proceedings of the first ACM conference on Wireless network security, WiSec ’08, 2008. [5] Nathan Eagle, Alex Sandy Pentland, and David Lazer. Inferring friendship network structure by using mobile phone data. Proceedings of the National Academy of Sciences of the United States of America, 106(36), 2009. [6] Jason Franklin, Damon McCoy, Parisa Tabriz, Vicentiu Neagoe, Jamie Van Randwyk, and Douglas Sicker. Passive data link layer 802.11 wireless device driver fingerprinting. In Proceedings of the 15th conference on USENIX Security Symposium - Volume 15, 2006. [7] Ben Greenstein, Ramakrishna Gummadi, Jeffrey Pang, Mike Y. Chen, Tadayoshi Kohno, Srinivasan Seshan, and David Wetherall. Can Ferris Bueller still have his day off? protecting privacy in the wireless era. In Proceedings of the 11th USENIX workshop on Hot topics in operating systems, 2007. [8] Glenn Judd and Peter Steenkiste. Fixing 802.11 access point selection. Computer Communication Review, 32(3):31, 2002. [9] Janne Lindqvist, Tuomas Aura, George Danezis, Teemu Koponen, Annu Myllyniemi, Jussi M¨aki, and Michael Roe. Privacy-preserving 802.11 accesspoint discovery. In Proceedings of the second ACM conference on Wireless network security, WiSec ’09, 2009. [10] J. Pang, B. Greenstein, D. McCoy, S. Seshan, and D. Wetherall. Tryst: The Case for Confidential Service Discovery. In Proceedings of HotNets, Atlanta, GA, November 2007. [11] Jeffrey Pang, Ben Greenstein, Ramakrishna Gummadi, Srinivasan Seshan, and David Wetherall. 802.11 user fingerprinting. In Proceedings of the 13th ACM international conference on Mobile computing and networking, MobiCom ’07, 2007. [12] Daniele Quercia and Licia Capra. Friendsensing: recommending friends using mobile phones. In Proceedings of the third ACM conference on Recommender systems. [13] Ian Rose and Matt Welsh. Mapping the urban wireless landscape with Argos. In Proceedings of the 8th ACM Conference on Embedded Networked Sensor Systems, SenSys ’10, 2010. [14] Fan Zhang, Wenbo He, Xue Liu, and Patrick G. Bridges. Inferring users’ online activities through traffic analysis. In Proceedings of the fourth ACM conference on Wireless network security, WiSec ’11, 2011.
27