JSS
Journal of Statistical Software February 2005, Volume 13, Issue 4.
http://www.jstatsoft.org/
Lisp-Stat to Java to R Balasubramanian Narasimhan Stanford University
Abstract This paper will describe my experiences in moving on from Lisp-Stat to Java to R. I was introduced to Lisp-Stat in 1989 and used it actively for teaching and research over the next 10 years. My use of Lisp-Stat culminated in a joint project with Hani Doss and I on Bayesian Sensitivity Analysis and it remains the largest piece of software I wrote using Lisp-Stat. At the time the project was completed, the only open statistical system that could deliver the goods was Lisp-Stat. In this article, I will describe how the power of Lisp, underlying statistical components and dynamic graphics were exploited in the project. When development on Lisp-Stat slowed down, Java was coming into its own as an important language and R became an open source collaborative project. Of course, I have moved on and I use R for most of my work today. I will touch upon with my experience with Java and R briefly.
Keywords: Lisp-Stat, Java, R, statistical computing, dynamic graphics.
1. Introduction When I was invited to participate in this special issue commemorating Lisp-Stat, my initial reaction was quite tepid. I did not think I would have much worthwhile to say that would add to what others already knew. Besides, R has now firmly established itself as a high-quality statistical computing environment and I, along with numerous others, have moved on to R. The pace of development of R and the associated packages is so rapid that I thought I would have to google my home directory to improve my Markovian memory to say anything of substance. However, I soon realized that although Lisp-Stat is not as popular as R, it still has a dedicated set of users and a number of substantial packages use it. Important packages like ViSta are still maintained. I also began to marvel at the kinds of facilities the system presented at the time. Indeed, they continue to be remarkable today, especially in the realm of dynamic graphics.
2
Lisp-Stat to Java to R
With those thoughts, I decided to discuss some of my work with Lisp-Stat, focus on some powerful aspects of the system and also provide a personal account of my experience. Therefore, some of the material in this paper should be regarded as very subjective opinion. This paper is organized as follows. Section 2 details my first introduction to Lisp-Stat. Section 3 describes some of the software I wrote using Lisp-Stat and details some educational uses I put it to. Sections 3.1 and 3.2 describe some larger pieces of software written in a research context with Hani Doss. Section 4 describes my experience with Java. Finally, section 5 concludes with some thoughts on R and Lisp-Stat.
2. Background I was a graduate student at Florida State University when Hani Doss, a new professor out of Stanford, announced that he was going to teach a special topics course. The topics he had in mind were quite eclectic and covered areas of theoretical, applied and computational statistics. The final test was to be a student presentation of an important paper in the area. Knowing my interest in computational statistics, Hani gave me Jerry Friedman’s JASA paper on Exploratory Projection Pursuit (see Friedman 1987). I believe I did a reasonable job earning an A. But after the course, Hani and I talked a lot about the computational issues and graphical issues raised in the paper. It was in this context that Hani recommended the Lisp-Stat book (Tierney 1990) to me. I immediately set about poring over the book. My programming knowledge was not particularly deep, but it was broad. I had written code in a number of other languages, including assembler, Fortran, C, Pascal and PL/1 (Subset G). But Lisp was completely new to me and I found the first four chapters very heavy going. I think I took almost three months to get by those chapters as I had to frequently refer back to things. (At that time, Lisp-Stat was available only for Macintoshes and Unix platforms and so I ran the examples on our department Sun server. Typing in code with vi was a pain; I don’t believe Emacs was installed on our department server.) It was when I hit Chapter 6 on Object-Oriented Programming that something clicked and I realized the power of the system. Object-oriented design had always lain dormant at the back of my head and I viewed regarded statistical models as objects that could be interrogated for various outputs. Here was a system that embodied that view precisely. After this revelation, it was quite a pleasant romp through the rest of the book. I graduated and as an assistant professor at University of Minnesota and at Penn State University, I used Lisp-Stat heavily in my teaching and research. Although S-PLUS was also available, the dynamic graphics capability of Lisp-Stat kept my curiosity and interest throughout.
3. Software My appointments were primarily in liberal arts campuses where teaching was a high priority and therefore it was natural for me to use Lisp-Stat to demonstrate concepts taught in class. Over the next several years, I wrote a number of pieces of software for educational purposes. These included demonstrations of central limit theorem, confidence intervals, probability distributions, bivariate normal distribution, Bertrand’s paradox, Gambler’s ruin, Markov Chains,
Journal of Statistical Software
3
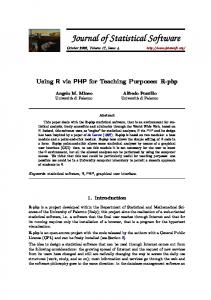
Figure 1: Markov Chains in Lisp-Stat Bernoulli Process approximation to Brownian motion, the alias method for generating discrete random variables Much of this code is available on the UCLA Lisp-Stat archive but I do confess to not being able to locate the code for the Walker’s Alias method. (I can make all the source code available to anyone who requests it). Several of these programs were written as Literate Programs using Noweb (Ramsey 1994). This was also a time of ferment in the WWW world and tools like hypertex, HyperDVI were becoming available. Some of my animations made use of them, e.g., the illustration of Bertrand’s paradox. Figure 1 shows a snapshot of the Markov Chain software that was written by an undergraduate student Brett MacAlpine as part of a project at the University of Minnesota, Morris under my direction. The process could be run for a user-specified number of time steps and a graphical view of the process was displayed. The current state was colored red. The process could be queried for its history, and clicking on any state would present the current visitation statistics for the state shown on the right. I used this tool to allow students to demonstrate several things including gambler’s ruin, the ergodicity theorem etc. Later, in the 1990’s, as a version for Windows was available and it became convenient to be able to send the students home with the code or tell them to install it on their own. Meanwhile, I was also using Lisp-Stat in research. I was interested in using modern computational tools for judging sensitivity of Bayesian analyses to changes in prior specification. I describe two applications below.
3.1. Bayesian Poisson regression In the Bayesian paradigm, there is an unknown parameter θ. One puts a prior distribution ν on θ. Data Y is observed, and the posterior distribution νY of θ given the data is computed. Unfortunately, the prior distribution ν that is put down is almost always only an approximation to the true opinion about θ, and therefore, the posterior νY is not an exact representation of the opinion that one has on θ after having seen the data. If the posterior does not change much when one changes the prior then one gets a feeling of reassurance—a
4
Lisp-Stat to Java to R
Figure 2: Bayesian Poisson Regression (Ship Data)
different investigator with a slightly different prior may not even bother to recompute the posterior for his prior. On the other hand, if the posterior changes significantly when one changes the prior, then it is important to record that fact, so that for example more time is spent on prior elicitation. Therefore, in almost any problem in which one carries out a serious data analysis, one wants to calculate the posterior distribution for a large number of prior distributions, especially in the exploratory stages of the analysis. Markov chain simulation had just become a hot computational method for obtaining posterior distributions. It is worth reading Tierney (1994) and Geyer (1992) for some good reviews. In a typical application the method would require non-negligible computer time to run a single chain. This meant that it would often preclude consideration of a large number of priors in the analysis. In a technical report (Doss and Narasimhan 1994), we introduced a computing environment within which one can interactively change the prior ν and immediately see the corresponding changes in the posterior νY . Although this environment was developed for the particular case of Bayesian Poisson regression, the programs were written explicitly so that they could be modified to handle a wide range of Bayesian problems requiring use of Markov chain simulation. The approach was based on an application of importance sampling. Suppose that one is interested in the class of priors νh , where h varies over the hyperparameter space R H. Suppose that we are interested not in the entire posterior νh,Y , but in the expectation t(θ) νh,Y (dθ), for some function t. For a particular value h0 , the Markov chain simulation method produces a sequence of random variables θ(1) , θ(2) , . . . , θ(G) with distribution approximately νh0 ,Y . The R P (g) expectation t(θ) νh0 ,Y (dθ) can be estimated by the average (1/G) G g=1 t(θ ).
Journal of Statistical Software
5
For a fixed value h0 of the hyperparameter, a Markov chain Markov chain corresponding to the prior νh0 , can be run producing θ(1) , . . . , θ(G) . Given h, a new hyperparameter value R (g) of interest, we can compute weights wh , g = 1, . . . , G and estimate t(θ) νh,Y (dθ) by the P (g) (g) (g) weighted average G g=1 wh t(θ ). The computation of the weights wh , which requires only knowledge of the sequence θ(g) , g = 1, . . . , G and of the two priors νh0 and νh , can be done rapidly enough fast to permit interactive exploration of the effect of changing the prior. In actual practice, the importance sampling method based on a single hyperparameter value h0 works well only for h close enough to h0 so that not just a few of the weights dominate the average. For this reason it is better to base the inference on the output of k Markov chains, corresponding to appropriately located hyperparameters h1 , . . . , hk . We used the method of reweighting mixtures described in a technical report by Geyer (1994). Figure 2 shows an example applied to data from McCullagh and Nelder (1989) on a study of wave damage to cargo ships. In order to set standards for hull construction, it was necessary to study the risk of damage associated with the three classifying factors: Ship Type (A–E), Year of Construction (1960–64, 1965–69, 1970–74, 1975–79) and Period of Operation (1960–74, 1975–79). The response variable is the number of damage incidents (the response variable), the level of the three classifying factors, and also the covariate “aggregate months of service,” which is an “offset” (i.e. the parameter corresponding to it is assumed known). McCullagh and Nelder fit the 9-parameter Poisson regression model with categorical predictors. The figure shows slides for changing the hyperparameters (the β mean and variance). Once a change occurs, the posterior densities are recomputed and displayed.
3.2. Bayesian survival analysis In another paper (Doss and Narasimhan 1998), we considered the following model for censored data. There are random variables X1 , . . . , Xn independently and identically distributed from some distribution function F . The Xi ’s are not necessarily observed. Rather, for each i, there is a set Ai within which Xi is known to lie. This framework includes several forms of censoring. Right censoring corresponds to the case where the sets Ai are either singletons or right-infinite intervals. Interval-censored data corresponds to the case where the sets are intervals, and current-status data corresponds to the case where each Ai is either a rightinfinite interval or a left-infinite interval. A Bayesian nonparametric approach based on mixtures of Dirichlet priors offers a reasonable compromise between purely parametric and purely nonparametric models. If ν is some prior distribution on Θ and Mθ > 0 for each θ, then if θ is chosen from ν, and then F is chosen from DMθ Hθ , the Dirichlet prior with parameter measure Mθ Hθ , we say that the prior on F is a mixture of Dirichlets (with parameter ({Mθ Hθ }θ∈Θ , ν)). Often Mθ ≡ M , i.e. the constants Mθ do not depend on θ. In this case, M can be interpreted as a precision parameter that indicates the degree of concentration of the prior on F around the parametric family {Hθ ; θ ∈ Θ}. For R example, as M → ∞ the distribution of F converges to Hθ ν(dθ), the standard Bayesian model for the parametric family {Hθ ; θ ∈ Θ} in which θ has prior ν. For the censored case, there is no closed form expression for the posterior distribution of F given the data, and one has to use Monte Carlo methods. Using the output runs of several Markov chains, we were able to present an interactive environment to see how the posteriors once again change when the priors are perturbed.
6
Lisp-Stat to Java to R
Figure 3 shows the results of applying the software to a dataset from Klein and Moeschberger (1997) on a retrospective study carried out to compare the cosmetic effects of radiotherapy alone versus radiotherapy and adjuvant chemotherapy on women with early breast cancer. This project shows that the combination of mathematics and computations can yield very powerful results: we were able to move from a nonparametric setting to a parametric one by just varying the hyperparameters and reweighting. Indeed, this is remarkably impressed upon the viewer when the precision parameter M is given extreme values. When M is large, one obtains estimates close to the Bayes estimators and when M is small, one obtains a nonparametric estimate. This can be seen in the plots of the survival curves which change their character in the latter situation resembling Kaplan-Meier type curves.
3.3. Summary Some key requirements in the projects described in sections 3.1 and 3.2 essentially dictated the use of Lisp-Stat. Dynamic Graphics It was necessary for us to have an environment that would allow us to dynamically display the changes in the posterior as the hyperparameters were varied. Very few systems that existed at the time (1987–1995) provided capabilities for dynamic graphics that ordinary users could exploit. Indeed, the situation is not very much different today. Lisp-Stat was, and still is, a superb environment for dynamic animations. Object Orientation The design of both projects called for object-oriented programming to ensure manageability and code correctness. The latter might seem like a strong statement in favor of OO, but it must be noted that we expected the software to be used in very general contexts and therefore, clear abstract design patterns were necessary. At least for my style of programming, such patterns find natural expression in an objectoriented paradigm. Both projects used a master-slave design and reused most of the methods of scatterplot-proto object. GUI As our intended audience was not expected to have knowledge of Lisp, we wished to limit the exposure to Lisp. The graphical user interface elements, dialogs were sufficiently flexible enough to build a simple GUI, at least for the specific problems the projects addressed. And this was on all platforms where Lisp-Stat was available! Dynamic Loading Like S-PLUS, the Lisp-Stat system allowed one to call arbitrary C and Fortran code from within Lisp, allowing one to speed up critical computations. In the early 1990’s, yet another performance tweak was introduced, that of allowing native C types to be stored directly (c-double type was one of them). This yielded some savings in overhead as passed arguments no longer needed to be copied. In our project, there were some very large arrays and so the savings were quite substantial. Statistical Tools There were several systems that provided the capabilities listed above, but not with some statistical programming support. The Lisp-Stat statistical functions allowed us to reuse rather than re-implement or rewrite algorithms. This is to be contrasted with my experience with Java discussed in section 4. Packaging Package facilities were added later in the development of Lisp-Stat. However, once they were added, they soon became indispensable. Both the projects above made
Journal of Statistical Software
Figure 3: Dynamic exploration of posteriors (Breast Cancer Data)
7
8
Lisp-Stat to Java to R heavy use and reuse of a core utility package that took care of all kinds of mundane details. Indeed, it is no surprise that the package NAMESPACE facility of R closely resembles that in Lisp-Stat. After all, Tierney wrote both.
The interactive nature of Lisp-Stat, like S-PLUS was, of course, a strength. Judging by the amount of space Tierney devoted to the first three issues above in his book— 156 pages, about 42% of the book to be precise—it seems reasonable to assume that these issues were dominant features of the system. Therefore, it is not entirely surprising that they figured so importantly in our projects; the system seemed tailor-made for such computations.
4. To Java Near the mid-90’s, development on the Lisp-Stat system was slowing down. GNU/Linux was becoming increasingly popular and I even wrote an article for Linux Journal on LispStat (Narasimhan 1995). Meanwhile, an exciting new technology called Java was taking the world by storm. It coincided with the growth of the internet and the world wide web. The language was exciting enough, allowing one, in theory, to write platform independent code. Java boasted a nice GUI and facilities for graphical primitives. In its initial release, it did not support IEEE arithmetic. However, to me, it seemed that this system was the future. The language was much like C with an object-oriented core and it was rather easy to program in it. The rise of the language coincided with my move to Stanford in 1996 and I was able to develop some educational applets for teaching purposes. However, writing these applets required me to reinvent many of the things I had taken for granted in Lisp-Stat; specifically, basic numerical routines had to be recoded. Here, the open-source nature of Lisp-Stat helped me out. I was able to lift sections of the C code from Lisp-Stat and massage it into a Java class for core statistical routines. Over the next two years I used this system heavily and distributed it widely over the net. However, there are far better designed Java class libraries today (Hoschek 2002) for numerics. This system served its purpose, enabling me to do dynamic graphics and some simple stuff, but to build it into a complete system was a rather daunting task. So I regard this phase of my forays into Java as an interesting experiment. Java is an important language and has a number of great packages that make it very powerful. But to use it in larger projects, I would have had to build something elaborate with it. At this time, the Omegahat project (see http://www.omegahat.org) was incubating and Java was used to prototype the Omegahat system. So I joined the group. Today, I use Java mostly for enhancing R code or as a front-end for running R code at the back-end of web services in combination with packages like RServ (Urbanek 2003).
5. To R and beyond In 1998, at the Interface meetings, I organized a session titled Developments in Free Software. This was, of course, to recognize that R had now become a highly successful open-source collaboration and was fast emerging as the statistical software to watch. R has only grown since then and is a great tool for all of us. There was much to like about R, not the least of which was garbage collection and better memory management than S-PLUS. Tierney had
Journal of Statistical Software
9
also joined R core and it was clear that development of Lisp-Stat had come to an end. I am pretty happy with the state of R and I am amazed at the pace of development. The R user base is growing and users actively participate by contributing packages. However, when I do meet up some old comrades in Lisp-Stat we often reminisce at the power that Lisp-Stat provided to us with joy. Even today, the dynamic graphics facilities in R are not as seamless as in Lisp-Stat: Tcl/TK, Java, can be used, but one is essentially programming in another language inside the R system. There are many details of R that are reminiscent of Lisp-Stat: the packaging system, NAMESPACE and garbage collection. Several of my friends have remarked that the lack of publishing quality graphics in Lisp-Stat did not help its popularity. That may be, but I also suspect that the Lisp language was not popular. The latter was exacerbated by the fact that there was only one book on Lisp-Stat, while the S language had several and some spoke the language of statisticians. Others have also mentioned that the lack of user-contributed code and packaging facilities figured as well. I disagree with the latter at least as a packaging mechanism was introduced in Lisp-Stat, around 1994, before R even became open source. Statistical computing is in great shape with high quality software like R. While Duncan Temple Lang has managed to embed Lisp-Stat within R (see the Omegahat web page), I doubt that this will revive the Lisp-Stat community in any way. I cannot resist adding that in preparing for this paper, I reran some of my old Lisp-Stat code of almost 10 years ago. I was quite surprised that everything still worked flawlessly, without modification on my latest GNU/Linux server. Perhaps I should not have been!
References Doss H, Narasimhan B (1998). “Dynamic Display of Changing Posterior in Bayesian Survival Analysis.” In P Muller, D Sinha, D Dey (eds.), “Practical Nonparametric and Semiparametric Bayesian Statistics,” pp. 63–87. Doss HJ, Narasimhan B (1994). “Bayesian Poisson Regression using the Gibbs Sampler: Sensitivity Analysis through Dynamic Graphics.” Technical report, Penn State Erie—The Behrend College. Friedman JH (1987). “Exploratory Projection Pursuit.” Journal of the American Statistical Association, 82, 249–266. Geyer CJ (1992). “Practical Markov Chain Monte Carlo.” Statistical Science, 7, 473–483. Hoschek W (2002). “The Colt Distribution.” Open Source Libraries for High Performance Scientific and Technical Computing in Java, URL http://www-itg.lbl.gov/~hoschek/ colt. Klein JP, Moeschberger ML (1997). Survival Analysis: Techniques for Censored and Truncated Data. Springer-Verlag. McCullagh P, Nelder JA (1989). Generalized Linear Models. Chapman & Hall, London, second edition.
10
Lisp-Stat to Java to R
Narasimhan B (1995). “Introduction to Lisp-Stat.” Linux Journal, 16. Ramsey N (1994). “Literate Programming Simplified.” IEEE Software, 11(5), 97–105. Tierney L (1990). Lisp-Stat: An Object-oriented Environment for Statistical Computing and Dynamic Graphics. Wiley. Tierney L (1994). “Markov Chains for Exploring Posterior Distributions.” The Annals of Statistics, 22, 1701–1728. Urbanek S (2003). “RServe.” URL http://www.rosuda.org.
Affiliation: Balasubramanian Narasimhan Department of Statistics and Department of Health Research and Policy Stanford University Stanford CA 94305, United States of America E-mail:
[email protected] URL: http://www-stat.stanford.edu/~naras/
Journal of Statistical Software February 2005, Volume 13, Issue 4. http://www.jstatsoft.org/
Submitted: 2004-05-25 Accepted: 2004-12-20