trigonometric functions based on? What do ... the application of this method in solving relevant mathematical problems, and points out the differences and sim-.
MATEC Web of Conferences 22 , 010 6 3 (2015) DOI: 10.1051/ m atec conf/ 201 5 2 2010 6 3 � C Owned by the authors, published by EDP Sciences, 2015
Literature Review of Applying Visual Method to Understand Mathematics Xiaojuan Yu Department of Mathematics and Finance, Yunyang Teachers’ College, Shiyan, Hubei, China
ABSTRACT: As a new method to understand mathematics, visualization offers a new way of understanding mathematical principles and phenomena via image thinking and geometric explanation. It aims to deepen the understanding of the nature of concepts or phenomena and enhance the cognitive ability of learners. This paper collates and summarizes the application of this visual method in the understanding of mathematics. It also makes a literature review of the existing research, especially with a visual demonstration of Euler’s formula, introduces the application of this method in solving relevant mathematical problems, and points out the differences and similarities between the visualization method and the numerical-graphic combination method, as well as matters needing attention for its application. Keywords:
visualization; Euler’s formula; geometric explanation; application
1 INTRODUCTION
from the view of math or physics? Can we use another way to understand mathematics, or is the derivation of Opening a modern mathematics book at random, what the theorem or formula directly perceived through the we often face are abstract demonstrations and massive process of the graphical display of visual language? symbols and reasoning. They are completely divorced The visualization method offers us a brand-new, from our experience of the real world, even though the visible way of argumentation for solving mathematical phenomena being studied in the book are usually dis- issues. It’s closer to the nature of problems than the covered through geometric intuition or from physical abstract symbols and reasoning and it’s more comphenomena [1]. This reflects the fact that over hun- prehensible and acceptable to students. dreds of years, mathematics has been described in a Visualization is an intuitive and easier graphic way way with too much abstraction and logic; while image of representing information and processing inforthinking and geometrical explanation have been ig- mation. Any complex thinking process, knowledge nored to an unnoticed corner. This is ironic just like a and the logical relationship between them can be incountry where reading is encouraged but conversation dicated by the way of illustration. When we state the is forbidden. The immediate consequence is that some facts related to the plain text, the visual information students are daunted or even frightened by these ab- will make our point more tightly-compressed, and its stract symbols and the tedious demonstration process, logical relationship will be presented more vivid, intuand gradually lose interest in learning mathematics, itive, quicker and easier to communicate than words. not to mention the creative development. This is the biggest advantage of visualization [3]. Felix Klein. , a famous mathematician who proObviously, the arrangement of the higher mathematics textbook mostly adopts deductive method to moted a way to describe the development and strucnarrate the definition theorem, formula, and the deri- ture of mathematics especially in his book “Elemen>�@ vation step by step. Although it is invulnerable in tary Mathematics from an Advanced Standpoint” , logic, some conclusions “are” still just accepted. which has emphases on the generation and developReaders do not have a real understanding of the con- ment of mathematical concept, the interrelation of text and meaning. Take “theory of complex function” mathematics branches and the intuition and connota[2] as an example, it introduced the plural index nota- tion behind the logical reasoning. [4] This is an external tion. First, in the first chapter, it writes “we derivate expression of visualization methods such as the fusion Euler’s formula as is well-known to all”, while the of the branches of mathematics, the mathematics and Euler’s formula appears in the textbook for the first other subjects, and the logical reasoning and intuitive time. Then it “suddenly appears” in the first and sec- speculation to “understand” the internal geometry ond chapters respectively. To understand them, read- connotation and physical meaning of mathematics ers firstly accept these conclusions logically, and then conclusion or principles. And the mathematics can be they will ask some questions inevitably after deep comprehended in a more multi-dimensional and multhought such as: How does Euler’s formula come from? ti-level way. What are the definition of exponential functions and trigonometric functions based on? What do they reveal
This is an Open Access article distributed under the terms of the Creative Commons Attribution License 4.0, which permits unrestricted use, distribution, and reproduction in any medium, provided the original work is properly cited.
Article available at http://www.matec-conferences.org or http://dx.doi.org/10.1051/matecconf/20152201063
MATEC Web of Conferences 2 LITERATURE REVIEW ON VISUALIZATION The concept of “Visualization” was firstly introduced by National Science Fund in the term of “Visualization in Scientific Computing” in February, 1987 to help human brain analyze and explain data through direct and visualized “general information”, and promote the summary and communication of scientific discoveries [5]. As an important method to understand complex phenomena and abstract concepts, visualization has an impact on people’s thinking from the perspective of cognitive science, and it’s more suitable for revealing the nature and changing rules. Since it’s firstly mentioned, visualization has been receiving wide range of attention. Foreign studies on understanding mathematics from the perspective of visualization have drawn the following main conclusions. Horganand Dreyfus (1993) believes that the visualization model could present the work undertaken by mathematicians. Barwise and Ethemendy find that when students are solving mathematical problems, visual thinking could be an available and effective resource that can open up a brand-new mode to work on mathematical issues. Dubinsky and Dautermann (1996) describe a model interwoven between visual strategies and analysis strategies and find that these strategies may be more effective when used together than alone [6]. Presmeg (1992) deems that the mode of representation, namely the visual-spatial mode, plays a key role in solving problems, because such presentation “abandons specific details and sketches out a pure relationship.” [7] Paul Vickers&Joe Faith used the tools of category theory to provide a general framework for understanding visualization in practice[8], Owen G. Scott have found greater demand for the professional use of visualization in the workplace, and the evaluation frameworks for effective visualization[9]. Delinda Van Garderen emphasized that using Visual-spatial representation can enhance the abilities of mathematical problem solving [10]. Domestic studies on using the visualization method for mathematical understanding and teaching start much later, most of which focus on the visualization process in combination with computer program and software application. For example, Cui Liping (2006) studies the application of visualization method to mathematics teaching through teaching exemplifications [6]. More researches focus on courseware design and software use [11]. Professor Peng Fanglin [12] (2005) writes the MATLAB solution and visualization for mathematical physical equations and presents complicated functions in images. There are some discussions about visual teaching cases in advanced mathematics, “Visual teaching cases can present abstract mathematical concepts, theorems, formulas and applications [13] with an intuitive and visual way” . Thus, the visualization method plays an immeasurable role in gaining mathematical knowledge, understanding mathematical principles, and developing and
displaying imagination and creativity. More discussions in this paper will orientate on the mathematical understanding through visualization from the perspective of thinking, so it would be more appropriate to call it a thinking of mathematical understanding. However, as a social ideology, thinking is more general and abstract, which is in conflict with the specific and visualized meaning of the concept of visualization itself. Therefore, we tend to understand visualization from the micro perspective and present it as a method to understand mathematics, which is of more universal applicability. 3 EXAMPLES OF APPLICATION OF VISUALIZATION METHOD A “demonstration of Euler’s formula” is shown as follows to illustrate the application of the visualization method. For Euler’s formula, scholars have given many methods on demonstration. For example, the formula is demonstrated from different angles by using different methods such as the complex exponential function defining method, the power series expansion method and the integral method and so on, they are mentioned in Reference
[14]
od in Reference
and by power series expansion meth[15]
. However, the closer scrutiny finds
that the theoretical bases of the above methods are untenable.
FRV [ �
first, or
One
H
L[
�H �
�L[
problem , VLQ [ � H
is L[
�H �L
H L[ � FRV [ � L VLQ [
whether �L[
comes
comes first.
Another problem is that questions about whether
H[
L�
power series expansion can be translated as H and what kind of hypotheses and premises they are based on for such analogy reasoning which is obviously not studied. However, only a demonstration from the angle of algebra is illustrated. In this paper, Tristan’s “visualization” method is introduced to demonstrate the Euler’s formula from the angles of particle motion and the power series expansion.
01063-p.2
ICETA 2015 3.1 Demonstrate the Euler’s formula from the angle of particle motion This demonstration is based on the following premises: (1) There is no knowledge about H L� . That is, we do not know that H L� is a point on a unit circle in a complex plane. (2) ] � � ] means to amplify Z’s module by ] � times and twist the argument by an angle of DUJ ] � . Note: Tristan defines this process as “amplitwist” transformation. The word “amplitwist” is a compound word formed by taking parts respectively from the two words “amplification” and “twist”. N[ (3) Following GH � NH [ , we can define
G[
GH LW � LH LW without considering the meaning of GW
H LW . Imagine that a particle motions along a curve
/ in
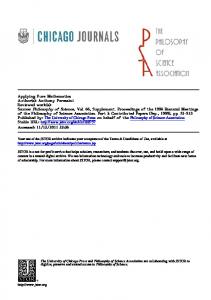
& , and arrives at the position of a complex number = �W at W moment, and then, its instantaneous velocity at moment is W G=�W =�W � �W � =�W 0 , as 9 �W � � OLP � OLP �W � � �W � � �W GW �W
shown in Figure 1:
�
unchanged module after turning �� C counter-clockwise; after a fraction of a second, this particle moves in this direction slightly, forming a right angle between the new speed and the new position. Thus, it can be seen that this particle moves on a unit circle. During the moving, it maintains
= �W � �
and runs a distance of
W
on the unit
circle at the moment, which means that
W
is the
argument of = �W � H . This is the geometric demonstration of the Euler’s formula. LW
3.2 Demonstrate the Euler’s formula from the angle of power series expansion The premises of this demonstration are shown as follows: [ (1)The known H ’s power series expression is shown as follows:
H[ � � � [ �
[� �
���
[Q �� Q�
,
[ 5 (1)
(2) To give meaning toH L� , we can assume:
H L� � � � L� �
�L� � �L� Q ��� � � (2) �� Q�
Now let us illustrate that the sum of series
� � L� �
�L� � �L� Q ��� �� Q� ��
L�
equals to H . In the expansion formula (2), we can see that every item is the result of its previous item
multiplied by
L� Q
. According to the amplitwist defi-
nition, the end of every vector rotates a right angle Figure 1. Particle’s Trajectory
anti-clockwise based on the last item as shown in Figure 2:
GH LW So, � LH LW means that from the initial poGW
� H � � � , the particle moves upvertically at the initial velocity 9 �� � L ,
sition at = ��
ward and then continues at the speed of 9 � L] with its
01063-p.3
MATEC Web of Conferences
Figure 2. Power series convergence process of complex exponential function
It can be seen from Figure 2 that every item in formula (2) will eventually converge on a point in the complex plane, but we do not know that this point is H L� . Now let us illustrate this H L� point from another perspective. Because
� � L� �
��
�� ��
�
�L� � �L� Q ��� �� �� Q�
�� ��
� � � L�� �
�� ��
�
=
�� ��
� �
FRV � � L VLQ � Given , I�� � FRV � � L VLQ � , it is easy to prove that I�� � � and DUJ I�� � � , which =
means that
I��
is a complex number whose
module is 1 and argument � in a complex plane, verifying the Euler’s formula
H L� � FRV � � L VLQ � . 4 FURTHER DISCUSSION ON THE VISUALIZATION METHOD It can be seen from the above reasoning process that a kind of complex information can be understood easily and quickly by means of Visualization, which is a compression language to focus on the important feature of information, and it can boost the graphical representation of human perception. In a nutshell, visualization is to convert data, information and knowledge into the visual representation and gain a deeper understanding of the data process [16]. When Visualization Method is applied to understand mathematics, the following are needed to pay attention to: (1) Make a distinction of “visualization method “and “numerical-graphic combination method”: the visualization method is similar to the well-known numerical-graphic combination method, both of which solve mathematical problems through the geometric approaches, the integrate abstract thinking and the image thinking, and display the complementary ad-
vantages of numerical-graphic information transformation and integration [17]. The difference is that numerical-graphic combination is often applied to static objects, such as solving the equation of intersection [ � � D[ � E by finding the point � between the parabola \ � [ and the line \ � D[ �� E ; �associating ] with distance; linking D � E with the Pythagorean� theorem; and associating the algebraic expression D or DE with the area of a rectangle and so on. All of which are concerned with constants. However, the visualization method tends to address some dynamic and changing problems. For example, the definition of the derivative describes the limit of the rate of change; the operation of complex numbers’ products or quotients itself is an “amplitwist” transformation; the Cauchy convergence theorem D Q � D P � depicts the phenomenon that the further the convergent D Q is, the closer it is crowded around a constant and so on. All of which are usually concerned with a variable and whose “image” is often a moving trajectory. In this sense, the visualization method is the summary and upgrade of the numerical-graphic combination method, and a new approach that interprets mathematical phenomena and principles is in a more direct and visual way. This is a mathematical method that mathematics learners and disseminators should keep on researching and applying. (2) Visualization method not only can be used for the understanding of some knowledge, but also for the comprehension of associated chapters, branches and other related knowledge. To build a structure or a mind map is a common practice. Research shows that, in the form of chart content, students can get more profound comprehension among things, concepts, knowledge, and the relationship and logic sequence between problem and action than a description of the language [18]. As a Visual thinking tool, the Concept map plays an important role in promoting learners’ meaningful learning and knowledge construction through connection of graphical symbols related to the intelligence [19], and the cognitive model of understanding information and knowledge was created. (3) Visualization does not mean that we must use geometric graph or chart and so on. From the traditional methods to visualization method, the transform of thinking paradigm should be emphasized, which aims to deepen the understanding of the nature of concepts or phenomena and enhance the cognitive ability of learners.
For example, given ] know DUJ Solution
].
�
� �L , we want to ��L I:
� �L � � � L �� � L � � � � � � � � � L ] � � � ��L � � So
01063-p.4
ICETA 2015
DUJ ] � DUFWDQ
� � � � � � � �
Solution
II: �
] �
�H � �
�H
DUJ ] �
� DUFWDQ�� �
L
��
�
� �
�H ��
�
because L
,
so
L
� � ��
Obviously, solution II is based on visualization methods and vividly expresses a principle: The argument of the division of “two plural” is the difference of their arguments, which is closer to the essence of questions. It is suggested that teachers should introduce the concepts in a variety of ways including use graphic meaning or non-abstract language and improve assessment methods to enhance students’ conceptual understanding [20]ˊ (4) Through using visualization methods, on one hand, learners may be required to be multidisciplinary and know correlation between mathematics and physics, algebra and geometry, elementary mathematics and advanced mathematics. On the other hand, some concept such as theorem or formula can be directly understood by logically deducing or abstract thinking. In this case, it is not necessary to explore its geometrical or physical connotation for the visualization methods will lose its significance. 5 CONCLUSION To sum up, visualization is a new mode to understand and interpret mathematical information, such as the mathematical proposition, concept, theorem, and so on. They are intuitive, image, natural and using explanatory language rather than abstract and procedural language. Take advantage of this representation, things’ nature will be revealed, and efficiency of learning will be better. REFERENCES
[6] Cui Liping, M.D. 2006. Visualization in Mathematical Teaching and Some Paradigms, Shanghai: Shanghai Normal University. pp: 2-4. [7] Presmeg, N.C. 1986. Visualization and mathematical giftedness, Educational Studies in Mathematics. [8] Paul Vickers, Joe Faith, and Nick Rossiter. 2013. Understanding Visualization: A Formal Approach Using Category Theory and Semiotics. IEEE Transactions on Visualization and Computer Graphics, 6. [9] Owen, G. Scott. 2013. How visualization courses have changed over the past 10 years. IEEE. Computer Graphics and Applications, 33(4). [10] Delinda Van Garderen & Marjorie Montague, Visual-spatial representation, mathematical problem solving, and students of varying abilities, Learning Disabilities Research & Practice. [11] Yang Zezhong, Luo Ricai. 2001. Reforming the project of courseware to improve the effect of computer assisted mathematical function graphics instruction. Journal of Mathematics Education. 10(3). [12] Peng Fanglin. 2007. Multimedia applying in course of methods of mathematical physics. Physics. 36(2). [13] Liu Xiongwei, Li Jianping. 2012. Research and lementation of visual teaching cases in higher mathematics. China Educational Technique & Equipment, (30). [14] Li Jin. 2008. Demonstrations and applications of Euler’s formula in advanced mathematics. Journal of Hexi University, 5. [15] Zheng Yumin. 2011. On the cause of the Euler’s formula. Journal of Heilongjiang Vocational Institute of Ecological Engineering, 5. [16] Hong Wenxue, Wang Jinjia. 2010. Visualization and visualization analysis. Journal of Yanshan University, (3). [17] Zhang Xiong, Li Dehu. Mathematical Methodology and Problem-solving Research. Beijing: Higher Education Press. [18] Wang Tianrong, Xu Yi. 2010. Effective Learning Design-problem, Schema, and Information. Beijing: Education Science Press. [19] Xiong Pin, Hu Xiaoyong. 2005. Visual information framework of thinking---A new perspective on the research of concept map. Information Technology Education. [20] Gao Xuefen, Bao Jiansheng. 2013. Analysis on undergraduates’ understandings and cognitive manners of differential. Journal of Mathematics Education. (1): 40-42.
[1] Tristan Needham. Visual Complex Analysis. Oxford: Oxford University Press. pp: 2-3+8-13. [2] Zhong Yuquan. 2012. Complex Function Theory (Fourth edition). Beijing: Higher Education Press. pp: 10+58-61. [3] Li Mang, Cai Minjun. 2013. Visual LI teaching design method and application. Television Education Research. 3: 16-21 [4] Felix Klein. Elementary Mathematics from an Advanced Standpoint. Shanghai: Fudan University Press. [5] McCormick, B.h. DeFantim T.A & Brown, M.D. 1987’ Visualization in scientific computing: Definition, Domain, and recommendation’s, Computer Graphics.
01063-p.5