Journal of The Electrochemical Society, 157 共5兲 A582-A588 共2010兲
A582
0013-4651/2010/157共5兲/A582/7/$28.00 © The Electrochemical Society
Lithium Storage in Amorphous TiO2 Nanoparticles Wouter J. H. Borghols,a,b Dirk Lützenkirchen-Hecht,c Ullrich Haake,c Wingkee Chan,a Ugo Lafont,d Erik M. Kelder,d Ernst R. H. van Eck,e Arno P. M. Kentgens,e Fokko M. Mulder,a and Marnix Wagemakera,z a
RID, Faculty of Applied Sciences, Delft University of Technology, 2629JB Delft, The Netherlands Institut für Festkörperforschung, Forschungszentrum Jülich GmbH, Jülich Centre for Neutron Science at FRM II, 85747 Garching, Germany c Fachbereich C-Physik, Bergische Universität Wuppertal, D-42097 Wuppertal, Germany d DCT, Faculty of Applied Sciences, Delft University of Technology, 2628BL Delft, The Netherlands e Solid State NMR, Institute for Molecules and Materials, Radboud University Nijmegen, Toernooiveld 1, 6525 ED Nijmegen, The Netherlands b
Amorphous titanium oxide nanoparticles were prepared from titanium isopropoxide. In situ measurements reveal an extraordinary high capacity of 810 mAh/g on the first discharge. Upon cycling at a charge/discharge rate of 33.5 mA/g, this capacity gradually decreases to 200 mAh/g after 50 cycles. The origin of this fading was investigated using X-ray absorption spectroscopy and solid-state nuclear magnetic resonance. These measurements reveal that a large fraction of the total amount of the consumed Li atoms is due to the reaction of H2O/OH species adsorbed at the surface to Li2O, explaining the irreversible capacity loss. The reversible capacity of the bulk, leading to the Li0.5TiO2 composition, does not explain the relatively large reversible capacity, implying that part of Li2O at the TiO2 surface may be reversible. The high reversible capacity, also at large 共dis兲charge rates up to 3.35 A/g 共10C兲, makes this amorphous titanium oxide material suitable as a low cost electrode material in a high power battery. © 2010 The Electrochemical Society. 关DOI: 10.1149/1.3332806兴 All rights reserved. Manuscript submitted November 13, 2009; revised manuscript received January 26, 2010. Published April 7, 2010.
Electrochemical storage devices based upon lithium-ion technology have replaced earlier battery types in numerous applications, e.g., portable devices, mainly due to their high energy density, long cycle life, and their relatively low impact on the environment. If materials that support higher current densities during discharging and satisfy the safety issues concerned, Li-ion batteries would become available for heavy duty applications such as 共hybrid兲 electrical cars. A high power density requires both good ionic and electronic transport properties of the electrode materials. In many cases, the solid-state diffusion of Li ions through the electrode materials is several orders of magnitude smaller than in the electrolyte. Therefore, if the power density is to be improved, the electrode performance is to be investigated. In commercially available Li-ion batteries, the electrode material is dispersed in the electrolyte as microsized crystallites, which are capable of hosting the lithium ions inside their crystalline voids. By simply decreasing the size of these crystallites, the electrode–electrolyte interface is increased, whereas the diffusion length inside the electrode crystallite decreases. However, recent studies reveal a more complex behavior of nanosized Li insertion compounds in, e.g., TiO2 anatase,1-3 TiO2 rutile,4,5 or LixFePO4,6 showing distinct changes in electronic structure and ionic mobility upon downsizing to the nanodomain.7 Usually, these differences in electronic structure and ionic mobility between bulk and nanosized crystallites are ascribed to the relatively increased impact of surface phenomena.8-10 Between the crystalline structures anatase and rutile TiO2, similarities were observed in the physical behavior of the nanoscale compounds. Both reveal an increased Liion capacity compared to their microscale counterparts, which appears to be facilitated by an anomalous phase behavior that is induced by the nanoscale.2,5 The enhanced Li capacity of both structures is confirmed by electrochemical experiments, and, in addition, these studies suggest a decrease in Li-ion mobility because the capacity decreases as the dis共charge兲 rate increases.4,11 Several other polymorphs of TiO2 are also reported to store Li ions, such as hollandite,8 ramsdellite,9 TiO2共B兲,10 and amorphous TiO2,11 but the most abundant morphologies of anatase and rutile are the most widely studied materials. Here, we explore the lithium insertion and extraction in nanoscale amorphous TiO2. Aiming at a complete understanding, we
z
E-mail:
[email protected]
have, in addition to standard electrochemical 共dis兲charging, applied several microscopic and macroscopic probes including neutron diffraction 共ND兲, X-ray absorption spectroscopy 共XAS兲, 7Li nuclear magnetic resonance 共NMR兲, energy-dispersive spectroscopy 共EDS兲, and thermogravimetric analysis 共TGA兲. This has led to a consistent picture of the performance of this material revealing amorphous TiO2 as a very promising candidate for cheap, high power, and high capacity anodes in Li-ion batteries.
Methods Sample preparation.— Titanium isopropoxide, obtained from Aldrich, was mixed with demineralized water. The resulting white precipitate was filtered and subsequently washed with ethanol several times. This material is referred to as pristine amorphous TiO2 共PA-TiO2兲. This PA-TiO2 is left to dry inside a vacuum oven at 400 K for a week. This vacuum-dried TiO2 is referred to as VD-TiO2. The chemically lithiated amorphous sample was prepared by first dispersing the VD-TiO2 in hexane 共anhydrous 95 + %, Aldrich兲, after which an excess n-butyllithium 共1.6 M Aldrich兲12,13 was slowly added while stirring the mixture. This method allows insertion of lithium in a chemical way by an electrochemical driving force. To avoid lithium from reacting directly with air and moisture, the procedure was performed in a glove box under argon atmosphere having less than 1 ppm O2 and moisture, both responsible for the formation of Li2O, LiOH, Li carbonates, and Li nitrates14 as potential impurities. The resulting Li mole fraction inside the amorphous host was determined by wet chemical inductively coupled plasma 共ICP兲 spectroscopy, and the atomic percentages of Ti and O were obtained by EDS during transmission electron microscopy 共TEM兲 measurements 共Philips CM30T兲. The TGA data were recorded using a Perkin-Elmer TGA 7 thermogravimetric analyzer. Neutron Diffraction.— The room temperature ND measurements were performed at POLARIS and the medium resolution, high intensity time-of-flight diffractometer at the ISIS pulsed neutron source 共Rutherford Appleton Laboratory, U.K.兲. POLARIS is equipped with 434 detectors in 4 banks, covering angles between approximately 160° 共backward scattering兲 and 13° 共forward scattering兲. Both the pristine and lithiated samples were loaded in an argon atmosphere into airtight vanadium sample containers sealed with indium O-rings. The resulting ND patterns were refined using the
Downloaded 10 Aug 2011 to 131.180.130.114. Redistribution subject to ECS license or copyright; see http://www.ecsdl.org/terms_use.jsp
Journal of The Electrochemical Society, 157 共5兲 A582-A588 共2010兲
Electrochemistry.— Electrodes were prepared from a slurry of VD-TiO2, carbon black, and poly共vinylidene fluoride兲 with a composition of 70/20/10 wt % dispersed in n-methyl pyrrolidone and casted on an aluminum foil used as a current collector. Circular disks were punched out and placed in a coin cell with lithium as counter and reference electrodes. The electrolyte used was LiPF6 in ethylene carbonate 共EC兲/dimethyl carbonate 共DMC兲 共2:1兲. Charge/ discharge tests were performed with an MACCOR S4000 cycler. X-ray absorption.— The transmission mode experiments were performed at the X-ray undulator beamline BW1 and the bending magnet station E4 at the DORIS III storage ring at HASYLAB 共Hamburg, Germany兲, operating at a positron energy of 4.45 GeV with approximately 100–150 mA of stored current. A double-crystal monochromator with two flat Si共111兲 crystals was used. X-ray absorption near-end structure 共XANES兲 and extended X-ray absorption fine structure 共EXAFS兲 data were collected at the Ti K edge 共⬃4966 eV兲 at room temperature using N2-filled ionization chambers as detectors for the incoming and transmitted intensities. A Ti metal foil was simultaneously investigated in parallel to the actual sample for the calibration of the energy scale. Before the experiments, the air-sensitive samples were sealed in a sample carrier with 7.6 m Kapton foil windows within the glove box. Several Ti–O reference compounds with known structure and chemical valence such as TiO, Ti2O3, crystalline Li0.5TiO2, as well as anatase and rutile TiO2 were evaluated for comparison. Solid-state 7Li NMR spectroscopy.— The 7Li magic angle spinning 共MAS兲 NMR 共I = 3/2, 92.6% abundance兲 spectra were recorded on a Chemagnetics 600 Infinity 共B0 = 14.1 T兲 operating at 233.2 MHz. Each air-sensitive sample was first loaded in a vacuumdried Teflon tube and sealed with cyanic acrylate glue, after which this assembly was mounted into 3.2 mm airtight zirconium rotors. The MAS probe head achieved spinning speeds up to 18.5 kHz in a dry nitrogen atmosphere. Chemical shifts were referenced to a 0.1 M LiCl aqueous solution. The spectra were recorded after a 30° 共at 2rf兲 radio-frequency pulse applied with a recycle delay of 20 s. The 90° pulse length was 1.9 s. The T1 relaxation time was determined to be well below 2 s for all temperatures using a saturation recovery experiment. Therefore, a pulse delay of 10 s was sufficient for quantitative measurements.
100
a
Free H2O
Weight (%)
Rietveld method implemented in General Structure Analysis System 共GSAS兲.15 The d-spacing under consideration ranged from 0.3 to 4 Å.
A583
95 Coordinated H2O
90 OH at surface
85 400
600
800
1000
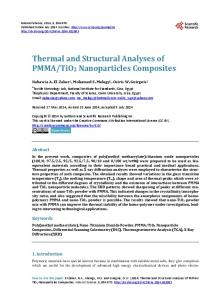
Temperature (K) Figure 1. TGA of the as synthesized amorphous TiO2 material.
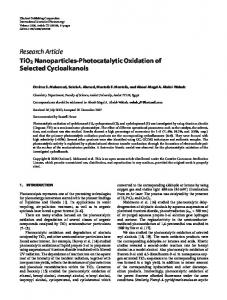
corresponds to a typical size of ⬃2.5 nm particles. Assuming the anatase structure and the normally most abundant 共101兲 surface orientation, this particle size implies that 54% of the Ti atoms are located near the particle surface. TEM also indicated a small amount of crystalline domains. The presence of crystalline phases was further investigated using X-ray and ND, the latter shown in Fig. 3 for both the VD-TiO2 and the lithiated VD-TiO2. The unlithiated material could be partially fitted with the anatase symmetry; however, other TiO2 phases or a combination of various TiO2 phases could not be excluded due to the large broadening of the reflections. No difference between the diffraction of the PA-TiO2 共not shown兲 and VD-TiO2 materials was detected, indicating that the crystalline fraction is formed during the synthesis, and no further crystallization occurs during the 400 K vacuum drying process. The large broadening and background confirm the TEM results that most of the material is amorphous with a minority of small crystalline domains, approximately 5%, assuming that all the background is due to the amorphous phase. Only small changes in the diffraction pattern occur upon lithiation, and the resulting pattern could be indexed and fitted reasonably well with the Li0.5TiO2 titanate, which forms from the lithiation of anatase TiO2.16,17 However, again, other phases can-
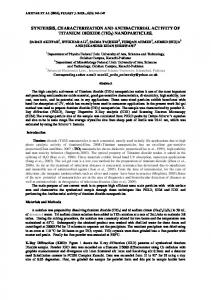
Neutron Diffraction, EDS, and TGA Nitrogen absorption experiments reveal a Brunauer, Emmett, and Teller 共BET兲 surface area of 598 m2 /g. The large surface area leads to significant OH and H2O adsorption at the TiO2 surface. For the as-prepared material 共PA-TiO2兲 TGA up to 1000 K measures a total weight loss of 15% 共see Fig. 1兲. Further experiments during this research were all performed on materials VD at 400 K 共VD-TiO2兲 because higher temperatures lead to crystallization into the anatase and eventually into the rutile structure. For these materials, the TGA results still imply a 13% weight loss due to H2O/OH species. This implies that the VD-TiO2 material contains approximately 0.75 H2O per TiO2 unit, most likely residing at the materials surface. The atomic composition of VD-TiO2 was investigated through EDS, which shows that the compound contains 3.5 ⫾ 0.5 oxygen atoms per titanium atom. This again points at H2O/OH adsorption at the surface of the amorphous TiO2 material, although it indicates more than 0.75 H2O per TiO2 unit. A structural investigation of VD-TiO2 has been performed by high resolution TEM, X-ray diffraction, and ND. From the TEM micrographs of VD-TiO2 共Fig. 2兲, the typical particle size of the powder was estimated to be around 2–3 nm. In line with that, if dense spherical particles are assumed, the 598 m2 /g BET surface
Figure 2. High resolution TEM micrograph of the VD-TiO2 amorphous material.
Downloaded 10 Aug 2011 to 131.180.130.114. Redistribution subject to ECS license or copyright; see http://www.ecsdl.org/terms_use.jsp
Journal of The Electrochemical Society, 157 共5兲 A582-A588 共2010兲
(004) (112) (103) (013)
(132) (017)
A584
(112) (004) (103)
(008) (215) (107) (220)
Intensity
Li2.4TiO2
TiO2 1.0
1.5
2.0
2.5
3.0
3.5
d-space [Å] Figure 3. ND patterns of VD-amorphous TiO2 共tick marks: TiO2 anatase, space group I41 /amd兲 and of the lithiated material 共tick marks: Li0.5TiO2, space group Imma兲.
not be excluded due to the large broadening of the reflections. Nevertheless, it appears reasonable to assume that at least a part, approximately 5%, of the crystalline domains has a structure similar to anatase TiO2. Electrochemistry The nanoscale or VD-TiO2 was 共dis兲charged between 2.5 and 0.8 V, as shown in Fig. 4a. Typically, in the crystalline TiO2 polymorphs, the maximum theoretical capacity is achieved when all possible crystal sites are occupied by Li ions. This situation is reached, having a composition of Li1TiO2 corresponding to a capacity of 335 mAh/g. In Fig. 4a, the galvanostatic test of VD-TiO2 does not present a well-defined two-phase plateau in the first discharge. In the anatase TiO2, this biphasic domain can be seen by the presence of a plateau around 1.78 V until a composition of Li0.5–0.6TiO2, both in micromaterials18 as in nanomaterials.19 In the first discharge in Fig. 4a, a small plateau at 1.78 V can be identified. The presence of this small plateau can be explained by a small percentage, roughly 9%,
x in LixTiO2 0.5
1.0
1.5
2.0
a
2.5
Voltage (V)
2.5
Capacity (mAh/g)
0.0
st
1 nd 2 3rd th 50
2.0 1.5 1.0 0
200
400
600
800
800
b
600
Charge Discharge
400 200 0 0
10
20
30
40
50
Cycles
Capacity (mAh/g) x in LixTiO2 0.0
0.2
0.4
0.6
Voltage (V)
0.8
1.0
c
2.5 2.0
1st 2nd 50th
1.5 1.0 0
100
200
300
Capacity (mAh/g)
Figure 4. 共a兲 The voltage profile of the test in galvanostatic mode 共constant current兲 at C/10 共33.5 mA/g兲. 共b兲 The degradation of capacity upon charge– discharge cycles. 共c兲 The rechargeability of the amorphous TiO2 electrode is investigated at a charge rate of 10C 共3.35 A/g兲.
of a crystalline phase present in the sample, which is also observed in the TEM measurements on VD-TiO2. Consistent with what was suggested by the diffraction in Fig. 3, this indicates a small fraction of anatase because this plateau ends at Li0.55TiO2, equal to the bulk anatase TiO2.18 Using a charge/discharge current of 33.5 mA/g 共C/10兲, VD-TiO2 exhibits a very high specific capacity of 810 mAh/g during the first discharge to 0.80 V. This electrochemically obtained capacity corresponds to an unusually high composition of Li2.4TiO2, which agrees closely with the ICP measurements on chemically lithiated particles. To our knowledge, it is the highest specific capacity presented for titania based material so far. However, this extraordinary high capacity is not reversible because this specific capacity dramatically drops to 400 and 350 mAh/g for the second and third discharges, respectively. After 50 cycles, the discharge capacity appears to stabilize around 200 mAh/g. An additional test was performed at a current rate of 3.35 A/g 共10C兲, which is shown in Fig. 4c. Despite the high current, the material reached a specific capacity of 270 mAh/g. This capacity drops to 195 mAh/g at the end of the second discharge and reaches the value of ⬃125 mAh/g after the 50th discharge. The test at 10C shows a reversibility of ⬃120 mAh/g, which can be considered to be quite high compared to nanoscale anatase19 and rutile,4 which, at these higher power densities, both reach roughly 95 mAh/g. A reversible capacity of 120 mAh/g at 10C is comparable to TiO2–B nanowires that show approximately 100 mAh/g 10 or TiO2–B nanotubes at 100 mAh/g,20 although both at a slightly lower rate of 6C. From the absence of distinct plateaus and the material’s ability to accept this relatively high current density, it may be concluded that the lithium insertion in amorphous TiO2 shows a typical solid solution behavior. In summary, in the cycling experiments in Fig. 4a, three regions can be distinguished. First, a 50% loss in capacity is observed between the first and second cycles. Second, a gradual decrease in capacity between the 2nd and 50th cycles are obtained, and third, a reversible capacity of 200 mAh/g from the 50th cycle has been achieved. The remainder of this paper aims at understanding the 共dis兲charge behavior in more detail using XAS and NMR. XAS The electronic structures of VD-TiO2 and chemically lithiated VD-TiO2 are investigated using the Ti K edge XAS. The edge shift shown in the XANES spectrum in Fig. 5a of the untreated VD-TiO2 compound is equal to the TiO2 reference compound. The presence of Ti4+ indicates the amorphous material to have a TiO2 composition. Therefore, the Ti/O ratio found by EDS, 1/共3.5 ⫾ 0.5兲, may indicate additional oxygen due to OH hydroxyl groups or H2O molecules. Upon Li insertion in VD-TiO2, the edge position shifts to a lower energy by about 1.8 eV. This shift has been determined by the relative change in position of the maximum in the derivative spectra. In the inset of Fig. 5a, the edge shift is compared to the well-known shifts of several other titanium oxide reference compounds. Because the valence of Ti is well known for these reference samples, the Ti valence in lithiated VD-TiO2 can be estimated from linear interpolation. This leads to a change in the Ti oxidation state from Ti4+ in VD-TiO2 toward Ti3.5+ in lithiated VD-TiO2, i.e., Li2.4TiO2. The change in Ti valence, as determined from the observed relative edge shift, implies that only a fraction of about 0.5 Li 2s charge compensating electrons per TiO2 formula unit influences the electronic properties at the Ti site, hence leading to a Li0.5TiO2 composition. This fraction agrees well with the fraction found in the 共dis兲charge measurements after the 50th cycle, i.e., the reversible part of the cycling measurements. However, the first cycle of VD-TiO2 revealed a fraction of 2.4 Li ions per TiO2 formula unit, agreeing well with ICP measurements on the chemically lithiated material. Bearing in mind the decrease in the Ti valence from Ti4+ to Ti3.5+, the comparison between the elec-
Downloaded 10 Aug 2011 to 131.180.130.114. Redistribution subject to ECS license or copyright; see http://www.ecsdl.org/terms_use.jsp
Journal of The Electrochemical Society, 157 共5兲 A582-A588 共2010兲 0.25
TiO2
Amorphous Li2.4TiO2
normalized µ (E)
4975 4980
Ti K-edge position (eV)
Li2.4 TiO2
4965 4970
Normalized µ(E)
a TiO2 Ti2 O3 TiO, TiH2
0
Ti-metal 1
2
3
4
Ti valency
4960 4970 4980 4990 5000 5010 5020
E (eV)
b
0.20 0.15 0.10 0.05
A2
A3
B TiO 2 anatase
A1
TiO 2 amorphous Li2.4TiO2 amorphous
0.00
4966 4968 4970 4972 4974 4976 4978
E (eV)
c
Oxygen
-3
|FT{χ(k )}|
Titanium
Li2.4 TiO2 amorphous
TiO2 amorphous
0
1
2
3
4
5
6
R (Å)
Figure 5. 共a兲 XAS spectra of both VD-TiO2 and lithiated VD-TiO2, i.e., Li2.4TiO2. The inset shows a linear relationship between the edge position and the Ti valence. For comparison, the edge positions of TiO2共Ti4+兲, Ti2O3共Ti3+兲, TiO共Ti2+兲, and Ti metal 共Ti0兲 are also indicated. 共b兲 Magnified view at the pre-edge features of VD-TiO2 compared to the features in microcrystalline anatase TiO2. 共c兲 Magnitude of the Fourier transform of the experimental data and the results of an EXAFS fit result for the first two atomic shells surrounding the Ti atom.
trochemical results and ICP vs XANES leads to the conclusion that only 0.5 Li ions per TiO2 unit out of the total 2.4 Li ions induce an electronic charge transfer toward the Ti atoms. Apparently, 1.9 Li ions 共per TiO2 unit兲 are stored in VD-TiO2, in such a way that the average Ti valence is not influenced. Figure 5b zooms in to the pre-edge features of the XAS spectra of VD-TiO2 and lithiated VD-TiO2. In Fig. 5b, TiO2 anatase has been plotted as a reference compound. All three spectra have been aligned at the onset of the first absorption 共⬃4967 eV兲. It is easily observed that the diversity of pre-edge features of anatase 共A1,2,3 and B兲 is more profound than in both VD-TiO2 and lithiated VD-TiO2, where at first glance, only a single absorption peak is observed. The physical reason for this is derived from the TiO6 octahedron, which is present in all crystalline TiO2 polymorphs, e.g., anatase, rutile, and brookite. In such an octahedral oxygen arrangement, the Ti 3d band is split into 3d-t2g and 3d-eg subbands due to the lowering in energy of the orbitals directed toward the oxygen atoms 共3d-t2g band, i.e., dxy, dyz, and dzx兲 compared to the nondirectional orbitals 共3d-eg band, i.e., dx2−y2 and dz2兲, a phenomenon referred to as “crystal-field splitting.” For example, in anatase TiO2, the A2,3 prepeaks at ⬃4971 eV can be ascribed to the excitation of a Ti 1s electron to nondirectional Ti 3d共eg兲 4s hybridized states. In both VD-TiO2 and lithiated VD-TiO2, this A2,3 prepeak is strongly amplified compared to the A1 and B peaks. This amplification of absorption peak A2,3 strongly resembles the augmented peak found in anatase TiO2 crystallites ⬃2 nm.21 In this research, the increase in the intensity of the A3 prepeak 共there, the A2 and A3 peaks are both called A2, although their A3 peak is called B in our case兲 was assumed to be caused by the deformed oxygen octahedrons from regular TiO6 to TiO5 where one O has become larger Ti–O distance and effectively disappeared. Such situation is encountered at the surface of small powder particles. In our experiments, the amorphous sample could have this type of distortion throughout the bulk, proving this to be a truly irregular structure. It was shown by Farges et al.22 that the coordination number of oxygen atoms surrounding the Ti atom is linearly correlated with both the pre-edge peak intensity and peak position of the A3 absorption. For example, the average relative pre-edge peak height for a fivefold coordinated Ti site is three times that of a sixfold oxygen surrounding. Compar-
A585
ing the anatase pre-edge features to our pristine 25 Å amorphous particles, the latter pre-edge peak is about 1.6 times that of anatase. From this, we may estimate that about 60% of all Ti atoms experience fivefold oxygen coordination. The valence of Ti is 4+ in both the anatase TiO6 octahedron and the distorted amorphous TiO5 structure. The relative height of the A2-3 prepeak of the lithiated amorphous sample compared to anatase is ⬃2.5, which indicates a fraction of 90% of all Ti atoms to be pentacoordinated with oxygen. A convincing argument for ascribing this reduction in coordination number to surface irregularities is given by Chen et al.21 In this study, the authors managed to saturate the initial fivefold oxygen coordination to a full octahedron by allowing ascorbic acid to absorb to the surface. As a result, they found the A3 prepeak to be lowered to the standard bulk anatase level because the initially shorter Ti v O double bond is broken and has reconnected with two hydroxyl oxygen atoms on the five member ring, forming two single Ti–O–共C兲 bonds. Upon increasing the coordination number of the Ti site from four to six oxygen atoms, the pre-edge intensity decreases and the energy of the peak increases by approximately 0.9 eV for each additional coordinating oxygen atom, starting from around 4969.6 eV for the tetrahedral Ti site. Our shift, as indicated by vertical lines in Fig. 5b, thus roughly corresponds to an oxygen coordination number of about 5.4. In Fig. 5c, the EXAFS features of the PA-TiO2 material are presented. Despite the absence of a well-defined crystalline symmetry in the amorphous material, some short-range ordering at the first and second atomic shells around titanium is expected. For this reason, the fit of the EXAFS spectrum has been performed by using TiO2 anatase as the fit starting model because the local ordering of amorphous TiO2 is similar to anatase.23 From the fit results, the first peak共s兲 are ascribed to the Ti–O bond, and the second peak is ascribed to Ti–Ti bond. In the PA sample, the first shell of oxygen atoms appears to have a coordination number of 5.4 ⫾ 0.4 in the best fit. The Li2.5TiO2 sample shows a reduced total of 5.0 ⫾ 0.4 oxygen coordination. Besides this lowering in oxygen coordination number, the distances between Ti and O appear to be distorted, as can be seen easily from the double peak arising in the oxygen EXAFS peak in the lithiated amorphous sample. Although the accuracy of this fit is quite poor in the absence of an amorphous model to fit these results to, it confirms the conclusions drawn from the pre-edge part of the XANES in the previous section, i.e., the presence of a reduced coordination number. In conclusion, the oxygen coordination numbers for both pristine and chemically lithiated amorphous samples have been determined to be roughly 5.4 for the pristine and 5.0 for the lithiated amorphous sample. Because the pre-edge features of the amorphous samples still show some intensity at the A1 prepeak, it is concluded that the overall TiO5.4 comprises well-defined TiO6 and TiO5 units, leading to 60% TiO5 and 40% TiO6 units. This agrees well with the modeled assumption of TiO6 in the bulk and TiO5 at the surface,24 whereas in our case, the approximately calculated 54% Ti atoms resides at the surface. The same reasoning applies for the lithiated sample, showing that all unit building blocks are TiO5. Obviously, the change in basic building blocks upon Li insertion has been determined from the altered electronic conditions, and it is not assumed that a large amount of oxygen atoms vanished from TiO2 toward Li2.4TiO2. The overall Li fraction in the maximum lithiated amorphous TiO2 structure is 2.4 Li/Ti; however, the edge shift indicates only a small fraction of 0.5 Li/Ti, which influences the Ti electronic structure. This corresponds to the reversible part in the electrochemistry. From XAS alone, we were not able to account for the remaining excess Li of 1.9 Li/Ti, although the degeneration of oxygen coordination may suggest a lithium–oxygen interaction at the surface. MAS Analysis In Fig. 6b, the temperature-dependent full MAS spectra of the fully lithiated material are shown, and in Fig. 6c, the center bands are shown. The center band reveals at least two Li environments, which at the highest temperature, can be fitted as follows 共shown in
Downloaded 10 Aug 2011 to 131.180.130.114. Redistribution subject to ECS license or copyright; see http://www.ecsdl.org/terms_use.jsp
Journal of The Electrochemical Society, 157 共5兲 A582-A588 共2010兲
A586
a
b Intensity (a.u.)
ln[1/T2 (s-1)]
10.5
10.4
10.3
10.2
2.1
453 K 413 K 373 K 333 K 293 K
2.4
2.7
3.0
3.3
100
3.6
0
-50
-100
d MAS data Fit result Li in Li0.5 TiO2 Li in Li2O
Intensity (a.u.)
c Intensity (a.u.)
50
Frequency (kHz)
1000/T (K-1)
453 K 413 K 373 K 333 K 293 K
6
4
2
0
Frequency (kHz)
-2
-4
3
2
1
0
-1
-2
-3
Frequency (kHz)
Figure 6. 共a兲 Arrhenius plot of the 7Li spin–spin relaxation time 共T2兲 for the maximum chemically lithiated amorphous LimaxTiO2. The data were acquired under nonspinning conditions 共Chemagnetics 600兲. 共b兲 Full MAS spectra of the maximum lithiated amorphous Li2.4TiO2 at different temperatures. 共c兲 Center band of the MAS spectra in 共a兲. 共d兲 Fit of the MAS center band at T = 413 K.
Fig. 6d兲; one that has a width of ⬃1.1 kHz 共4.5 ppm兲 and a position of ⬃0.55 kHz 共+2.3 ppm兲. This is not far from the values found for Li in 40 nm Li0.72TiO2 1 at room temperature and one broader signal at ⬃0 ppm with an intensity that is about 2.5 times stronger in the center band. These signals might therefore be interpreted as resulting from Li in the nanoscale TiO⬃2-like fraction and the Li2O-surface-like fraction of the material, where the intensity ratio is similar to what is discussed below in terms of the reversible respectively irreversible fraction of the stored Li in the material. NMR: The Li-Ion Mobility Inside the Amorphous TiO2 Host from T2 Relaxation Measurements The spontaneous mobility of the Li ions inside the TiO2 amorphous structure was probed with static 7Li NMR T2 relaxation measurements. The T2 relaxation time, a measure for the spin–spin interaction and spatial and temporal correlation, increases upon increasing Li-ion mobility through the lattice. The rise in T2 causes the resonance in the frequency domain to become narrower, an effect that is referred to as motional narrowing. In this way, the T2 relaxation time is a probe of the Li-ion mobility, and the knowledge of T2 vs temperature allows the determination of the 共self兲 diffusion coefficient and its activation energy, quantifying the time scale and the barrier for Li hopping, respectively, through the crystalline host lattice.25,26 If the mobility of the Li ions is assumed to be thermally activated, the spin–spin spatial correlation time obeys an Arrhenius law, c = ⬁ exp共EA /kBT兲, where EA is the activation energy of the jump process and 1/⬁ is the attempt frequency. From the increase in the T2 value vs temperature in the Arrhenius plot shown in Fig. 6a, the Li-ion movement indeed appears thermally activated. From the slope of the linear fit of the high-T regime in the Arrhenius plot the activation energy can be determined. The value of EA = 0.16 ⫾ 0.03 eV is fairly low, and it closely resembles the activation energy of lithium in the solid solution regime of bulk sized anatase 共0.20 ⫾ 0.01 eV兲.25
The XAS and MAS NMR results of the previous sections suggest more than one Li-ion environment in or at the surface of the amorphous structure, i.e., inserted Li ions influencing the Ti valence and the yet unidentified excess of 1.9 Li per formula unit. Although different Li environments would imply distinct T2 signals, only one was identified; the static T2 values in Fig. 6a are the result of fitting the T2 relaxation data with a single exponential decay. In the work of Strange et al.,27 T2 relaxation times for pure, crystalline Li2O are reported as ⬃40 s at 300–400 K. This value is close to the T2 value found here in the amorphous and nanostructured materials, and the same holds for the T2 value in Li titanate.1,25 Apparently, the T2 of the amorphous material, although representing two contributions of different Li environments, only leads to one experimental static T2 value. In both pure bulk Li2O and Li titanate, the mobility increases when raising the temperature, where Li titanate shows the larger mobility. In the amorphous sample, no difference can be detected in the T2 and hence the mobility of the different environments. This might be interpreted in several ways: The mobility is the same in different environments or there is an exchange in the T2 time scale between the different environments, which leads to averaging and apparently a single experimental T2. As can be expected from the time scale of the mobility at high temperatures, the mobility also has an effect on the MAS spectra in Fig. 6b: The sideband pattern becomes less wide, and the peaks broaden. An estimate of the microscopic diffusion coefficient D at room temperature has been determined with D = l2 /nc, where l is the length of an elementary jump between sites and n is the number of possible jumps to different neighboring sites. Both parameters l and n cannot be accurately determined in the absence of a clear defined structure in the amorphous materials. In anatase and rutile, where the basic building block of the structure is the oxygen octahedron, an equivalent Li site is found fourfold at about 3 Å. Although the XAS analysis indicates a deterioration of this sixfold oxygen coordination toward a fivefold, the length for Li hops is assumed to be the same. This should produce numbers that are relatively close to the true results. Then, the diffusion coefficient at room temperature results in D = 3.5 ⫻ 10−12 cm2 s−1. This is a relatively large diffusion coefficient, which, together with the nanoscale of the particles, can explain the relatively large reversible capacity found in the electrochemical tests performed at high charge rates 共10C兲 because a high Li-ion mobility supports a high charge rate. Discussion Electrochemical experiments at a charge rate of C/10 on nanoscale TiO2 amorphous 共2.5 nm兲 have revealed a very large capacity of 810 mAg/h during the first discharge, leading to a composition of Li2.4TiO2. Because this result is confirmed by ICP measurements in the chemically lithiated material, the large Li fraction appears independent of the insertion method. The second charge cycle in the electrochemistry already shows a decrease in this capacity by about 50%, and from the 2nd to the 50th cycles, the capacity is decreased by another 50% to leave a recyclable capacity of about 200 mAg/h. Compared to other nanosized titanium oxides such as rutile 共160 mAh/g兲,4 anatase 共190 mAh/g兲19 at the same charge rate of C/10, or TiO2–B nanowires 共180 mAh/g兲10 and nanotubes 共220 mAh/g兲20 C/7, a reversible capacity of 200 mAh/g found in nanotextured amorphous TiO2 is reasonably high. The observed drop in Ti valence from Ti4+ to Ti3.5+ in the XAS measurements indicates that only 0.5 Li per TiO2 is actually inserted in the host. This fraction of 0.5 Li per TiO2 is most likely responsible for the large part of the reversible capacity after the 50th cycle. The remaining 1.9 Li per TiO2 unit atoms is irreversibly lost after the first discharges. The reversible capacity is 200 mAh/g, whereas the capacity of 0.5 Li per TiO2 is only 130 mAh/g 共taking the H2O and OH content into account; see below兲. Hence, part of the reversible capacity must be due to some sort of surface reaction. The first option that should be considered is the irreversible capacity loss due
Downloaded 10 Aug 2011 to 131.180.130.114. Redistribution subject to ECS license or copyright; see http://www.ecsdl.org/terms_use.jsp
Journal of The Electrochemical Society, 157 共5兲 A582-A588 共2010兲 to solid electrolyte interphase 共SEI兲 formation. However, for similar large-area titanium oxides, SEI formation occurs around 0.8 V and is basically absent above 1 V.20,28 Therefore, we expect only a small fraction of the irreversible capacity to be due to SEI formation. Titanium dioxide surfaces are well known to adsorb H2O and OH both physically and chemically. Therefore, in particular, during the first cycles, Li ions may be expected to react with these adsorbed species to Li2O, which may be expected to be irreversible in the applied voltage window. The presence of Li2O indeed appears to be confirmed by the 7Li NMR experiments. Li2O is a good ionic conductor,29 and, therefore, it may not lead to a large barrier Li transport. The formation of Li2O at the TiO2 surface suggests that the H2O/OH groups present at the surface have their H replaced. In chemical lithiation with n-butyllithium, we propose the following reaction 共which is quite well known for butyllithium兲 TiO2共H2O兲x + 共0.5 + 2x兲LiC4H9共n-BuLi兲 → Li0.5TiO2 + xLi2O共surface兲 + 2xC4H10 + 0.5C4H9
关1兴
Because butyl is not a stable reaction product, butane either reacts to octane 共0.5C4H9 → 0.25C8H18兲 or disproportionate to a combination of butane and butene 共0.5C4H9 → 0.25C4H10+0.25C4H8兲. A similar reaction can be written down for the reaction with OH. The rest product of the reaction is thus a mixture of butane and butene or octane. In this reaction, hydrogen released from H2O at the surface has reacted with butyllithium to form butane. Also in the electrochemical 共dis兲charging conditions, with the presence of the electrolyte, LiPF6 in EC/DMC 共2:1兲, the proposed formation of Li2O at the surface implies dehydrogenation of the surface. A possible exothermic reaction that can occur in the presence of a catalyst is the formation of ethylene glycol and carbonmonoxide.30 The formation of Li2O at the TiO2 surface would proceed as follows 2TiO2共H2O兲x + 共1 + 4x兲Li + 2xC2H4O2CO共EC兲 → 2Li0.5TiO2 + 2xLi2O + 2xC2H4共OH兲2 + 2xCO
关2兴
A similar reaction can be written down for the reaction with OH, where CO may react with Li+ ions in the electrolyte toward Li carbonyl complexes.31 The pre-edge features of the XAS spectra have revealed that the pristine and lithiated amorphous structures are both built up of TiO6 octahedrons and TiO5 structures. As may be expected, the fivefold coordinated Ti atoms are present at the surface,21 offering suitable adsorption sites, assuming that the surface of the amorphous is similar to the anatase surface.32 To estimate the irreversible capacity by the formation of Li2O due to the presence of H2O and OH at the TiO2 surface, we assume for simplicity that the surface of the amorphous material is similar to the anatase surface, which is dominated by the 共101兲 and 共100兲/共010兲 surfaces. On these surfaces, water is absorbed dominantly in a molecular state rather than as hydroxyl groups.32-34 Adsorption energies on the available fivefold coordinated Ti atoms on the 101 surface H2O values are experimentally found to be between 0.5 and 0.7 eV,35 and 0.7 eV by DFT which appears largely independent of the coverage.32 Such large adsorption energies indicate that weight loss during the TGA measurements is most likely not due to the desorption of these strongly bound H2O molecules but rather due weakly bound H2O and OH at the surface of the particles. The Ti–OH2 bond length was calculated to be 2.28 Å,32 whereas the typical octahedral environment of the Ti–O bond is approximately 1.9 Å. Therefore, a coordination number of Ti between 5 and 6 may be expected, which is confirmed by the 5.4 coordination found by EXAFS and XANES. If we assume that a reaction with Li ions leads to the Li2O end product, we can simplify the calculation by assuming that only H2O molecules are absorbed. Assuming that all available fivefold coordinated Ti atoms host one H2O molecule 共strongly bound, not observed by TGA兲 and assuming the specific surface area to be 598 m2 /g 共from BET兲, this leads
A587
Table I. Specific capacities calculated based on Li insertion in the amorphous TiO2 host and formation of Li2O from surface adsorbed H2O, both strongly bound and weakly bound.
Composition Li0.5TiO2:共H2O兲1.29 TiO2:共H2O兲0.54:共Li2O兲0.75 TiO2:共Li2O兲0.54:共H2O兲0.75 Li0.5TiO2:共Li2O兲1.29
Specific capacity 共mAh/g兲 130 390 281 801
to only 0.54 H2O per TiO2 formula unit 共Ti/O ratio 1/2.54兲, whereas EDS indicates 1.5 ⫾ 0.5 H2O per TiO2 formula unit 共Ti/O ratio 1/3.5兲. If we consider the H2O detected by TGA, which shows 13% weight loss from a VD material at 373 K, referred to as weakly bound H2O/OH, this accounts roughly for an additional 0.75 H2O per TiO2 formula unit. Taking both strongly and weakly bound H2O contributions into account, this leads to 1.3 H2O per TiO2 formula units 共Ti/O ratio 1/3.3兲, which agrees well with the EDS results. Based on this H2O capacity, and assuming all hydrogen ions are replaced by Li ions during the chemical and electrochemical lithiation, in addition to the Li-ion insertion, we can calculate the expected capacities 共see Table I兲. The total capacity, where all adsorbed H2O is reacted to Li2O, is remarkably close to the capacity found for the first discharge 共810 mAh/g兲. Although no value should be given to the exact number, the fact that the order of magnitude is correct argues for the proposed reaction of H2O/OH adsorbed at the TiO2 surface toward Li2O. The formation of Li2O may be expected to be largely irreversible, explaining the large irreversible capacity. Nevertheless, the reversible formation of just Li0.5TiO2 is insufficient to explain the observed 200 mAh/g reversible capacity after 50 cycles. Hence, we propose that part of this capacity may be due to reversible storage in the form of Li2O at the TiO2 surface. Clearly, this 2xLi2O on TiO2 from Eq. 2 needs to form a TiO2+x composition upon reversible Li extraction, possibly resulting in titanium peroxide 共predominantly at the surface兲. Different titanium peroxides are known to exist,36,37 in which effectively peroxo groups O2− 2 are present. The reversible reduction of these O2− 2 groups by the addition of Li may be the mechanism that explains the reversible surface storage. An overall equation for such reversible reaction would be as follows 关Li0.5TiO2 + xLi2O兴 → 关TiO2+x兴 + Li0.5+2x
关3兴
where the brackets indicate that the reactants form a single few nanometer particle consisting of an ⬃TiO2 core and an oxygen-rich surface. At this stage, we do not understand how the formation of Li2O at the TiO2 surface decreases the Ti–O coordination from 5.4 in TiO2:共H2O兲1.29 to 5.0 in Li0.5TiO2:共Li2O兲1.29, as observed by XANES 共Fig. 5b兲 and EXAFS 共Fig. 5c兲 results. This may be either due to a change in the Ti–O coordination in the bulk of the material or due to the different nature of the bonding of Li2O to the TiO2 surface compared to H2O. In bulk anatase, the formation of Li0.5TiO2 leads to the splitting of the first Ti–O coordination shell, which, in the more disordered amorphous compound, may appear effectively as a reduction of the Ti–O coordination. Presently, detailed knowledge of Li2O on transition-metal oxides appears largely unavailable, although it appears very relevant for Li-ion battery electrodes. The reversible formation of Li2O is well known for several nanosized transition-metal oxides;38 however, in that case, the storage mechanism involves the decomposition of metal oxides and the formation of Li2O during Li insertion and the reformation of the metal oxides on extraction. Although such conversion reactions do not appear to exist for titanium oxides at present, we speculate possible reversible formation of a small fraction of Li2O at the surface of amorphous TiO2. Such reversible capacity would offer interesting
Downloaded 10 Aug 2011 to 131.180.130.114. Redistribution subject to ECS license or copyright; see http://www.ecsdl.org/terms_use.jsp
A588
Journal of The Electrochemical Society, 157 共5兲 A582-A588 共2010兲
possibilities for cheap high capacity, high power anode materials for Li-ion batteries; however, more research is required to establish this phenomena. In general, nano-titanium oxides appear to behave very similarly, showing a large initial capacity that scales with the surface area and appears largely irreversible.4,5,39,40,10,20 At similar voltages, a comparable large irreversible capacity loss during the first cycles was observed in TiO2–B, which is also prepared in a water-rich environment.10,20 Because no significant SEI formation was detected, it was suggested to be the consequence of poor electronic conductivity due to Li depletion at the near-surface region. The present results offer an alternative explanation based on the always present H2O/OH surface adsorbed species. Conclusions Nanostructured amorphous TiO2 leads to a very high discharge capacity of 810 mAg/h in the first cycle. However, only ⬃25% of the capacity appears to be reversible after 50 cycles. Nevertheless, the nanoscale amorphous titanium oxide remains to have a high reversible capacity compared to other titanium oxide morphologies, especially at a higher charge rate of 3.35 A/g 共10C兲. The change in Ti valence, observed by XAS, explains only a part 共130 mAh/g兲 of the reversible and irreversible capacities. The presence of adsorbed H2O/OH species at the TiO2 surface leads to the formation of Li2O, as observed by 7Li NMR, which explains the large irreversible capacity. Part of the Li2O at the TiO2 surface must be reversible to explain the relatively large reversible capacity of 200 mAh/g, possibly due to the formation of Ti peroxide at the particle surface. This phenomenon, in addition to the large 共dis兲charge capacity at large 共dis兲charge rates, makes these materials very appealing for cheap, high rate, high capacity Li-ion anodes. Acknowledgments We thank HASYLAB for the provision of beam time and the financial support of our experiments and D. Zajac and D. Novikov for their excellent support at the beam lines. The financial support from the Netherlands Organization for Scientific Research 共NWO兲 for the VIDI grant of M.W. is gratefully acknowledged. NWO is further acknowledged for financing the solid-state NMR facility for advanced material science at the Radboud University. We thank the Alistore network for providing access to TEM measurements and the electrochemical laboratories. Delft University of Technology assisted in meeting the publication costs of this article.
References 1. M. Wagemaker, W. J. H. Borghols, E. R. H. van Eck, A. P. M. Kentgens, G. J. Kearley, and F. M. Mulder, Chemistry (Weinheim, Ger.), 13, 2023 共2007兲. 2. M. Wagemaker, W. J. H. Borghols, and F. M. Mulder, J. Am. Chem. Soc., 129, 4323 共2007兲.
3. W. J. H. Borghols, D. Lutzenkirchen-Hecht, U. Haake, E. R. H. van Eck, F. M. Mulder, and M. Wagemaker, Phys. Chem. Chem. Phys., 11, 5742 共2009兲. 4. Y. S. Hu, L. Kienle, Y. G. Guo, and J. Maier, Adv. Mater., 18, 1421 共2006兲. 5. W. J. H. Borghols, M. Wagemaker, U. Lafont, E. M. Kelder, and F. M. Mulder, Chem. Mater., 20, 2949 共2008兲. 6. N. Meethong, H. Y. S. Huang, W. C. Carter, and Y. M. Chiang, Electrochem. Solid-State Lett., 10, A134 共2007兲. 7. A. S. Aricò, P. Bruce, B. Scrosati, J. M. Tarascon, and W. Van Schalkwijk, Nature Mater., 4, 366 共2005兲. 8. L. D. Noailles, C. S. Johnson, J. T. Vaughey, and M. M. Thackeray, J. Power Sources, 81–82, 259 共1999兲. 9. A. Kuhn, R. Amandi, and F. Garcia-Alvarado, J. Power Sources, 92, 221 共2001兲. 10. A. R. Armstrong, G. Armstrong, J. Canales, R. Garcia, and P. G. Bruce, Adv. Mater., 17, 862 共2005兲. 11. M. Hibino, K. Abe, M. Mochizuki, and M. Miyayama, J. Power Sources, 126, 139 共2004兲. 12. M. S. Whittingham and M. B. Dines, J. Electrochem. Soc., 124, 1387 共1977兲. 13. R. R. Ernst, G. Bodenhausen, and A. Wokaun, Principles of Nuclear Magnetic Resonance in One and Two Dimensions, Clarendon, Oxford 共1994兲. 14. S. Södergren, H. Siegbahn, H. Rensmo, H. Lindström, A. Hagfeldt, and S.-E. Lindquist, J. Phys. Chem. B, 101, 3087 共1997兲. 15. W. G. Williams, R. M. Ibberson, P. Day, and J. E. Enderby, Physica B, 241–243, 234 共1997兲. 16. R. J. Cava, D. W. Murphy, S. Zahurak, A. Santoro, and R. S. Roth, J. Solid State Chem., 53, 64 共1984兲. 17. M. Wagemaker, G. J. Kearley, A. A. van Well, H. Mutka, and F. M. Mulder, J. Am. Chem. Soc., 125, 840 共2003兲. 18. W. J. Macklin and R. J. Neat, Solid State Ionics, 53–56, 694 共1992兲. 19. C. H. Jiang, M. D. Wei, Z. M. Qi, T. Kudo, I. Honma, and H. S. Zhou, J. Power Sources, 166, 239 共2007兲. 20. G. Armstrong, A. R Armstrong, J. Canales, and P. G. Bruce, Electrochem. SolidState Lett., 9, A139 共2006兲. 21. L. X. Chen, T. Rajh, J. Nedeljkovic, and M. C. Thurnauer, J. Synchrotron Radiat., 6, 445 共1999兲. 22. F. Farges, G. E. Brown, and J. J. Rehr, Phys. Rev. B, 56, 1809 共1997兲. 23. M. Strømme, R. Ahuja, and G. A. Niklasson, Phys. Rev. Lett., 93, 206403 共2004兲. 24. V. V. Hoang, H. Zung, and N. H. B. Trong, Eur. Phys. J. D, 44, 515 共2007兲. 25. M. Wagemaker, R. van de Krol, A. P. M. Kentgens, A. A. van Well, and F. M. Mulder, J. Am. Chem. Soc., 123, 11454 共2001兲. 26. N. Bloembergen, E. M. Purcell, and R. V. Pound, Phys. Rev., 73, 679 共1948兲. 27. J. H. Strange, S. M. Rageb, A. V. Chadwick, K. W. Flack, and J. H. Harding, J. Chem. Soc., Faraday Trans., 86, 1239 共1990兲. 28. W. J. H. Borghols, U. Laffont, E. M. Kelder, F. M. Mulder, and M. Wagemaker, J. Am. Chem. Soc., 131, 17786 共2009兲. 29. A. V. Chadwick, K. W. Flack, and J. H. Strange, Solid State Ionics, 28–30, 185 共1988兲. 30. K. I. Tominaga, Y. Sasaki, T. Watanabe, and M. Saito, J. Chem. Soc., Chem. Commun., 1995, 1489. 31. B. Silvi, O. Ayed, and W. B. Person, J. Am. Chem. Soc., 108, 8148 共1986兲. 32. A. Vittadini, A. Selloni, F. P. Rotzinger, and M. Gratzel, Phys. Rev. Lett., 81, 2954 共1998兲. 33. K. I. Hadjiivanov and D. G. Klissurski, Chem. Soc. Rev., 1996, 61. 34. D. D. Beck, J. M. White, and C. T. Ratcliffe, J. Phys. Chem., 90, 3123 共1986兲. 35. M. Egashira, S. Kawasumi, S. Kagawa, and T. Seiyama, Bull. Chem. Soc. Jpn., 51, 3144 共1978兲. 36. G. Schwarzenbach, J. Muehlebach, and K. Mueller, Inorg. Chem., 9, 2381 共1970兲. 37. G. V. Jere and C. C. Patel, Z. Anorg. Allg. Chem., 319, 175 共1962兲. 38. P. Poizot, S. Laruelle, S. Grugeon, L. Dupont, and J. M. Tarascon, Nature (London), 407, 496 共2000兲. 39. J. Jamnik and J. Maier, Phys. Chem. Chem. Phys., 5, 5215 共2003兲. 40. G. Sudant, E. Baudrin, D. Larcher, and J. M. Tarascon, J. Mater. Chem., 15, 1263 共2005兲.
Downloaded 10 Aug 2011 to 131.180.130.114. Redistribution subject to ECS license or copyright; see http://www.ecsdl.org/terms_use.jsp