Live Ink®: Brain-Based Text Formatting Raises Standardized Reading Test Scores
National Educational Computing Conference -- 2005 Philadelphia, PA Research Paper (Roundtable): 7042647 Tuesday, 6/28/2005 8:30am– 9:30am PACC 105 A Randall Walker, MD, WRT -- Live Ink Reading Technologies Two Appletree Square Suite 204 Bloomington, MN 55425 www.liveink.com
[email protected] Charles Vogel, PhD Eagle Valley School District Eagle, CO
[email protected] Key words: Reading, Electronic Textbooks, Reading Comprehension, Standardized Tests, Grammar, Research-based Evidence
Research funded by Innovation Research Awards from the US Department of Education
Live Ink Research -- NECC 2005
Table of Contents Reading Performance in the Information Economy …………… How Live Ink Text is Made …………………………………… Integrating Visual and Syntactic Processing ............................... Live Ink Validation Research …………………………………. Summary of Prior Studies in College and 9th Grade Readers …... US Department of Education-funded Research Site, Subjects, Methods, Designs .………………… …… Baseline Equivalency ……………………………............ Screen Shots of Live Ink and Control ……..……………. Results By Grade: High School: Grade 10 ………………... Grade 11 ……………….. Middle School: Grade 6 ……………….. Grade 7 ……………….. Grade 8 ……………….. Multi-grade Assessment of Relative Impact …… Non-native English Readers …………………… Pilot Studies in Advanced Placement Courses Discussion ………………………………………………………. Live Ink®: A New “Cognitive” Paradigm for Electronic Text … NECC Instant Parsing Service ………………………………….
3 4 5 6 6 7 7-10 11 12-13
References …………………………………………………….
29
Data Sheets ………………………………………………………
29-33
14-15 16-17 18 19 20 21-23 24 25 26-27 28 28
Live Ink® Walker Reading Technologies, Inc. Two Appletree Square Suite 204 Bloomington, MN 55425 www.liveink.com
[email protected] 1-877-liveink © 2005 Walker Reading Technologies, Inc. A copy of the Final Research Report submitted to the US Department of Education on November 22, 2004 is available upon request. The Live Ink® text presentation method, and related software, are protected by US Pat. No. 5,802,533 and other US and global patents issued and pending. Live Ink® is a registered trademark of Walker Reading Technologies, Inc.
2
Live Ink Research -- NECC 2005
Reading Performance in the Information Economy In today’s Information Economy, over 60 percent of US jobs require proficient reading skills. Most US information workers must now read for several hours a day, (and increasingly from computer displays). (Derouzos, 1997) The economic value of wages for workers to spend time reading is therefore over $2 trillion a year. Moreover, over the past 30 years, the difficulty of reading material in US jobs has increased by several grade levels, but the reading proficiency of US students has not changed over this period. The US Department of Labor estimates that poor reading in the workplace costs US businesses over $225 billion a year, in waste, accidents, lost opportunities, and injuries. (Sum, 1999; Sum, Kirsch, & Taggart, 2002). Although the reading material for the top 70 percent of US jobs is at a 9th grade level, 70 percent of today’s high school seniors cannot read above a 7th grade reading level -- and 30 percent still read no better than a targeted 4th grade reading proficiency level. (National Center for Educational Statistics, 2003) Recently, new Federal programs have emphasized phonemic awareness in the early grades, as a keystone for building reading proficiency. However, as students move through the middle and high school years, the gap between targeted and actual reading proficiency gets wider -- suggesting that additional kinds of reading development are needed.
The widening gap between actual and targeted reading proficiency during middle and high school years also creates a dual dilemma for students and educators: (i) the curriculum must cover increasing amounts of specific content, leaving less time for targeted reading intervention; and (ii) the content itself is presented in larger and more complex texts to be read. A new method of formatting electronic text, Live Ink®, applies recent advances in Cognitive Science, and harnesses the digital attributes of electronic text to help solve this important educational and economic challenge. The visual and syntactic principles of this method have been explained in detail in a recent, separate publication, (Walker, Schloss, Fletcher, Vogel & Walker, 2005) and are summarized below.
3
Live Ink Research -- NECC 2005
How Live Ink Text is Made Live Ink’s computer-based parsing engines apply algorithms that analyze each sentence -- using both visual and linguistic criteria to determine optimal positions for segment breaks and indentation patterns. Computer databases and algorithms can also highlight verbs in each sentence. Several million computer calculations are performed for each sentence in a text. Overall, Live Ink software transforms a shapeless linear text string into an integrated, multidimensional image that cues sentence structure -- dynamically supporting the reader’s visual inspection, lexical processing, and interpretation of the text.
Millions of calculations per sentence
Lines break at phrase and clause boundaries
Shorter rows of text fit in 1 or 2 fixation spans
Cascading depicts syntactic hierarchies
Row-clusters remain vivid in “mind’s eye”
Indentations guide the eyes from row to row
4
Live Ink Research -- NECC 2005
Integrating Visual and Syntactic Processing with Multidimensional Text Cues Visual Processing. When the eyes track block text, the visual system can process only a small zone of visual data at each fixation, as shown at right. As a reader moves this “soda-straw” view across the standard page, attentional resources are strained, and the mind’s eye is unable to retain phrases in visual memory. Many of the eyemovements in reading (20% or more) are actually regressions -- in which the reader needs to re-examine previously viewed words and re-interpret phrase and clause relations between words.
brought forth a
our fathers
Four score and seven years ago
new
Syntactic Processing. Syntax is more complex than simply chopping a sentence into a series of phrases: it also requires identifying how phrases and clauses are hierarchically related, with some clauses “nested” within larger ones. Syntactic processing is a bridge between worddecoding and higher-order comprehension, and is an important factor in reading fluency. Brain studies have shown that syntactic processing also collaborates with the other steps in reading.
nation
conceived in liberty and dedicated to the proposition
upon this continent
that are all men created equal
When a reader encounters sentences with complex syntax, the brain dynamically recruits additional cortical regions to solve the syntactic “puzzle” (as shown at right). Because of the dynamic collaboration between syntactic tasks and other comprehension tasks, assisting readers with syntactic cues can free-up other brain resources for higher-order comprehension of the subject matter.
Simple Syntax
Complex Syntax
Four score and seven years ago, our fathers brought forth upon this continent a new nation, conceived in liberty and dedicated to the proposition that all men are created equal.
The goal of Live Ink text formatting is to help the eye and the mind work together to build meaning as one reads. This is accomplished by segmenting the text to fit into 1 to 2 fixation eye-spans, using indentation patterns that enable to reader to perceive the relative positions of adjacent rows while focusing on a particular row; and using multi-row patterns that cue syntactic structure and enhance visual memory across phrase-groups. In this way, the brain can now use its powers for pattern recognition to build sentence meaning and boost comprehension. 5
Live Ink Research -- NECC 2005
Preliminary Live Ink Validation Research Prior research, conducted independently by two universities and involving college level readers and 9th grade high school students, has been reported elsewhere (Walker, Schloss, Fletcher, Vogel & Walker, 2005), and issummarized below; both studies used randomized controlled study designs. College Reader Results. Among college-level readers, studied in a “within subjects” randomized controlled design, Live Ink format significantly increased reading comprehension and reading efficiency (comprehension divided by reading time). The effect size of this increase was over one-half of a standard deviation higher for texts read in Live Ink (VSTF, for “visual syntactic text format”) compared to block format. Readers also reported eyestrain symptoms much less frequently when reading Live Ink text compared to block format (a 75% reduction in the frequency of eyestrain symptoms). Over sixty percent of the readers immediately preferred the Live Ink format over block format, after only 1 hour of use. Comprehension
Grade 9 High School Results. In a study spanning an entire academic year, 9th grade students in the Live Ink classes had significantly higher scores on quizzes and unit exams. The difference between Live Ink and Control classes’ exam scores got larger over the year. On the final examination in the spring semester (covering material from the entire semester), Live Ink classes scored more than a full-standard deviation higher than Control classes. In addition, reading proficiency tests (given in block format) showed that the Live Ink groups had become significantly better readers, gaining nearly 10 percentile points in age-adjusted national percentile rankings, while the control group remained at the same national percentile ranking. Students for whom English is a non-native language made significant gains, attaining the same reading proficiency level as the control group of native English students.
6
Live Ink Research -- NECC 2005
US Department of Education-funded Research In 2001 and 2002, Live Ink received Phase 1 and 2 SBIR Innovation Research Awards from the US Department of Education. With this support, additional controlled studies were conducted to demonstrate the impact of Live Ink on learning and long-term reading proficiency, following guidelines at the US Department of Education’s What Works Clearinghouse (http://www.whatworks.ed.gov/ ) for scientific educational research. Research Sites The sites were 1 high school and 4 middle schools, in a single rural-suburban school district in Colorado.. Because this research involved the evaluation of educational interventions in a class-room setting, the research qualified for an exemption (category 1) from Federal Human Subjects research regulations. All student data were kept within school district, and analyzed exclusively by school district personnel. The research spanned the 2003-2004 academic year Student Demographics The proportion of students for whom English was a non-native language was approximately 35% in each grade; see table on page 14. The percentage of students qualifying for free or reduced lunch was 27.5%. Teacher Participants At the high school level, all 3 social sciences teachers participated, each teaching both a control and an intervention group in the same grade. At the 2 middle schools where the intervention was used, there were a total of 10 teachers, from both social sciences and language arts subject areas. Materials and Methods Texts and Reading Sessions. The main texts were the social sciences textbooks for each grade. In addition, at the middle school level, students also read curriculum-required narrative literature, such as passages from classic novels. At the high school level, both VSTF and block text version of electronic textbooks were prepared. Both electronic textbook platforms permitted font enlargement, dark and light background colors, and point-&click table of contents. Block formatting for the control groups electronic textbooks used the same number of characters per line as was found in the standard, paper-based textbook. At the middle school level, the intervention groups used a web-based text-presentation platform for the Live Ink (VSTF) version of the text; the text manipulation capability was more limited than the high school versions, but still permitted font enlargement and color modification. Table of contents functionality was provided by a list HTLM links, which the students would use to go to selection positions in the their texts. Similar chapter-by-chapter navigation was provided for classic narrative literature. Control students in the middle school level used their standard, paper-based textbooks. Computers. At the high school level, laptop computers using Microsoft Windows® operating system were used, and the electronic textbooks were presented in Windows-based applications that had been developed specifically for the VSTF method. Laptops were kept on a rolling cart which could be moved from classroom to classroom. If scheduling conflicts precluded laptop use, high school reading sessions could also be conducted in the school’s computer labs, which used desktop PCs. At the middle school level, the Live Ink text was presented in newly developed web-based (HTML and Javascript) software modules and read from Apple® iMacs in computer labs; these electronic texts were maintained on remote servers, outside of the district, and required district-level passwords to gain access to the content.
7
Live Ink Research -- NECC 2005
Study Designs Data on intervention and control students were collected prospectively, including district and statemandated nationally standardized reading tests that were required for all students. High School: Randomized Controlled Trials At the high school level, all 10th grade (n=84) and 11th grade (n=60) students (except those taking an Advanced Placement History class), were randomly assigned to one of six (in grade 10) or four (grade 11) different class sections of History. There were 3 teachers for grade 10; each had one intervention and one control grade 10 class section. There were 2 teachers for grade 11 (who also taught grade 10 classes); each of these also had one intervention and one control grade 11 class section. At each grade, and for each teacher, additional randomization assigned one of the teacher’s two class sections to be an intervention class and the teacher’s other section in that grade to be control. Importantly, all of the teachers, in both grades 10 and 11, for both their individual intervention classes and control classes, coordinated their curriculum content coverage and student testing in complete uniformity, covering, week by week, identical chapters and sections for the course textbooks, which had been agreed upon in advance. All testing instruments, including quizzes given after each reading session, unit exams, and final exam were identical across all teachers at each grade, and for both intervention and control class sections.
Study Design: High School Randomized Controlled Trials
Middle School: Prospective, Matched-Case Controlled (PMC) Studies Middle School students were studied with prospective, matched-case controls, identifying matching intervention students from 2 of the middle schools with corresponding control students from the same middle school, but on a different “team”, or from other middle schools in the same district using the same curriculum. For the PMC, each student in the intervention group was paired with a student for the control group who was either in a different team in the same school or in another middle school matched for, by priority: (a) baseline scores on the Northwest Education Association’s nationally standardized test for reading; (b) native Engish versus non-native English speaking status; and (c) gender. (Quasi-experimental Design with Equating).
8
Live Ink Research -- NECC 2005
Intervention Method At each grade, students read in class for approximately 50 minutes a week. At the high school level, the teacher-supervised reading sessions, for both intervention and control groups, occurred in social sciences classes. No electronic textbook reading occurred outside of class time. Because neither the VSTF electronic textbook nor the block electronic textbook had any images or figures, students in both the intervention group and the control group were always free to open and use their standard, paper-based textbooks in class, either to complete the assigned reading section or to examine the paper textbook’s figures and images. At the middle school level, a target of 50 minutes of reading per week was accomplished by having intervention students read, in computer labs, either social sciences or language arts content. Control students received their standard curriculum, which employed the same textbook as the intervention groups. Social Sciences teachers and Language Arts teachers whose classes used the intervention were on the same “team” ; in this way, there was no crossover between control group and intervention group, and students who were receiving the intervention in social sciences classes would also be receiving the intervention from their language arts teachers. After each social sciences reading session, students were given a 10-point quiz, from the publisherprovided section quizzes for the textbooks, which counted toward a student’s grade. Because participation in the study was integrated with classroom activities, and thus controlled directly by teachers, there was not attrition, and no cross-over between study groups. Outcomes measurement Reading Comprehension. For several years prior to the study, the school district had already adopted the Northwest Education Association (NWEA) MAP test for Reading (www.nwea.org), as a tool to assess individual student progress and to document teacher performance. For this study, for grades 6 through 8 and grade 10, both in the control groups and intervention groups, the school district’s data on the NWEA test was used for both baseline, pretest, measurement of reading comprehension in the fall, and for end-ofyear, posttest, measurement of reading comprehension in the spring. Academic Achievement. For 11th grade students, it was also possible to analyze district-based data of each student’s score on the Colorado Student Assessment Program (CSAP) reading section. For baseline, pretest, measurement, scores from the previous spring were used (i.e., scores from CSAP tests given in the spring of 2003, while in grade 10, were used as baseline for students in the 11th grade during the 2003-2004
9
Live Ink Research -- NECC 2005
academic year). Because the state of Colorado requires all 11th graders to take the ACT college placement test (whether the student plans to go to college or not), it was possible to use the district’s the ACT reading section scores as a posttest measure for the 11th grade. For grades 10 and 11, it was also possible to analyze the scores of students’ quizzes given after each reading session, and of students’ unit exams, given approximately every 3 weeks during the year. For grade 10, (World History), there 37 quizzes and 10 unit exams. For grade 11, (US History), there were 46 quizzes and 16 unit exams. Statistical Methods Baseline Equivalency. The equivalency of intervention and control groups, at each grade, was determined by performing a between groups analysis of variance. For middle school grades and grade 10, equivalency testing used the Fall NWEA test. For grade 11, equivalency was determined using the CSAP test of the prior spring (grade 10) test. Pretest-Posttest Comparisons. For the middle school grades, a comparison of pretest versus posttest results on the NWEA reading test was made, using Analysis of Variance methods. A multivariate analysis of variance (MANOVA) was performed to control for the possibility of disproportionate impacts of the intervention in various subgroups, (gender and native-English language status), teacher effects, class section effects, (or combinations of such variables), and baseline reading aptitude. To control for the variation in baseline reading aptitude, the spring NWEA score was the dependent variable, and Fall NWEA as the independent variable. An individual student’s growth from the pretest to the posttest was also determined for each student, in both the intervention and matched control groups, across all middle school grades, and was included in the multivariate model. For the high school grades, similar MANOVA analyses were performed. In the 10th grade, pretest-posttest comparisons were performed using NWEA.. For the 11th grade, pretest-posttest comparison was made using ACT tests as the dependent variable, and the previous year’s CSAP scores as the independent variable. Group Comparisons on Quizzes and Exams. To compare the impact of the intervention on Quiz and Exam scores in 10th and 11th grade students, a Test of Repeated Measures multivariate analysis of variance test was performed. CSAP scores from the previous year, (9th grade spring for 10th graders, and 10th grade spring for 11th graders), were used to rank students by reading achievement into four categories: unsatisfactory (MPP), partial proficient (LP), proficient (MP), or advanced (HP), which were used as a covariate to insure for equivalency between groups. Statistical Computations were performed using the Statistics Package for Social Sciences, version 10.0.
10
Live Ink Research -- NECC 2005
Grade/Design Group Equivalency* 6/PMC Control F = .001 p= .983 Intervention
7/PMC F = .000 p = .993
Control
Parameter All
EL1
ESOL
Male
Female
N
57
37
20
32
25
Pretest
208.4 213.5 199.1
208.5 208.3
N
57
34
Pretest
208.3 215.5 197.8
205.8 212.4
N
53
26
Pretest
216.7 221.6 203
216.5 217
53
25
28
Intervention N
8/PMC F =.099 p =.753
Control
11/RCT F =1.187 p=.280
Control
43
14 10
23
27
216.7 220.6 200.3
216
217
N
62
29
33
Pretest
223.8 227.3 207.9
221.8 223.7
62
27
48 49
14 13
35
Pretest
223.0 225.9 206.6
220.8 222.9
N
44
24
Pretest
226.1 229.2 221.12 225.4 226.9
Intervention N
Control
39
23
Pretest
Intervention N
10/RCT NWEA F =.183 p=.670
34
40
27 28
17 12
21
20 19
Pretest
227.3 229.6 221.17 226.9 227.2
N
30
24
6
18
12
Pretest†
680
678
684
678
686
30
22
8
16
14
691
699
667
687
691
Intervention N Pretest†
Demographics & Baseline Equivalency of Intervention and Control Groups. PMC= Prospective Matched-Case Control Trial RCT = Randomized Control Trial Pretest = Northwest Educational Association (NWEA) MAP-reading scores for grades 6-8 and grade 10 studies. † Pretest = CSAP-reading (previous spring, grade 10) score for grade 11 study Equivalency* analysis= one-way ANOVA between groups (all subgroups) EL1=native English students ESOL= non-native English students
11
Live Ink Research -- NECC 2005
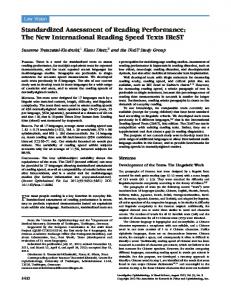
Sample of Live Ink electronic textbook, with font enlargement feature. Both the control and intervention electronic textbooks in the High School randomized controlled trials had font enlargement and light/dark background color options.
12
Live Ink Research -- NECC 2005
Conventional Block text electronic textbook, with font enlargement feature. Both the control and intervention electronic textbooks in the High School randomized controlled trials had font enlargement and light/dark background color options.
13
Live Ink Research -- NECC 2005
Grade 10 Randomized Controlled Trial There were 84 total Grade 10 students. Three teachers participated, each teacher having one control class section and one intervention section; for each teacher, randomization of one’s two sections to either treatment or control group was made by coin toss. Students read for 25 minutes every other day from the World History textbook used in the course. All classes, across all teachers, read the same textbook chapters, and took identical quizzes after each reading session (total 38) and identical unit exams (total 10) every 3 to 4 weeks during the year. All classes had the same reading proficiency test, (the Northwest Educational Association, NWEA, MAP-reading test), for pretest/posttest assessment of reading proficiency in the fall and spring of the same academic year. Pretest NWEA scores demonstrated statistical equivalence between the control and intervention groups, across gender and native language subgroups. Results Quizzes: Student scores on quizzes were significantly higher in the Live Ink groups (VSTF); 65 percent of Live Ink students had year-average quiz scores that were higher than the Control’s mean year-average. Unit Exams: Scores on unit exams were also significantly higher in the Live Ink group; 70 percent of Live Ink students had year-average unit exam scores that were higher than the mean year-average score of the Control group. Final Exam: On the Final Exam, covering material of the entire spring semester, Live Ink students’ scores were even more elevated compared to controls: 92 percent of Live Ink students had scores that were greater than the mean Final Exam score of the Control group. The Live Ink group’s scores were more than a full-standard deviation higher than Control group’s scores. Post-test Reading Comprehension: The Reading Comprehension test (NWEA) given in the spring showed a significantly higher growth in Live Ink students’ reading proficiency compared to the reading comprehension in Control students.
14
Live Ink Research -- NECC 2005
Grade 10: Distribution of Scores on Final Exam
Subgroups. Multivariate analyses included subgroups based on native language status, gender, baseline reading proficiency level, and teacher. Significant increases with the Live Ink (VSTF) treatment were seen across all subgroups, including results for quizzes, exams, and reading proficiency. The multivariate analysis also confirmed that the benefits seen in Live Ink group were most directly correlated with the Live Ink intervention itself, and could not otherwise be explained by other factors such as teacher effect or baseline reading aptitude, or by combinations of such factors.
15
Live Ink Research -- NECC 2005
Grade 11 Randomized Controlled Trial There were 60 total Grade 11 students. Two teachers participated, each teacher having one control class section and one intervention section; for each teacher, randomization of one’s two sections to either treatment or control group was made by coin toss. Both groups used laptops for in-class reading -- 25 minutes every other day from their US History textbook. All classes read the same textbook chapters, took identical quizzes after each reading session (total 48), and had identical unit exams (total 14) every 2 to 3 weeks during the year. All classes had the same reading proficiency test, (Colorado Standards CSAP-reading test), for pretest assessment of reading proficiency in the spring of the preceding academic year (10); pretest CSAP scores demonstrated statistical equivalence between the control and intervention groups, across gender and native language subgroups. A post-test measurement for Reading Comprehension, the ACT-reading test (given to all juniors in the State of Colorado), was given in the spring of the study year (11). Results Quizzes: Based on a test of repeated measures multivariate analysis of all of the year’s quiz scores, student scores were significantly higher in the Live Ink groups (VSTF), even when controlling for variations in baseline reading proficiency; 64 percent of Live Ink students had year-average quiz scores that were higher than the mean year-average of the Control group. Unit Exams: Similarly, multivariate analyses found that scores on unit exams were also significantly higher in the Live Ink group; 68 percent of Live Ink students had year-average unit exam scores that were higher than the mean year-average score of the Control group. Final Exam: On the Final Exam, covering material of the entire spring semester, Live Ink students’ scores were even more elevated compared to controls: 78 percent of Live Ink students had scores that were greater than the mean Final Exam score of the Control group. Post-test Reading Comprehension: Reading Comprehension test (ACT) given in the spring showed significantly higher scores for Live Ink students’ reading proficiency compared to the reading comprehension in Control students; the multivariate analysis used pretest CSAP scores as the covariate and ACT reading scores as the dependent variable.
16
Live Ink Research -- NECC 2005
Grade 11: Scores on unit exams given about every 3 weeks.
Estimated Marginal Means of MEASURE_1 80
Estimated Marginal Means
70
60
SECTIONS
50
liveink control
40 1
2
3
4
5
6
7
8
9
10
11
12
13
14
TIME
Subgroups. Multivariate analyses included subgroups based on native language status, gender, baseline reading proficiency level, and teacher. Significant increases with the Live Ink (VSTF) treatment were seen across all subgroups, including results for quizzes, exams, and reading proficiency. The multivariate analysis also confirmed that the benefits seen in Live Ink group were most directly correlated with the Live Ink intervention itself, and could not otherwise be explained by other factors such as teacher effect or baseline reading aptitude, or by combinations of such factors.
17
Live Ink Research -- NECC 2005
Grade 6: Prospective, Matched-Case Controlled Trial There were 114 total Grade 6 students studied: 57 in the Live Ink Group, and 57 in the control group. Live Ink students had Social Sciences teachers and Language Arts teachers who taught the same cohort of students, i.e., a “team”. All middle school students in the district were given identical pretest/posttest reading proficiency tests (the NWEA MAP test for reading). Controls from 3 other middle schools were matched with individual students in the intervention team according to three parameters: first, by baseline Fall NWEA-reading scores; second, by non-native versus native English status; and third, by gender. Statistical analysis confirmed that the intervention and control groups were highly equivalent. Grade Reading Comprehension Tests (NWEA) N=114
6
Mean Control Score (SD)
Mean VSTF Score (SD)
Effect Size: VSTF Control ÷ SD all
Pretest
208.43 208.36 0 (17.59) (18.26) Posttest 209.68 219.67 0.66 (18.37) (11.88) Growth 1.263 11.33 1.04 (8.54) (10.9) *ANOVA and Multivariate Analysis of Variance
Percent of VSTF scores > Control Mean
F Value*
P Value*
50
.001
.983
80
16.031