Mar 21, 1990 - Division, P.O. Box 92960, Los Angeles, CA 90009-2960. ... MOIE Program Manager. SSD/ ..... degree of involvement (if any) of i bonding orbitals. ...... Laboratory: Launch vehicle and reentry fluid mechanics, heat transfer.
REPORT SSD-TR-90-09
UD
Ln o N
Electronic Structure and Lubrication Properties of MoS 2: A Qualitative Molecular Orbital Approach
PAUL D. FLEISCHAUER, J. R. LINCE, P. A. BERTRAND, and R. BAUER Chemistry and Physics Laboratory
Laboratory Operations The Aerospace Corporation El Segundo, CA 90245
21 March 1990
Prepared for SPACE SYSTEMS DIVISION AIR FORCE SYSTEMS COMMAND Los Angeles Air Force Base P O. Box 92960 Los Angeles, CA 90009-2960
APPROVED FOR PUBLIC RELEASE; DISTRIBUTION UNLIMITED
04
16
095
s
D4C
LEC; APR1?. .-
0
This report was submitted by The Aerospace Corporation, El Segundo, CA 90245, under Contract No.
F04701-85-C-0o86-P00ol9 with the Space Systems
Division, P.O. Box 92960, Los Angeles, CA 90009-2960.
It was reviewed and
approved for The Aerospace Corporation by J. M. Straus, Director, Chemistry and Physics Laboratory.
Lt Carl Maes was the project officer for the
Mission-Oriented Investigation and Experimentation (MOIE) Program. This report has been reviewed by the Public Affairs Office (PAS) and is releasable to the National Technical Information Service (NTIS).
At NTIS, it
will be available to the general public, including foreign nationals. This technical report has been reviewed and is approved for publication. Publication of this report does not constitute Air Force approval of the report's findings or conclusions.
It is published only for the exchange and
stimulation of ideas.
CARL VAES, LT, USAF MOIE Project Officer SSD/CWDE
RAYMOD M. LEONG, MAJ, USAF MOIE Program Manager STC/WCO OL-AB
UNCLASSIFIED SECURITY CLASSIFICATION OF THIS PAGE
REPORT DOCUMENTATION PAGE la. REPORT SECURITY CLASSIFICATION
lb. RESTRICTIVE MARKINGS
Unclassified 2a SECURITY CLASSIFICATION AUTHORITY
3. DISTRIBUTION/AVAILABILITY OF REPORT
2b. DECLASSIFICATION/DOWNGRADINGSCHEDULE
Approved for public release;
distribution unlimited 4. PERFORMING ORGANIZATION REPORT NUMBER(S)
5. MONITORING ORGANIZATION REPORT NUMBER(S)
TR-0088( 3945-03)-I 6a
SSD-TR-90-09
NAME OF PERFORMING ORGANIZATION
6b. OFFICE SYMBOL
Laboratory Operations The Aerospace Corporation 6c
(Ifapplicable)
ADDRESS (City State, and ZIP Code)
Los Angeles Air Force Base Los Angeles, CA 90009-2960
Ba. NAME OF FUNDING/SPONSORING ORGANIZATION
11
Space Systems Division 7b. ADDRESS (City State, and ZIP Code)
El Segundo, CA 90245
8c
7a. NAME OF MONITORING ORGANIZATION
8b. OFFICE SYMBOL (If applicable)
9. PROCUREMENT INSTRUMENT IDENTIFICATION NUMBER
FO4701-85-C-0086-P00019 10. SOURCE OF FUNDING NUMBERS PROGRAM PROJECT TASK ELEMENT NO. NO. NO.
ADDRESS (City State, and ZIP Code)
WORK UNIT ACCESSION NO.
TITLE (Include Security Classification)
Electronic Structure and Lubrication Properties of MoS 2 : A Qualitative Molecular Orbital Approach 12. PERSONAL AUTHOR(S)
Fleischauer, Paul D.; Lince, Jeffrey R.; Bertrand, P. A.; and Bauer, Reinhold 13a. TYPE OF REPORT
13b. TIME COVERED
16
14. DATE OF REPORT (Year, Month, Day)
TO
FROM
15. PAGE COUNT
35
1990 March 21
SUPPLEMENTARY NOTATION-
17.
COSATI CODES FIELD
GROUP
18. SUBJECT TERMS (Continue on reverse it necessary and identify by block number)
lbricanZs, MoS 2 Onolybdenum disulfide)' Electronic structure,
SUB-GROUP
Solid
19. ABSTRACT (Continue on reverse if necessary and identify by block number)
The electronic structure of the solid lubricant materal MoSC is described b
a qualitative
molecular orbital (MO) model that is based on the D ht symmetry of the Mo(S) 6 unit in the crystal. The MO model is used to assign peaks in t~e' valence-level photoelectron spectrum (VLPS) and the electron energy loss spectrum of MoS 2 (0001) and to interpret the effects of ion bombardment (IB) of this surface on its electronic structure. The dependence of VLPS peak intensities on excitation energy is used to assign the energy levels in the MO diagram. Variations in crystal lattice spacing within sputter-deposited MoS 2 films are explained in terms of electron density arguments. Structural information, together with information on surface bonding and on adhesion from the IB studies, aids in predicting the lubrication performance of these films. It is proposed that the highest occupied orbital for MoS 2 is an A0'nonbonding orbital and that important film properties, such as adhesion to substrates and friction within the film, can be manipulated by altering the electron '
occupancy of this orbital.j.,
.,
.!
20 DISTRIBUTION/AVAILABILITY OF ABSTRACT ] SAME AS RPT UNCLASSIFIED/UNLIMITED [ 22a NAME OF RESPONSIBLE INDIVIDUAL
DD FORM 1473, 84 MAR
21. ABSTRACT SECURITY CLASSIFICATION []
DTIC USERS
Unclassified 22b. TELEPHONE (Includere Code) 1227. OFFICE SYMBOL
83 APR edition may be used until exhausted
SECURITY CLASSIFICATION OF THIS PAGE
All other editions are obsolete
UNCLASSIFIED
UNCLASSIFIED SECURITY CLASSIFICATION OF THIS PAGE
18.
SUBJECT TERMS, Continued Molecular orbital theory Lubrication Energy levels, electronic Photoelectron spectra of MoS 2 Ion bombardment of MoS 2 Lattice spacing of MoS 2
SE cURrY CLASSIFATION OF THIS PAGE
UNCLASSI FI ED
PREFACE
Support for this work was provided by the Defense Advanced Research Projects Agency and the U.S. Air Force Space Systems Division Contract No. F04701-85-C-0086-P0019.
This report is dedicated to the memory of Dr.
C. C. Badcock.
Aeoeesson For. Y'TrS
GRA&I
DTIC TAB Unannounced Justificatton
(
0 0
Sistributon/
~alability Cods ;Oist
.0(
Special
CONTENTS
PREFACE...............................................................
1
I.
INTRODUCTION ......................................................
7
II.
MOLECULAR ORBITAL MODEL ...........................................
9
III. EXPERIMENTAL ...................................................... 15 IV.
V.
RESULTS AND DISCUSSION ............................................ 17 A.
VALENCE-LEVEL SPECTROSCOPY ................................... 17
B.
ION BOMBARDMENT .............................................. 22
C.
CRYSTAL STRUCTURE ............................................ 27
SUMMARY AND CONCLUSIONS ...........................................
33
REFERENCES............................................................ 35
F IGURES
1.
Crystal structure of 2H-MoS2 , showing primary crystallographic directions and dimensions ...................... 10
2.
Molecular orbital energy-level diagram for 140(S) 6 in 2H-MoS 2 . . . . . . . . . . . . . . . . . . . . . . . . . . . . . . . . . . . . . . . . . . . . . . 12
3.
Correlation of EELS and VLPS spectra of MoS 2 (0001) with MO levels.................................................
18
4.
Variation in VLPS peaks with excitation photon energy.................................................. 21
5.
Core-level peaks for MoS (0001), showing Mo andpeks~ efore and a~er bombardment Nioscm....................................... withp5ak 1
23
6.
VLPS peaks for MoS 2 (0001), showing the effects of IB with 1-keV Net, 225-eV excitation and 0.5-key N+, 22.4-eV excitation ................................. 24
7.
EELS peaks for MoS 2 (0001), showing the effects of lB with 1-keV Ar ...........................................
25
XRD scans of the (100) peak for sputter-deposited MoS2 films.....................................................
28
8.
TABLES
11
1.
Orbital Scheme for MoS2 Crystal.................................
2.
Peak Energies and Assignments for MoS 2 Crystals....................................................... 19
5
I.
INTRODUCTION
The electronic structures of layered transition metal dichalcogenide (LTMD) compounds (e.g., of MoS 2 ) are of great fundamental interest, primarily because of the compounds' unusual crystal structures.
LTMDs are
formed by stacking "sandwiches" consisting of a layer of transition-metal atoms between two layers of chalcogen atoms. There is strong covalent bonding within the sandwiches but weak, primarily van der Waals, bonding between them.
This crystalline anisotropy results in anisotropy in
properties such as electronic conductivity and in such diverse applications of LTMDs as catalysts, batteries, and lubricants.
In addition, the elec-
tronic and crystal structures of these highly anisotropic materials vary, so that some LTMDs are very good lubricants (MoS 2 ) and others are poor lubricants (NbSe2 ) or abrasives (TaS2 ).1'2
Likewise, these materials can
demonstrate wide variations in electronic type; LTMDs can be semiconductors 3 (TiS 2 , MoS 2 ), semimetals (TiSe 2 , WTe 2 ), or superconductors (TaS 2 , NbSe2 ).
Numerous experimental and theoretical investigations of LTMDs have attempted to describe their electronic structures 3 - 13 and to correlate those structures with catalytic activity 3 ' 12 ' 13 and lubrication performance.14,15
Photoelectron spectroscopic, electron energy loss spectro-
scopic, and x-ray absorption/emission measurements have been compared with various theoretical [semiempirical band structure and molecular orbital (MO)] treatments of the electronic energy levels in order to describe the valence electronic structures of the layered compounds, especially those of MoS 2 .
But many of those studies encountered difficulties in fitting theory
to experiment, primarily because no attempt was made to incorporate the effects of intralayer covalent bonding between molybdenum and sulfur into the band structure calculations.
In a recent study of MoSe 2 , MoS 2 , and
WS2 , the augmented-spherical-wave (ASW) method of calculating band structures, including metal-chalcogen covalency, was used to generate valenceand conduction-band states that agreed well with the results of angleresolved ultraviolet photoelectron spectroscopy and optical band-gap
7
measurements. 12 ' 13
Those studies involve complex calculations on model
systems of pure materials.
Such models can be difficult to apply to real
materials, i.e., materials that have been chemically or structurally modified.
The main purpose of this report is to show that a wide variety
of properties of varying systems can be described by a relatively simple, qualitative MO model that is easy to apply to real systems. In this report, data are presented on the energy dependences of cross sections and sampling depths for valence-level electronic transitions, measured by valence-level photoelectron spectroscopy (VLPS); the chemical modification of MoS 2 (0001) by ion bombardment, measured by electron energy loss spectroscopy (EELS), core level photoelectron spectroscopy (CLPS), and VLPS; and bulk crystal structural variations--specifically differences in the lattice spacings--of MoS 2 thin films prepared by sputter deposition and measured by x-ray diffraction.
All results are interpreted with the aid of
the MO model of the energy levels of the Mo(S) 6 unit within the MoS 2 crystal.
This simple model is used in conjunction with spectroscopic data
to predict performance properties (adhesion, friction, and wear) of solid film lubricants and to recommend substitutions for lubricant surface and bulk constituents that would alter those properties.
8
II.
MOLECULAR ORBITAL MODEL
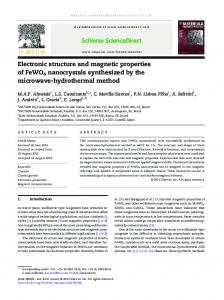
Within the layered crystal of 2H-MoS 2 , shown in Fig. 1, each Mo atom is surrounded by six S atoms in the form of a trigonal prism (TP).
Each S
atom forms the apex of a triangular pyramid that has three Mo atoms at its base and Mo-S-Mo bond angles of approximately 820.
Using standard group
theory, molecular orbitals for the Mo(S) 6 units can be constructed according to the irreducible representations for the D3 h symmetry point group (i.e.,
the TP structure).
The entire set of wave functions and a complete
MO energy-level diagram for a molecule with D3 h symmetry have been published.1 6
However, application to the MoS 2 system requires that a major
difference be recognized between the bonding for a single molecule (i.e., ML6 ) and that for an Mo(S) 6 group within a MoS 2 crystal: degree of involvement (if any) of
specifically, the
i bonding orbitals.
Previous attempts at describing the electronic structure 4 of TiS 2 and at interpreting the lubricant properties of LTMDs, including MoS 2 , with MO theory 14 have been unduly complicated because they failed to recognize the repetition or periodicity of the Mo(S) 6 units in the crystalline materials.
They invoked S 3p-pi orbitals, which do not exist in these
crystals, because each sulfur bonds to three metal atoms and not one.
The
820 Mo-S-Mo bond angles in MoS 2 are slightly smaller than expected for the involvement of essentially unhybridized S 3p orbitals in sigma bonding to three Mo atoms within a sandwich. orbitals (i.e.,
However, hybridization of the sulfur
with the 3s or 3d orbitals) would have the effect of favor-
ing Mo-S-Mo bond angles larger than 900. The pertinent MO wave functions (used in the above-mentioned MO model) are reproduced in Table 1, and the energy-level diagram for the crystal is simplified substantially from that of Ref. 16 or Ref. 14 as shown in Fig. 2.
There are seven bonding/nonbonding MO energy levels that exactly
accommodate the 14 valence electrons in the Mo(S) 6 unit within the crystal.
(The ordering of levels in Fig. 2 is assigned on the basis of
spectral data presented in "Results and Discussion," Section IV.)
9
2H-MOS 2
E
C
(0 0)
Fig. 1.
Ii
Crystal structure of 2H-MoS2 , showing primary crystallographic directions and dimensions.
10
TABLE 1. ORBITAL SCHEME FOR MoS 2 CRYSTAL
Irreducible representation
Aa
1
Mo
orbitals
5P1
E'@
(4dxzp1dy
El
1
4d22,-,02
All
2
S
-(o4
A
(4dxy,4dx2
2)
+ 03 + 04 + 0
1'~
(a -02 +(.3 -04 1
-L(2o
z )
orbitals
-0
+ 05 - 06)
- 2o2 +
-
1(o 3
- 04 - 05 +
-1(2o
- a3
+ 06)
6
04 +
06)
06)
a5 + 2c2 - a4 - a6)
2/3-
(xy)
A'
5s,4dz2
2 (3 1
4 - a 5 - 06)
1(o
I
+
2 + 03 + 04 + 05 + 06
aFrom group theory, there are two Aj irreducible representations; one is assigned primarily 5s character and is a bonding MO, and the other is assigned primarily 4d 2 and is a nonbonding MO. See text for further discussion. Orbital -esignation (coordinate system) after Ref. 16.
11
5p
S
MoS 2
Mo
I
'
{
}
5s 4d
E"
)
(z2, S)
-,
A{,
i
,
Fig. 2.
(xz, yz)
(x, y, xy , x2 E' = " ' -'2 Aj + - • (S,Z)
.......
3p
__,_,
y
-
3s
Molecular orbital energy-level digram for Mo(S) 6 in 2H-MoS 2 . The terms in parentheses (e.g., z , s, xz) represent the meal orbitals that make primary contributions to the MOs.
12
From this MO interpretation, it is evident that for MoS 2 all of the accessible orbitals for both Mo and S are completely involved in intralayer bonding, leaving only high-energy antibonding orbitals available for interlayer bonding or interfacial bonding with other materials. dangling bonds (i.e., atoms:
There are no
accessible orbitals) on either the Mo or S surface
The "lone pairs" of S 3s electrons occupy very stable orbitals, and
such stability means that 3s electron density remains close to the S atoms and, therefore, does not interact strongly with adatoms. These
electron distributions and bonding properties have major impli-
cations for tribological performance (as well as for catalytic activities and battery operation), because subtle variations in crystal structure and adhesion properties at film-substrate interfaces govern lubricant film friction and endurance.
Our attempt to prepare MoS 2 lubricant films that
are oriented with their basal planes parallel to the appropriate substrate surface and that adhere strongly to that surface
15 , 1 7 2 0
is a primary moti-
vation for the studies described and discussed in the following sections. The undisturbed (0001) basal surface of MoS 2 cannot form bonds or react unless its molecular orbital structure is altered by physical or chemical 2 1 22 manipulation (for example, by ion bombardment , ).
13
1ll.
EXPERIMENTAL
MoS 2 crystals used for the VLPS and ion-bombardment studies were natural molybdenite mined near Froland, Norway, and purchased from Ward's Natural Science Establishment, Rochester, NY.
For the photoelectron spec-
troscopic measurements, they were first prepared by being cleaved in air, mounted in the ultrahigh vacuum (UHV) system immediately and evacuating the system, and then heated to -500 0 C, usually for -10 min, until no evidence of carbon or oxygen could be obtained with CLPS [i.e., Z0.05 monolayer (ML)].
After this treatment a 1 x 1 low-energy electron diffraction (LEED)
pattern was obtained.
For EELS, the crystals were cleaved under N2 or
argon and mounted in the UHV system without heating.
Auger spectroscopy
revealed no oxygen but some carbon (Z 0.2 ML) on the basal surface after
evacuating to -3 x 10⁻⁹ torr. Thin films of MoS 2 were prepared by rf sputter deposition according to procedures described in previous publications.17-19,23
Briefly, the depo-
sition system consists of a 152-mm (6-in.)-diameter target made by hotpressing MoS 2 powder (99.9% pure).
The substrates were 440C stainless
steel that were polished with 300-nm Al2 03 powder in a slurry and degreased with acetone and methanol imediately before being inserted into the sputtering chamber and subsequent pumpdown. system was -1 - 10-6 torr.
The base pressure of the vacuum
The target-to-substrate distance was 36 mm;
argon sputtering-gas pressure was -2 x 10- 2 torr; and power density was
1.93 X 10⁴ W m -2 , resulting in typical sputtering rates of 35-45 nm min -1 . The substrates were electrically grounded and had a bias voltage of 0 V. The degree of cleanliness, specifically, the presence of water impurities in the sputtering chamber and in the target, has a large effect on the purity of the resultant films. 2 4 -2 6 For this reason, the target was presputtered onto a shutter over the samples for 2 h prior to film deposition in order to outgas the target and to permit the sputtering rate and stoichiometry to attain a steady state.
However, the presence of water on the
chamber walls can oxidize the films during deposition.
We used this fact
to obtain MoS 2 films with variable amounts of MoO 3 throughout their bulk.
15
Films were also deposited onto substrates maintained at different temperatures.
The substrate temperature was permitted to float during
presputtering and deposition; the substrates reached a temperature of -700 C.
Immediately after sputtering, the chamber was vented with Ar and
the samples were placed in desiccators over anhydrous CaSO 4 until x-ray diffraction (XRD) analysis could be performed.
Some samples were stored in
a chamber that contained a saturated aqueous solution of KBr to maintain a relative humidity of -85%.
Some film samples were annealed either in a
vacuum chamber with a base pressure of -5
x
10-8 torr or in a pure or
sulfur-doped Ar stream, for reasons described later in the report. EELS spectra were measured with a Perkin-Elmer PHI model 590 scanning Auger microprobe (SAM) equipped with a Varian model 981-2145 electron gun operated at 200 eV as the primary source.
The spectra are recorded as the
negative of the second derivative of the signal as a function of the analyzer pass energy. peak at 200 eV. mately 1 eV.
Loss spectra are displayed as shifts from the elastic The energy resolution of the EELS system was approxi-
The MoS 2 (0001) surface was ion-bombarded by backfilling the
vacuum chamber with argon or neon to a pressure of 1 x 10⁻⁵ torr and using the ion gun of the SAM operated at 1 keV.
Photoelectron spectroscopy (PS)
measurements were taken at beam line U8-B of the National Synchrotron Light Source at Brookhaven National Laboratory.
The energy of the excitation
source was selected with a toroidal grating monochromator, and the emitted electrons were detected and analyzed with a high-resolution ellipsoidal mirror analyzer. eV.
The overall energy resolution of this system was -0.3
All spectra were normalized with respect to the incident photon
intensity.
Ion bombardment was done in this system by backfilling the
chamber with 5 x 10⁻⁵ torr of Ar or Ne and sputtering with 1-keV ions. XRD analysis was done with a Phillips Electronics APD-3720 vertical powder diffractometer equipped for normal e-28 scans using Cu-Ka x rays (1.54-A
wavelength) according to procedures described in Ref. 18.
The
relative levels of oxidation of the thin films were determined by XPS with a McPherson model ESCA-36 equipped with a position-sensitive detection system. 17,27
16
IV.
A.
RESULTS AND DISCUSSION
VALENCE-LEVEL SPECTROSCOPY Angle-integrated VLPS spectra give an indication of the density of
states of the valence band averaged throughout the Brillouin zone.
Typical
electron energy loss and valence-level photoelectron spectra are displayed in Fig. 3.
Peak energies are given in Table 2.
Five peaks are observed in
the energy range from 0 to -8 eV below the elastic-peak position (EELS) and the Fermi level (VLPS) (although not all five are fully resolved in the EELS).
They are assigned to the appropriate MO energy levels according to The S 3s peak at 11-12 eV is isolated from these
the scheme in Fig. 2.
five peaks, in agreement with the postulate that there is probably no hybridization of S p and s orbitals and therefore no pL orbitals in the crystal. It is important to understand that an EELS spectrum involves atomic or molecular orbitals as both initial and final states, whereas in photoelectron spectroscopy the final state is a free electron.
Generally, an atomic
initial state (which is narrow and well isolated in energy from the valence band) can be used to map out the unoccupied states in the conduction band in an EELS experiment. determined previously
I0
Here, we use the conduction-band density of states using the S(2p) core electrons in MoS 2 .
The second
peak at 5.3 eV from the elastic peak involves excitation from one valence level, E", to the lowest empty conduction level (CB I) and from a higher valence level, A,
to a higher conduction level (CB II).1 0
Also, the exci-
tation cross sections are different between EELS and VLPS; therefore, changes in the EELS peaks with IB or substitution will not be quantita-
tively the same as for the VLPS peaks.
However, because the density of
states in the conduction band is greater near the Fermi level than it is at higher energies,1 0 , 12 the EELS spectra may be thought of as being qualitatively comparable to the VLPS spectra after appropriate alignment of the energy scales, as in Fig. 3.
17
EELS
0 -ELA
MO LEVELS
STIC PEAK
Ef 0 ?
~10-
E"
5 -- - --CD
Cl)r
C0
VLPS
--
10 u
J
15
25
Fig. 3.
Correlation of EELS and ULPS spectra of MoS2 (OOO1) with MO levels. Lines for EELS peaks represent transitions from indicated valence level to CB I, see Table 2.
18
TABLE 2.
PEAK ENERGIES AND ASSIGNMENTS FOR MoS 2 CRYSTALS
EELSb
VLPSa 1.
A;
2.5 eV
A; - CB I
2.
All
3.8 eV
3.
E"
5.1 eV
A' - CB1 II A" * CB I 2
4.
E'
5.8 eV
E"
CB II ?
5.
A;
7.1 eV
3.5 eV
1
5.3 eV
7.5 eV
E' & CB I A' E'
CB I C CB II
8.5 eV
apeak numbers refer to Fig. 4; term symbols are for levels from which valence electron is excited. bTransitions refer to electron excitation from valence level to either of two conduction-band levels.
See text and Ref. 10.
19
The VLPS spectra in Fig. 4 illustrate the dependence of the relative intensities of such valence-level peaks on the energy of the excitation source.8,29
Two aspects of photon energy dependence are important for
studies of surface chemistry and structure: (1) the variations in cross sections for different peaks, and (2) the variations in effective sampling depth as a function of excitation energy.
Cross-section variations with
photon (excitation) energy differ according to which orbitals of MoS 2 are contributing to the initial state that corresponds to the observed peak. For example, peaks derived primarily from Mo 4d orbitals exhibit a phenomenon known as a Cooper minimum (CM). 8
The CM is manifested as a
minimum in the relative intensities of such peaks as the excitation energy passes through a particular range.
Peaks derived from s and 2 orbitals
can exhibit CM, but for MoS 2 the minima would be well out of the pertinent energy range.
In Ref. 8, two peaks (numbered 1 and 5 in Fig. 4) were
reported to exhibit intensity minima relative to the other valence peaks for excitation energies in the 100- to 110-eV range; the authors used this fact to argue that peaks 1 and 5 involve ground-state energy levels that have major contributions from Mo 4d orbitals.
Because of the unsymmetrical
shape of the cross-section variation about the CM, the intensities of peaks 1 and 5 for 60-eV excitation energy (Fig. 4) are substantially greater than for 225-eV photons. These spectra also indicate that the relative intensity of peak 4 (and to a lesser extent peak 3) increases more with increasing excitation energy (up to -100 eV) than do the other four (three) peaks.
Following the logic
of Ref. 8, we could say that peaks 3 and 4 involve energy levels derived primarily from S 32 orbitals--an observation that is entirely consistent with the MO model of the MoS2 electronic structure and provides information for the assignment of the different MO energy levels (see Fig. 2). The second aspect of photon energy dependence, variations in effective sampling depth when different excitation energies are used, results because the emitted electrons for different spectra have different kinetic energies (KE). Thc lowest-energy peak for MoS 2 (peak 1 in Fig. 4) is only 2.5 eV below the Fermi level; these photoelectrons have KEs just slightly less
20
4
3-
(d)
225 eV
2 - (c)
152 eV
1 -
(b)
0-
(a)
e
60 eV 5432 1
-1
Fig. 4.
I1
15
10 5 BINDING ENERGY (eV)
Ef
Variation in VLPS peaks with excitation photon energy. (The two peaks at binding energies of approximately 7-9 eV in spectrum c are S 2s core-level peaks produced by second order excitation.)
21
than that of the excitation source.
The escape depths for electrons with
KEs ranging from approximately 40 to 60 eV (as in Figs. 3 and 4a) is 0.35 nm, corresponding approximately to one S-Mo-S sandwich, whereas those with 225-eV KE (as in Figs. 4b through d and 6) escape over a depth of about 0.7 nm that includes approximately two sandwiches (see Fig. 1).
(For these
calculations we used the formula given in Ref. 30 with the pertinent parameters for MoS 2 .) B.
ION BOMBARDMENT The effects of ion bombardment (IB) of the MoS 2 (0001) surface on sur-
face composition and relative energy-level populations are shown in Figs. 5 through 7.
Changes in the core-level spectra (Fig. 5) reveal two primary
chemical effects:
the preferential depletion of sulfur and the formation
of molybdenum metal. 2 1 ,2 2
In both VLPS and EELS measurements of the va-
lence band, the intensities of the two lowest-energy peaks are diminished relative to the other nearby peaks after the bombardment (Figs. 6 and 7). Also, the intensity of the S 3s peak is decreased, especially in the EELS spectra, in agreement with the reduced S:Mo ratio determined from the corelevel peaks. The effects of low levels of IB on the valence levels of MoS 2 are more obvious for low-energy excitation that probes only the first S-Mo-S sandwich (Fig. 6B).
One chemical effect of the bombardment is to preferen-
tially remove sulfur, creating sulfur vacancies, although some Mo metal and polysulfide ions are also formed. 3 1
The sulfur presumably escapes with its
valence electrons either as atomic or ionic sulfur.
The basic TP geometry
is at least partially maintained in the absence of some sulfur, since there is evidence that the S:Mo ratio in thin films can get as low as 1:1 while the 2H structure remains intact. 3 2
Therefore, as electrons are depleted
from the lower sulfur-derived MO levels, those in the upper d levels, A' and Al,
cascade down to
fill the holes.
The net effect is that the elec-
tron occupancy of the primarily S 2 derived levels, E" and E', remains essentially unchanged, whereas that of the uppermost levels, A, and A", is reduced.
22
AFTER
BEFORE
I I 234
232
I
I
I
230 228 226 BINDING ENERGY (eV)
I
I
1
224
168
166
(a)Mo-3d Fig. 5.
I
I
I
164 162 160 BINDING ENERGY (eV) (b)S.2p
Core-level peaks for MoS (0001), showing (a) Mo and 15 (b) S peaks 2 before and after bombardment with 5 x 10 Ne ions cm The new No peaks are in the direction for Mo metal, whereas those for S are probably for polysulfide. (Peak intensities cannot be compared for the No and S spectra because different photon energies were used and the normalization procedure could not correct for these differences.) 23
I 158
5 43 21
5 4 321
(a)) M((b
15
Fig. 6.
10 5 BINDING ENERGY (6V) A
(d)
(C)
(e)
(d)
Ef10
5 E BINDING ENERGY (6V) B
ULPS peaks for MoS 2 (0001), showing the effects of IB with: (A) 14keV Net, 22 eV excita tior--(a) initjaJ, (b) 2 x 10 , (c) 1 : 10 , (d) 5 x 10 5 ions cm- , and (e) after annealing to 750 t 50*C; and (B) 0.5-keV N+, 22.14-eV excitation--(a) initial, (b) 5 s, (c) 10 s, and (d) 300 s (no flux given, Ref. 29).
214
L~j
-o
PEAK ELASTIC 20
Fig. 7.
0 10 ENERGY LOSS (eV)
EELS peaks for NoS2 (OOO1), showing the effect 1 of lB withA~-keV Ar*: (a)1 initial, (b) l 1 go and (e) 2 x 0O ions cnf2 (c) 1 x 10 , (d) 3 x 10
25
The ion-induced reduction in the relative intensities of peaks 1 and 2 is large for the lower-erergy excitation (Fig. 6B), and somewhat less for the submonolayer doses of ions when two or more sandwiches are sampled with the higher-energy excitation in Fig. 6A.
The effects of such low ion doses
apparently are emphasized in the outermost sandwich layer; such emphasis promotes very selective surface modification for creating bonding sites. Higher doses of ions cause broadening of the low-binding-energy side of the VLPS peaks, consistent with the formation of a higher metallic content of the surface. ways:
The metal formation can distort the spectra in two
It convolves the metal valence-level peaks with those of the semi-
conductor, and it causes metal atoms 20 to donate electrons into the valence levels of the MoS 2 (Schottky-barrier formation) to partially replenish the empty orbitals created by sulfur removal. The MoS 2 valence-level peaks become well defined again after annealing of the heavily bombarded surface, and the Mo metal band edge is slightly separated (Fig. 6A).
Our preliminary interpretation of these observations
is that metal atoms are well dispersed within the surface region as a result of IB and that annealing causes these atoms to agglomerate into islands coexisting with highly disordered MoS 2 . The tribological consequence of modifying the MoS 2 (0001) surface is that the adhesion of this surface to appropriate substrates can be improved for deposited films.
Formation of sulfur vacancies and molybdenum clusters
during film deposition may enhance adhesion.
But other possibilities are
suggested by the MO model; specifically, the incorporation of substituent atoms into the S vacancies--atoms that could hybridize to form bonds to the MoS2_ x surface and also to the substrate atoms (i.e., should provide interfaces with strong adhesion.
bridge bonding)--
The coordination geometry
of the S vacancy indicates that a substituent that prefers octahedral (0h ) coordination could satisfy bonds within the MoS 2 and have orbitals available for substrate bonding.
Such a substituent would need d orbitals
available for d2 sp3 hybridization and fewer electrons in its configuration (than that for S of MoS 2 ) to accommodate electron donation from metallic
26
substrates.
Candidates for effective substituents include elements to the
left of and at least one row below sulfur in the periodic table.
Possible
evidence for beneficial substituent effects is provided by empirical studies in which rhodium or nickel (both disposed toward Oh coordination) was predeposited 33 or codeposited, 34 respectively, and was foUnd to improve the friction and wear performance of sputtered films. C.
CRYSTAL STRUCTURE
Polycrystalline, sputter-deposited films of MoS 2 are used extensively for lubrication in vacuum environments, such as those for aerospace applications.17,26,34-37
Properties of the crystallites that compose the films--lattice spacing, aspect ratio (of the edge surface to basal surface
areas), orientation, and size--determine the films' lubrication performance; that is, their friction, wear, and reactivity toward oxidizing environments.
15
These crystal structural properties can be determined by x-ray diffraction measurements, together with surface analysis techniques and electron microscopy, even for thin films (200 to 1000 nm). Typical XRD data for MoS 2 _ilms on stainless-steel substrates are shown in Fig. 8. These scans, expanded around specific reflections, were obtained by counting the x-ray signals for long periods with the diffractometer set in the region of a specific reflection.
Full e-28
scans of as-prepared films
manifest only two significant reflections--those for the (100) and the (110) planes; there is no evidence for (001) reflections.1 8
The geometry
of the analysis is such that only reflections from planes parallel to the substrate surface will be detected.
Therefore, these films were deposited
with the basal crystal surfaces perpendicular to the plane of the substrate surface, the exact opposite of the desired configuration for low shear and good lubrication.
The films probably grow with this crystal orientation
because of the strong chemical bonding between the active sites on the edge [(110) or (100)] planes and those on the substrate (e.g., adsorbed H2 0 or
OH-).
27
S-
cv(c
32 Fig. 8.
33
34 20
35
36
XRD scans of the (100) peak for sputter-deposited MoS 2 films: (a) impure, (b) impure annealed, (c) pure, (d) pure annealed, (e) pure, and (f) pure oxidized by 10 months' storage at 85% RH.
28
Figure 8 indicates that at least two different species with the MoS 2 crystal structure can be formed during sputter deposition.
The species
with (100) d-spacing of 0.261 nm (curve a) was prepared prior to thorough outgassing of the sputtering chamber and target.
XPS analysis reveals the
presence of Mo(VI), and Auger depth profile analysis indicates elevated oxygen concentrations throughout the film.
Annealing converts major por-
tions of these films into a species whose d-spacing (0.265 nm) is closer to that of crystalline molybdenite (natural MoS 2 , d = 0.273 nm).
Species with
almost identical d-spacing (0.265 nm) were prepared when the sputtering chamber was thoroughly outgassed (curve c), and these purer species were not affected significantly by 500*C annealing.
Finally, intentional oxi-
dation of the pure material (curve f) reduced the amount of crystalline MoS 2 but did not convert it into the impure crystalline material. Crystalline MoSx of variable stoichiometry and purity can be formed during sputter deposition.32 ,38
Such materials appear to maintain the 2H
crystal structure but with varying degrees of strain in the lattice.
The
purest material that we have made has an approximate 3.6% compression along the direction.
Although not detectable for as-prepared films, rubbed
(worn) films, whose orientation changes with rubbing, show a comparable expansion in the direction.
Films with a slight excess in S, over
the stoichiometric amount, provide better overall lubrication, represented 2 3 ,38 by lower friction and longer wear life. We propose that changes in lattice spacing within the MoS x crystallites are due to variations in electron density around the Mo atom and specifically to changes in the population of the nonbonding Aj (primarily Mo dz2) orbital.
Oxygen substitution for sulfur within MoS 2 crystallites
removes electron density from this orbital that is spatially directed between S atoms above and below the Mo in the trigonal prism (see Fig. 2). Removal of electron density from this orbital does not change bond order (the electrons are nonbonding), and therefore bond length, but does reduce repulsion between dz2 electrons and S electrons.
This reduced repulsion
permits S-S in-plane distances to be reduced, which allows for compression
29
along directions perpendicular to edge planes and expansion in the basal direction.
Such oxygen substitution must occur throughout the interior of the individual crystallites, as happens during deposition in the contaminated souttering chamber. tion.)
(The crystallites have a high defect concentra-
Postdeposition oxidation, during storage in a humid atmosphere at
room temperature, apparently creates layers of amorphous oxide on the edge surfaces of the crystals that have no effect on the internal electron densities and thus on the lattice spacings of the remaining MoS 2 .
Annealing
of the impure material in vacuum or an inert atmosphere can cause two changes:
sublimation of oxidized (MoO3 ) material, and crystallization of
amorphous MoS 2 . In contrast to oxidized sputtered films, the opposite changes in lattice spacings were observed 3 9 for alkali metal intercalation of NbSe2 . Niobium, having one less d electron than molybdenum, can be readily intercalated with alkali atoms that ionize by donating an electron to the halffilled Nb dz2 orbital.
Extended x-ray absorption fine structure (EXAFS)
measurements have shown that the intercalated material is expanded in the edge directions and contracted in the basal direction with no change in Nb-Se bond length. Expansion of the trigonal prismatic lattice in the basal direction has been associated with reduced friction for various materials. 2
On the basis
of the XRD measurements reported here, and with the aid of the MO interpretation, we predict that substitution within the MoS 2 lattice, during preparation, of electron acceptor-type dopants (of which oxygen is a special case) will reduce the friction below that of the parent pure material. There is evidence that slight oxidation of sputter-deposited MoS2 lowers its friction coefficient, 3 2 and films with slightly elevated S:Mo (greater than 2) ratios have measurably lower friction coefficients than stoichiometric or sulfur-deficient films. 3 8
Another system predicted to have im-
proved lubrication properties is MoS 2 films that have a small percentage of Nb substituted for the Mo.
30
The ideal lubricant film should be one that adheres well to the substrate material and that has the lowest possible friction.
Substitution of
some sulfur by another species within the interface region has already been mentioned for improving adhesion. Arsenic might be an appropriate substituent, since it would be an acceptor for some metal electron density; but the precise property that makes it good for adhesion at the interface, its ability to hybridize using d orbitals, would probably encourage interlayer bonding and thus increase friction within the bulk of the film.
Instead,
an appropriate substituent within the bulk film for reducing friction would be phosphorus, an acceptor that does not have d orbitals available for hybridization and bonding.
The preparative task for achieving the best
possible lubricant material will be to control interface and bulk compositions independently.
The value of studying the electronic structure of
solid lubricant materials and using this information to design new or modified lubricants cannot be overstated.
31
V.
SUMMARY AND CONCLUSIONS
A qualitative molecular orbital model, based on D3 h symmetry and periodic repetition of the Mo(S) 6 unit within the MoS 2 crystal, agrees well with the results of spectroscopic measurements of valence-level transitions and can be used to interpret crystallographic variations in MoS 2 thin films.
This model
involves a total of seven valence-level molecular orbitals, six of which form the bonds bz-ween the central Mo and the six S atoms and one of which is considered to be nonbonding.
Such an interpretation contradicts the model
based on augmented-spherical-wave calculations, wherein the uppermost state was assigned as an antibonding (dz2) state with support derived from photochemical studies. 13
Our assignment of the highest filled level as a nonbond-
ing level appears to be more physically realistic, because it results in a net bond order around the central Mo of six, a situation that is not realized with the alternative assignment.
Our assignment provides explanations of spectro-
scopic and crystallographic data and can be used to predict substitution chemistry for improving lubrication properties.
33
REFERENCES
1.
Jamison, W. E. ASLE Trans. 1972, 15, 296.
2.
Jamison, W. E. "Proc. 3rd ASLE Int. Solid Lubr. Conf."; Denver, CO, ASLE SP-14, 1984; p. 73.
3.
Friend, R. H.; Yoffe, A. D. Adv. Phys. 1987, 36, 1.
4.
Fisher, D. W. Phys. Rev. B 1973, 8, 3576.
5.
Williams, P. M.; Shepherd, F. R. J. Phys. C: Solid State Phys. 1973, 6, L36.
6.
Haycock, D. E.; Urch, D. S.; Wiech, G. J. Chem. Soc., Faraday Trans. 2 1979, 75, 1692.
7.
McMenamin, J. C.; Spicer, W. E. Phys. Rev. B 1977, 16, 5474.
8.
Abbati, I.; Braicovich, L.; Carbone, C.; Nogami, J.; Lindau, I.; Del Pennino, U. J. Electron Spectrosc. Relat. Phenom. 1986, 40, 353.
9.
McGovern, I. T.; Childs, K. D.; Clearfield, H. M.; Williams, R. H. J. Phys. C: Solid State Phys. 1981, 14, L243.
10.
Koma, A.; Enari, K. Inst. Phys. Conf. Ser. No. 43 1979; Ch. 25, p.
895. 11.
White, R. M.; Lucovsky, G. Solid State Commun. 1972, 11, 1369.
12.
Coehoorn, R.; Haas, C.; Dijkstra, J.; Flipse, C. J. F.; deGroot, R. A.; Wold, A. Phys. Rev. B 1987, 5, 6195.
13.
Coehoorn, R.; Haas, C.; deGroot, R. A. Phys. Rev. B 1987, &, 6203.
14.
Gu, Z. ASLE Trans. 1982, 25, 207.
15.
Fleischauer, P. D. Thin Solid Films 1987, 154, 309.
16.
Stiefel, E. I.; Eisenberg, R.; Rosenberg, R. C.; Gray, H. B. J. Am.
Chem. Soc. 1966, 88, 2956. 17.
Fleischauer, P. D. ASLE Trans. 1984, 27, 82.
18.
Lince, J. R.; Fleischauer, P. D. J. Mater. Res. 1987, 2, 827.
19.
Fleischauer, P. D.; Bauer, R. Trib. Trans. 1988,
35
1, 239.
20.
Lince, J. R.; Carre, D. J.; Fleischauer, P. D. Phys. Rev. B 1987, 36, 1647.
21.
Lince, J. R.; 805.
22.
Lince, J. R.; Fleischauer, P. D. J. Vac. Sci. Technol. A 1987, 5, 1312.
23.
Fleischauer, P. D.; Bauer, R. ASLE Trans. 1987, LO, 160.
214.
Buck, V. Wear 1983, 91, 281.
25.
Buck, V. Vacuum 1986, 36, 89.
26.
Buck, V. Thin Solid Films 1986, 139, 157.
27.
Bertrand, P. A.; Kalinowski, W. J.; Tribble, L. E.; Tolentino, L. U. Rev. Sci. Instrum. 1983, 514, 387.
28.
Stewart, T. B.; Fleischauer, P. D. Inorg. Chem. 1982, 21, 24126.
29.
Hu, Y.-J.; Lin, Z.-d.; Wang, C.-h.; Xie, K. Acta Phys. Sin. 1986, L5, 50.
30.
Tanuma, S.; Powell, C. J.; Penn, D. R. Surf. Sci. 1987, 192, L8149.
31.
Lince, J. R.; Stewart, T. B.; Hills, M. M.; Fleischauer, P. D.; Yarmoff, J. A.; Taleb-Ibrahimi, A. Surf. Sci. 1989, 210, 387.
32.
Dimigen, H.; Hubsch, H.; Willich, P.; Reichelt, K. Thin Solid Films
Carre, D. J.; Fleischauer, P. D. Langmuir 1986, 2,
1985, 129, 79. 33.
Niederhauser, P.; Maillat, M.; Hintermann, H. E. "Proc. Ist European Symp."1 Space Mechanisms and Tribol.; Neuchatel, Switzerland, 12-114 October 1983; ESA SP-196 1983, 119.
34.
Stupp, B. C. Thin Solid Films 1981, 84, 257.
35.
Spalvins, T. Thin Solid Films 1982, 96, 17.
36.
Spalvins, T. Thin Solid Films 1981, 118, 375.
37.
Christy, R. I.; Ludwig, H. R. Thin Solid Films 1979, 64, 223.
38.
Roberts, E. W. "Proc. 20th Am. Mechanisms Symp."; NASA Lewis Research Center, Cleveland, OH; 1986, p. 103.
39.
Bourdillon, A. J.; Pettifer, R. F.; Marseglia, E. A. Physica
36
LABORATORY OPERATIONS The Aerospace Corporation functions as an "architect-engineer" for national security projects, specializing in advanced military space systems. Providing research support, the corporation's Laboratory Operations conducts experimental and theoretical investigations that focus on the application of scientific and technical advances to such systems. Vital to the success of these investigations is the technical staff's wide-ranging expertise and its ability to stay current with new developments. This expertise isenhanced by a research program aimed at dealing with the many problems associated with rapidly evolving space systems. Contributing their capabilities to the research effort are these individual laboratories: Aerophysics Laboratory: Launch vehicle and reentry fluid mechanics, heat transfer and flight dynamics; chemical and electric propulsion, propellant chemistry, chemical dynamics, environmental chemistry, trace detection; spacecraft structural mechanics, contamination, thermal and structural control; high temperature thermomechanics, gas kinetics and radiation; cw and pulsed chemical and excimer laser development, including chemical kinetics, spectroscopy, optical resonators, beam control, atmospheric propagation, laser effects and countermeasures. Chemistry and Physics Laboratory: Atmospheric chemical reactions, atmospheric optics, light scattering, state-specific chemical reactions and radiative signatures of missile plumes, sensor out-of-field-of-view rejection, applied laser spectroscopy, laser chemistry, laser optoelectronics, solar cell physics, battery electrochemistry, space vacuum and radiation effects on materials, lubrication and surface phenomena, thermionic emission, photosensitive materials and detectors, atomic frequency standards, and environmental chemistry. Electronics Research Laboratory: Microelectronics, solid-state device physics, compound semiconductors, radiation hardening; electro-optics, quantum electronics, solid-state lasers, optical propagation and communications; microwave semiconductor devices, microwave/millimeter wave measurements, diagnostics and radiometry, microwave/millimeter wave thermionic devices; atomic time and frequency standards; antennas, rf systems, electromagnetic propagation phenomena, space communication systems. Materials Sciences Laboratory: Development of new materials: metals, alloys, ceramics, polymers and their composites, and new forms of carbon; nondestructive evaluation, component failure analysis and reliability; fracture mechanics and stress corrosion; analysis and evaluation of materials at cryogenic and elevated temperatures as well as in space and enemy-induced environments. Space Sciences Laboratory: Magnetospheric, auroral and cosmic ray physics, wave-particle interactions, magnetospheric plasma waves; atmospheric and ionospheric physics, density and composition of the upper atmosphere, remote sensing using atmospheric radiation; solar physics, infrared astronomy, infrared signature analysis; effects of solar activity, magnetic storms and nuclear explosions on the earth's atmosphere, ionosphere and magnetosphere; effects of electromagnetic and particulate radiations on space systems; space instrumentation.