eraiir
Issue
>
In
CD
Imme
Z5.
C
Z
1U-n
Load-Centered Power Generation in Burbank, Glendale, and Pasadena: Potential Benefits for the Cities and for California 004094 Mark Bernstein, Paul Dreyer,Mark Hanson, and Jonathan Kulick For the first two years after California deregulated the state's electricity sector, the restructured system seemed to work as intended-consumers and businesses paid less for electricity in the new competitive marketplace. But in the summer of 2000, the prices on the spot market for electricity spiked, the cost of power increased tenfold, and the first power shortages appeared, culminating in rolling blackouts during the following winter, More than 30 days of rolling blackouts were predicted statewide for the summer of 2001, with shortages during peak times estimated at 5,000 megawatts-or about 8 percent of demand. There is the potential for continued price spikes and shortages through the winter of 2002 and possibly through 2004 if demand materialize. strong and current capacity expectations do notremains About one-quarter of all demand for electricity in California is met by publicly owned utility companies that were not subject to the 1998 deregulation. Three of thesethe municipal utilities in the cities of Burbank, Glendale, and Pasadena-are pursuing a broad-based portfolio of energy generating resources to protect them from the problems that plague the system as a whole. They are looking hopefully at a generating strategy called "loadlookng genratng opefllyat sratgy alle "lad-
centered generation" (LCG) that would make the cities
less vulnerable to upheaval on the electricity markets and allow them to not only meet their own needs but also sell power out of their service territory, thus adding capacity to the state system. LCG is theagenean
ofpoweneath
e
rof
demand, or "load," and represents the middle ground
between conventional central station generators and the emerging paradigm of distributed generation. The LCG strategy calls for the utilities to install new, natural-gasfired generators on the sites where they now have steam and combustion turbines. The three cities are hoping to receive incentives from the state to help them fund the new plants and bring them online quickly. RAND helped the utilities examine the value of the
new plants within the context of California's continuing energy problems, reviewed and summarized the literature related to LCG, and constructed statistical models of the electricity market and of the potential cost savings the new plants might provide. The benefits of LCG can be considerable. Because LCG power is generated close to the load and transmitted along low-voltage distribution lines, it can reduce the strain on California's already overstressed transmission grid and
RAND issue papers explore topics of interest to the policymaking community. Although issue papers are formally reviewed, authors have substantial lati-
tude to express provocative views without doing full justice to other perspectives. The views and conclusions expressed in issue papers are those of the authors and do not necessarily represent those of RAND or its research sponsors. © Copyright RAND 2001.
improve reliability. Local customers would be less vulbe bought on the spot market and that the pricing for elecnerable to natural disasters, power losses along the grid tricity will be based on generation costs, which are based (approximately 1 percent per 100 kilometers), and transon natural gas and emissions prices plus the capital costs mission line failures such as the January 21, 2001, suband operating and maintenance costs for the plants. station failure in Oregon that caused 20 minutes of rolling We modeled the cost of two types of new generation blackouts in Northern California. We did not attempt to in California-the first from the plants in Burbank, Glenquantify these benefits in this report, but the literature valdale, and Pasadena, and the second from other, mostly priues reliability at $60 to $60,000 per megawatt-hour (MWh) vate, natural-gas-fired plants projected by the California and savings due to deferrals of transmission line investment at ~h.Energy 10 t $70per Commission (CEC) to come online in the near ment at ~h.future. 10 t $70per For the latter group of plants, we made adjustLCG would also reduce California's vulnerability to ments for differentials in capital costs and for transmission power recalls by out-of-state generators. With nearby losses that would occur if the new plants are located far states growing even faster than California, out-of-state from their load. To capture these losses, we increased the generators that have traditionally provided power to Caliprice to reflect the additional generation required to meet fornia may be selling that power in their own states. In demand. some states, such as Utah, even power already contractedToesrthtwcauedhemtlilyfue to ubjet Clifrniais t reall n tmes f ned.scenario for the value of the new generation, we ran modIn. addition, generators owned by residents keep els for a variety of natural gas prices, emissions credits capital and investment within the state and provide revprices, and rates of growth in demand. We also considered enue through taxes and employment. In discussing the whether the utilities would run duct burners during the electricity markets and prices in California, the Federal summer and winter, which would increase the output of Energy Regulatory Commission (FERC) has declared that the plants but also reduce efficiency and increase em-issions. the electricity markets have been dysfunctional; yet untilAlhuhntalhebefsasoiedwhlarecently the FERC has chosen to take no regulatory action Alnthoudghenertot allte beaneifits associatredorwitheloteadto improve the way the market functions. Increasing the ceteredgienoeratindaresqantinofie ntieot mantd the loeeitera amount of in-state electricity and selling it at cost-based itur giessoefnerstandinthaitwlbeoe ofget magnitudeaofsbnefit rates can help counter limited federal actions by increasing itpoffrstand suggets thatlitorwills bnecgorflome an incrasigly supply, improving competition, and moderating prices in imotnpatfClfriasergprflo.Tecuae the development of LCG, California can do the following: California markets. * Streamline the approvals process to bring new generaae cnsieraly ceanr tan he The ropsedplats to niemr ail turbines now on the sites, potentially reducing the amount a Provide financial incentives such as low-interest loans, the utilities pay for emissions credits and, at least theoretistate-backed bonds, and long-term state contracts or be will new plants that the cally, increasing the chances investments acceptable to an environmentally sensitive public, msin rdt 0Poiegetrfeiiiyo Guarantee the purchase of excess capacity. *
The most persuasive argument in favor of the new plants came to light with the mathematical models that were constructed to determine the impact the new generators would have on California's wholesale power prices. Under a reasonable set of assumptions for the future, the new plants could provide savings for California between $466.7 million and $584.9 million over the period 2002 to 2011. Running duct burners' on the base load plants during the winter and summer increases the total value of the generation by about 10 percent, but decreases the savings per MWh of new generation.
CLFRI'
The potential value of the new generation that would be supplied by the new plants in Burbank, Glendale, and Pasadena must be considered within the context of the ongoing energy problems in California and the western region of the United States. In 1998, the California electricity system was restructured with the intent of making the electricity markets competitive. As privately owned utilities began to face competition in the generation of electricity, they were encouraged to sell their generation assets, and most of them did. For the first two years, the restructured system to work as intended. But predictions for the summer of 2001 foresee at least 30 days-or as many as 60 days-of rolling blackouts. California and the rest of the
In. developing the models, RAND considered several variables and made several assumptions. It was assumed that in the near future only a small amount of power will __________seemed
1
NRYISE
A duct burner reburns exhaust coming from the turbine and uses the additional
heat to produce more energy.
2
F
western region are also likely to see significant price spikes and (continuingbase price increases that may continue into next summer, too.
__
1.6 1.5
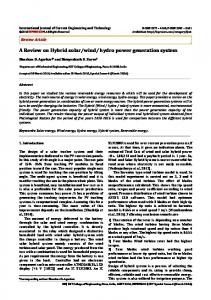
The inability of California's electricity system to satisfy 1.4Generating Cpct demand is indicated by the increased number of alerts, warnings, and emergencies issued by California's Indepen1. dent System Operator (ISO). Figure 1 shows how the prob1.2 -Electricity Demand lem has manifested itself since the beginning of electricity deregulation in 1998. Each bar in the figure represents a 1.1 -Negotiations Deglain Beeguaions: Begin N,,: one-month period during the season and year indicated. An emergency is categorized into one of three stages 11 LI 19520 1980 19519 depending on the amount of reserve generation that isNoeIneofcpitaddmndn Nt:Idxo aaiyaddmn n18 available to the state system. As the system enters a Stage 3 emergency, plans are made for rolling blackouts, and they Figure 2 -Indexed Supply and Demand in California2 are instituted as demand exceeds available generation. (Source: CEC) 35 30 -o
Not only is the state in need of additional new capacity, much of the existing capacity is in need of replacethe caaiyin ment. More than 40 pretof capacity1 California pecn is more than 40 years old (and 13 percent is more than 50 years old). These plants are no longer capable of producing power at full capacity 24 hours a day, and they are sig-
Stage 3 tg MWarnings o Alerts
0 25 .E
W
20>
-6 15 Z5 Z
nificantly less efficient and pollute more than new plants. 5
-Conditions MMna.
rlI111IIN
0
WitrSme
98
98
of tight supply are not limited to Calif orm Population and commensurate energy demand have grown even faster in other western states than they have in California, and demand in those states has also outpaced capacity. For example, the population of Nevada has grown by more than 50 percent in the past ten years without commensurate growth in generating capacity.
itr 99
SmmrWne
99
00
umrWne 01 00
Figure 1 -California ISO Alerts, Warnings, and Emergencies
I The supply of electricity is tight in California because demand has grown without a commensurate increase in supply. Lack of rainfall in the Pacific Northwest has reduced the amount of hydroelectric power that is available for California to import. Old plants in need of replacement are not operating at full capacity. Uncoordinated and unregulated scheduling of repairs and maintenance has also reduced supply. priorec
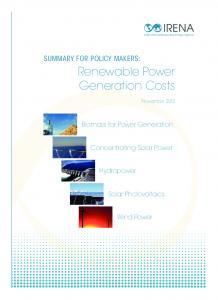
Supply constraints have led to price increases and spikes that never occurred before in these markets. In the first two years of deregulation, maximum prices in the wholesale markets averaged less than $10 per MWh, with occasional spikes as high as $200 per MWh. In the summer of 2000, however, prices reached almost $1,000 per MWh and averaged a high of almost $200 per MWh throughout the summer. The following winter, when demand is typically at its lowest in California, prices spiked even higher to more than $1,500. Figure 3 shows recent price trends of
minteanc wa plnne to Prio todergultio, was plannuedtor mainsytenance toe dreglabltion,
times when demand was low. In the restructured system, private generators can schedule maintenance, and shut down generators in order to accommodate it, on their own schedules. In addition, some utilities are not being paid and cannot keep generating. Finally, growth in capacity has not kept up with demand. Figure 2 compares the growth rates of generating capacity and electricity demand. Whereas California is not short on available capacity, the reserve margin is considerably smaller than it has been
eetiiyprhsdi
historically. The growth in demand that California has
2
aiona
Natural gas shortages and the accompanying price spikes are also part of the energy crisis in California and the other western states. At the same time that electricity prices were fluctuating and spiking, so were natural gas prices (see Figure 4). In fact, the increase in natural gas
The value for each year shown in Figure 2represents the ratio of the supply (or demand) for that year compared with the supply (or demand) in 1980. The intersec-
experienced ovrthe past five years cannot be sustained over without new capacity coming online soon.
tion of the two curves around 1996 does not imply that demand exceeded supply from that point onward.
3
1600 1400 -as 1200 -
1998
1999
times. There are likely to be price spikes during this period well. While new generating capacity is planned and under
2000
-~1000
3ý800 -construction
in California, there may not be enough electo meet the state's needs in the summer of 2001. The CE1C estimates that between 7,000 and 12,000 MW of new
iitricity
~ 600 400 -li 200 -i'1Ar 11__-0 0 C A4_ Apr Jul Oct Jan Apr 98 98 98 99 99
Jul 99
generation might be available by 2003 (see Figure 5). If this generation becomes available by 2003, many, but not all, of
:=1
ý
Oct"Jan Apr 99 00 00
Jul 00
the current supply problems may be alleviated.
Oct Jan 00 01
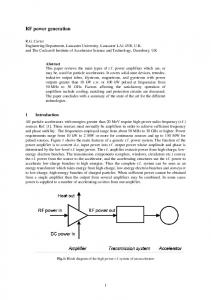
In an effort to be conservative, we use the higher CEC estimate of about 12,000 MW of new generation online by 2003 in our analysis, but it is more likely that this amount will not be built until after 2003. As illustrated in Figure 5, "Rapid" and "Cautious" are two growth rate scenarios that the CEC proposed. For the cautious scenario, the same amount of generation comes online as in the rapid scenario, but much of it comes online at a later date.
Figure 3 -Maximum Daily Electricity Prices on the California Power Exchange
prices that was seen in the winter of 2000 contributed to the increase in electricity prices. It is also possible that rising electricity prices allowed natural gas prices to rise further. While prices in the natural gas markets have recently stabilized at approximately $9 per million British thermal
1,0
units (MMBtu), these prices are four to five times higherI
than they were throughout the 1980s and 1990s. It is likely that the natural gas markets, which have been deregulated for 30 years, will stabilize more quickly than electricity markets. Most forecasts have prices stabilizing at about $5 to $6 per MMBtu, still about double their historic levels.6,0
10,000 8,000
0 C(D600 0)
$36.774,0 2000
$29.92
SoCal Border 2002
$23.07 -2001
2003
2004 2005
SRapid
2006
2007
2008
2009
f-Cautious
S$16.22
Figure 5-Estimates of New Electricity Generation in California CEC)
$9.37 -(Source: rHenry Hub
Furthermore, much of the new generation is located
$2.521 1
inNrhnCafoiwicmestatrnmsin inNrhnCafoiwicmestatrnmsin
Feb Mar Apr May Jun Early Late Aug Sep Oct Nov Dec Early Late Feb 00
00
00
00
00
Jul
Jul
00
00
00
00
00
00
00
Jan Jan
01
capacity will be a critical factor in determining how much of this new generation can alleviate power problems throughout the state. Rolling blackouts in Northern Cali-
01 01
Fiue4-Weekly Spot Market Prices for Natural Gas at Fiouthre
aionaBre ndHnyHboiin
fornia in the winter of 2000 to 2001 were partially due to
(Source: Natural Gas Weekly)
the fact that the transmission line between Southern and Northern California (Path 15) was at capacity. It is important to note that new generation is not evenly distributed
If current projections of supply and demand turn out
throughout the state, and that without addressing the current transmission bottleneck between Northern and Southern California, more generation located in Southern California may be necessary to meet local demands. This suggests that there may be a value to siting new generation in Southern California.
to be true, electricity and natural gas shortages in California and the rest of the West are likely through the winter of 2002 and possibly through 2004. The total peak demand for California in the summer of 2001 is expected to be around 60,000 megawatts (MW), and some estimates expect a shortage of as much as 5,000 MW during peak 4
MODELING THE POTENTIAL VALUE OF NEW GENERATION
Metrics
To determine the impact of this new municipal generation on wholesale power prices, we developed a model that simulates the potential operation of the electricity market in 2002 and beyond. The essential elements of the model are described in this report; more details are available on request.'
0 Value per MWh Levers Bulgerainont Bulgerainont 0 Run duct burners or not Uncertainties
Generation in Burbank, Glendale, and Pasadena
0
Natural gas prices
Currently, Burbank, Glendale, and Pasadena have approximately 500 MWV of local generating capacity. However, due to fuel and /or emissions constraints, much of it runs only part time and provides energy only during peak periods or in emergencies. The cities fulfill most of their electricity needs through partial ownership of other generating facilities and long-term contracts with remote
*
0
NOx credit prices Demand
*
Supply curves
0
Total value of reduced cost to the grid
Assumptions 0Itrs ae
ae
*Itrs
0
generators.
*
The proposed new generation will come from four base load plants (GE 7FA) to run nearly full time and eight smaller peaking units (LM6000 Sprint) to run during peak
*
-
n
aia
aia
ot
ot
Electricity market operation Cost of non-municipal generation
Transmission losses Amounts of "must-run" generation
0Oeaino
periods (primarily during the winter and summer). The peaking units are highly efficient, simple-cycle gas turbines
n
h h
*Oeaino
ulfigfclte ulfigfclte
Metrics define the measurable outcome of the model-
with a capacity of about 50 MW each. The base load units are larger, combined-cycle gas turbines with a capacity of about 250 MW each. These units will also be equipped with duct burners that can increase the capacity of each unit to about 300 MW, but in so doing decrease the fuel efficiency and increase emissions.
ing effort, defined here as the value of the new municipal generation in terms of the total cost savings over the next ten years (2002 through 2011), when the new generation is included in the electricity market versus when it is not. This value is given both in total dollars saved as well as dollars saved per IvWh of new generation.
Seasonal data on the energy output, costs, fuel use, and emidssions of each base load plant and each peaking plant by location were provided by Bibb and Associates. Much of the generation currently located in Burbank, Glendale, and Pasadena is 25 to 50 years old, has poor fuel efficiency, and pollutes more than most modern generation. The nitrous oxide (NOx) emissions of the proposed generation are considerably lower than almost all of the current generation located in the municipalities. The peaking plants are expected to come online in June 2002, and the base load plants in June 2004. Table 1 summarizes the
Levers describe choices or decisions to be made. In this analysis, there are two decisions: whether or not to build the new generation and whether or not to run duct burners on the new base load generators. The analysis compares the modeling results with and without the new municipal generation, and with and without the use of duct burners.
Current Local Generation
City
characteristics of the existing and proposed power plants in the three cities.
Glendale
Proposed Local Generation (Total Capacity)
Two combined cycle plants
One
Three steam units Two gas turbines (250 MW total)
Metrics, Levers, Uncertainties, and Assumptions of the Model
Burbank
A number of outcome measures, levers or decision
points, uncertainties, and critical assumptions were essen-
Psdn
tia odein vaiabesin aproah:Two ur
3
(Total Capacity)
For further information about the model, contact Paul Dreyer at
[email protected].
Two steam units Three combustion turbines (161 MW total) he
ta nt combustion turbines (183 MW total)
GE 7FA unit Five LM6000 Sprint units (500 MW total)
Two GE 7FA units (500 MW total) n E7Aui Three LM6000 Sprint units (400 MW total)
Table 1 - Current and Proposed Municipal Generation
5
It was necessary to make a set of assumptions in the analysis. We assumed that the capital costs of the plants will be handled by a low-interest (5 percent) loan over 20 years, that a payment for the loan is made each hour the plants are running (every hour of the year for the base load plants, and every hour during the summer and winter for the peaking plants), and that operating and maintenance costs are evenly distributed throughout the year. All excess capacity not used by the municipalities will be made available to the state.4 as a major uncerAnother major assumption, as well tainty, is how the electricity market will operate. We assume that after actions by the state government the electricity market will stabilize in the post-2002 time frame, The goal of current policies is to return costs to what they were in the first two years of the restructured market (1998 and 1999). Policy makers assume that during that time market bid prices approximated the cost of production (Borenstein, Bushnell, and Wolak, 2000). As a starting reference point, we assume that each generator would be paid its marginal cost.' Scenarios that modify this reference point are discussed later in this report, as are other assumptions made for modeling purposes.
Finally, uncertainty in emissions costs is included in the model, as emissions costs do have significant impact on generation prices. The analysis encompasses the impact of a broad range of NOx prices ranging from $5 to $50 per pound. We assume that the municipalities would purchase all of the NOx emissions credits needed to run their plants. This is an overestimation, as each plant receives an initial allotment of NOx credits. PM10 (particulate matter of size 10 microns or less) costs are also included in the model, but because PM10 impacts costs less than NOx does, the PM10 costs are included as a fixed estimate.
Among the major uncertainties are future natural gas prices, which are the most significant portion of the generation costs. To reflect this uncertainty, we use four natural gas price scenarios with prices ranging from $2.50 per MMBtu to $10 per MMBtu. Current prices at the Southern California border are about $12 per MMBtu, although most forecasts stabilize natural gas prices at about $5 to $6 per MMBtu.
Baseline Generation Prices-Summer, Glendale ($/MWh)
Using the data provided by Bibb and Associates, we computed generation costs for each plant during each season for a variety of natural gas and NOx costs. Sample prices for the proposed new municipal generation are given in Figure 6. This figure shows how the generation costs in dollars per MWh vary with changes in assumptions about natural gas and NOx credits prices. Each band in the figure represents a range of market prices. For example, for the GE 7FA units using duct burners, if gas costs $5 per MMBtu and NOx credits are $20 per pound, the cost of generating power would be in the range of $50 to $75 per MWh.
55 50 45 Z 40
Another important uncertainty in the model is the-.9 anticipated growth in demand. The California ISO, responsible for maintaining the transmission grid in the state, maintains an archive of the total demand on the grid for each hour.6 Given the hourly demand from 1999, we add an additional annual demand growth factor, which we vary from 1 to 4 percent per year.
35 0-
30 2 25 0 x 20 z .2
"V
10 5
Beginning with the marginal costs of generation, we build a supply curve of power costs. There is debate over whether these marginal costs of supplying power will be the basis for costs, and some of the literature describes analyses of the California market that have led to different conclusions. To capture that uncertainty, we run a number of scenarios that vary this supply curve and represent different options for how the market may operate in the future.
0 0
1
2
3
4
5
6
7
8
9
10
11
12
Natural Gas Price ($/MMBtu)
0 0-25 U 25-50
0l 50-75
0 75-100
El 100-1251
Figure 6- Sample Market Pricesfor the Proposed Municipal Generation
Modeling the Operation of the Electricity Market
4 The municipalities intend to charge the state their generation costs plus a reason-
providing this data.
With the recent shutdown of the California Power Exchange (PX), a central market no longer exists for the short-term buying and selling of power in California. Despite the current instabilities and scarcity in generation,
6See http:/ /www.caiso.com/marketops/OASIS/pubmkt2.html
we believe that in the near future there will be cost-plus
able rate of return. Information on how the municipal utilities provide service was provided by the utilities themselves.
5 Many thanks to James Bushnell at the University of California Energy Institute for
6
pricing for electricity purchases in California. Using data from the University of California Energy Institute, the PX, and the California ISO, we developed a model to predict power prices in this new electricity market. arkt, e bult suplyfrom To mdeltheeletricty curve based on generation costs and simulated the dispatching of power plants based on these costs. We assume that the generators who bid into the market previously will continue to make their capacity available to the electricity market in the near future, with modifications to their costs based on natural gas prices, emissions costs, and inflation. A schematic of the model is shown in Figure 7.
tracted, and some hydroelectric power) in addition to geothermal and other hydroelectric generation. To estimate the amount of capacity of these types of generation available each hour, we used the amount of "price-taker" supply bids 5 the day-ahead market of the California PX. "Pricen eo en at a price.o wouddisptchthei enrg thaeteyaor taing" inththewoldspchhirnrgatnyrc. These price-taker bids included the nuclear facilities owned by IOUs (investor-owned utilities, such as Pacific Gas and Electric and Southern California Edison) in addition to much of the available geothermal and hydroelectric generation. We assume that another portion of the demand (about 12,000 MW) will be fulfilled through contracts with "qualifying facilities"-small generators that qualified under an earlier federal rule to operate independently of the electric utilities. The remaining demand for each hour is satisfied by fossil-fuel-fired power plants on the electricity market.
GBP Generation
E A
EB Gneration
NewGenraio
Marerity
Contracts
BDead
In our model, the least-expensive generation available mn the market is dispatched until all demand is satisfied. If is insufficient supply available in the market for that hour, the remaining supply is purchased on the spot mar-
Caifri Dean
Modelthere
E~GeeratoZ["Pric Powe Prie Note: BGP
= Burbank,
ket at $500 per MI(Vh.
Facors
Results of the Model
sThe
The model was run under multiple scenarios, and it generated a broad range of outcomes. For each set of vaniables, the model was run with and without the proposed new municipal generation. The variables included the
Glendale, Pasadena
Figure 7- Schematic of the Power Pricing Model
following: 0 Natural gas prices from $2.50 to $10 per MMBtu * NOx prices from $5 to $50 per pound * Demand growth from 1 to 4 percent per year Vaynthsupyrieplsndmus1prct *Vrigtespl and rcspu percent miu20 ad2 ecn a Duct burners running or not running. Apasbesto supin ih aetepieo natua plausibltesetr ofasumtuernions frmih hav the$pricepof na~turaasithe nriea ofutuxredrning frombbu $50 to $7.50e MMr tun,the priemn ofN gredits to be about $20 preto $35 pear.pUndr andsdemanasmtions grwt bhe vabout 2fphernter yeerar.o Unde this staet of Cassmpiforns, thelvale ofetheene gnrto otesaeo aionawudb ewe $466.7 million and $584.9 million over the ten-year period from 2002 through 2011. These dollar figures represent savings of about $5.30 to $6.64 per MWh of new generation. We include other fuel and emission prices and
We also include in this model two types of new generation: the generation from Burbank, Glendale, and Pasadena, and the generation from other plants coming online in California in the near future, as projected by the CEC. The cost of the three cities' new generation is based on capital, operating, fuel, and emissions costs. As most of the new generation reported by the CEC is natural gaspowered, we modeled its price using a similar method, but modified it to include a differential in the cost of capital and the time to repay loans . 7 Because one of the advantages of load-centered generation is that transmission losses are reduced, the model gives a benefit to LCG to reflect the fact that a higher proportion of electricity from these load-centered plants, as opposed to distant plants, will be available to end users. A portion of the demand estimated for the future will be satisfied by "must-take" generation (electricity the state is required to take, for example nuclear, long-term con7 eassume that the municipal utilities will float 20-year bonds and that interest rates available to private investors are 3 percent higher than municipal rates and require a ten-year payback. These numbers are based on personal communications with GBH Investors.
8 Before closing down, the PX maintained an archive of all supply and demand bids for each hour from its Day-Ahead market. For our model, we used the amounts of price-taker bids from each hour in 1999.
7
Duct Burners on GE 7FAs Used
10=
=
Duct Burners on GE 7FAs Used
10M
=...
7.5 I$5oo•Il••.•1,84.9M I I 5$432,IM
7i,•,,,, .5 S
[$499.7M
I$6.7M
--
5
20
D 2.5
35 NOx ($/Ib)
50
Duct Burners on GE 7FAs Not Used
10 546>0.2M
$573.2M
2 7.5 $427
5
52
20
M
35
$400M-$500M $500M-$600M
]
$60oM-$700M
fl
$700M
El
Savings per MWh
$
$667
$13
$4.32
$47lF~
5
20
5$532.6M $4.90
(D25 $8.000
$6
20
NOx ($/Ib)
35
50
NOx ($/Ib)
Value of New Generation
Savings per MWh of New Generation
Figure8-Comparingthe Value of and Savingsfrom the New Municipal Generation With and Without the Use of Duct Burners9 demand growth case rates to illustrate how changes in the quantities of fuel prices, emissions prices, and demand growth affect the value of the new municipal generation. There are a considerable number of benefits unacTher ar a onsderblenumbr o beefis uac-reduced The model does not factor in counted for in this analysis. eneitsof any oherthanthecos any benefits of LCG other thanLG the cost savngsderved savings derived from avoiding transmission losses. In addition, we used
change with changes in the supply curves caused by increasing and decreasing the supply prices (not including the new generation) by 10 percent and 20 percent. Except for two cases in which the supply prices are by 20 percent (a somewhat unrealistic scenario soefar ely prethisupl becedsuppliers w ou suppliers would rarely price their supply so far because under their generation costs), these changes in the supply by saleo the newngenrin do notat th urve do curve not affect the value of the new generation by
optimistic assumptions provided by the CEC about the If we had projected supply of new, non-municipal power. used less-optimistic projections of supply, the value of the generation provided by the new plants and the cost savings the new plants provide would be even higher.
Q
0.0
As illustrated in Figure 8 above, the value of the new generation increases slightly if the duct burners on the
3
-5.00%
5.00%
z.
GE 7FA units are used during the summer and winter,
-
-1 0
assuming a 2 percent growth in annual demand. However, the average savings per MWh of new generation are reduced when the duct burners are used. Although more supply is added to the market, the increases in heat rate
$7.50 Gas, $35 NOx
0
15.00%
-
•
and emissions add enough to the GE 7FA generation price to reduce the average savings of the generation to the state. (The most likely future price scenarios are surrounded by a dotted line in the figure.)
G
-
-20.00%
-
-25.00%
It might be the case that bids will not approximate the cost of generation; therefore, Figure 9 shows how the estimated value of the new municipal generation would
1 -10%
00% 110% 20% 20% Change in Supply Bid Prices of Old Fossil Fuel-Fired Generation
_ -20%
Figure 9--Comparingthe Effects of Changingthe Supply Price Curve on the Value of New Municipal Generation
10 For the two cases in which the value of the new municipal generation drops by 9 Unless stated otherwise, for the following figures in this chapter we assume that the duct burners on the baseline plants are used during the summer and winter and that statewide annual demand growth is 2 percent.
more than 10 percent, the generation costs for much of the old generation are less than the price of the new generation, therefore the new generation gets dispatched far less frequently.
8
-
Figure 10 illustrates how statewide annual demand growth rates of 1 percent, 2 percent, and 4 percent would affect the value of the new municipal generation. (The best-estimate values are surrounded by a dotted line.) The difference between a 1 percent annual growth rate and 4 percent annual growth rate in the best-estimate value of the generation ranges from $311.8 million to $1.52 billion over the ten-year period.
120 $7.50 Gas, $35 NOx $7.50 Gas, $20 NOx ---N- $5 Gas, $35 NOx
@
100
80
--P--
a 60 6G 40 0)
Due to increases in annual demand and the fact that little new generation is planned to come online after 2003, the value of the new municipal generation increases conthe total savsiderably from year to year. Figure 11 shows
20
0
ings accrued during each year from 2002 to 2011 for four different natural gas and NOx price scenarios.
20
2004 2
2
2
2
2
2
2
Figure 11-Annual Savings from New Municipal Generation, 2002 to 2011
1% Annual Demand Growth 1
$405.M
10
$0...
$421.3M
.
7.$366.6Mo
$437.7M
describes previous studies that estimated the cost savings plants might provide; however, the quality of those
$454.wM
.the
$344.5M
studies is inconsistent. Accordingly, this section summarizes the content of the literature without endorsing the conclusions of the studies.
$289.8
What Is LCG?
$399.2M
5 CU
5
$293.0M
2.5 $64.4M
$311.8M
$257.1M
5
20
3282M
$7.
35 NOx ($/Ib)
50
The current electricity supply market includes many
2% Annual Demand Growth
Total Savings $300M El
10 -
$1.21 3
While LCG is not precisely defined, it occupies the
NOx ($/Ib)
middle ground between conventional central station genand the emerging paradigm of distributed generation (DG). Central station power plants are quite large,
4% Annual Demand Growth
--$-49
10"
$1 .52
7.5 1$1238
$
-------
1I
•eration
taking advantage of traditional economies of scale in electricity generation, and are designed to feed into the transgrid at high voltages, principally supplying the electricity system rather than particular loads. In contrast, distributed generation employs recent advances in smallscale electricity generation to install generators"' in the
$1
1
n 5$mission 2.5
$276 OM
$697.7M
5
20NOx ($/Ib)35
large power plants that are sited in remote areas, far from the customers they serve. Such siting allows for lower land acquisition costs and easier compliance with environmental regulations than does siting plants in or near densely areas, but it can place a heavy burden on the transmission system. The concept of load-centered generation means capacity close to the demand, or building "load," ingenerating moderate-sized generating units.
50
facilities of customers to supply their own base load, peak load, or standby power. As a third alternative to central Figure 10- Comparingthe Value of New Municipal Generation
Given Different Rates of Growth of Statewide Annual Demand
stioandsrbuegnrtoLC povesowro a larger region (or larger facilities) than DG, but shares much of its flexibility and reliability. Table 2 illustrates the roles played by the three generation schemes.
LOAD-CENTERED GENERATION: A REVIEW OF THE LITERATURE The literature about LCG describes several benefits that are not explicitly captured in our model, as many are site-specific and difficult to model. The literature also
Most distributed generators in use are diesel-powered reciprocating engines, but a suite of advanced technologies are now or will soon be available, including natural gas-powered microturbines, solar photovoltaics, and fuel cells.
9
Typical Unit Capacity
Generation Scheme
Typical Siting
Central station
Rural area
> 400
Load-centered
City, large facility
Distributed
Building substation
traditionally satisfied state requirements that utilities serve
Typical Voltage Transmission (>115 kV)
their native loads, but new transmission assets today are more likely to benefit a larger electric market. The North American Electric Reliability Council (NERC) has estimated that annual investments in new transmission facili-
20-400 MW
Subtransmission (69-138 kV)
ties have been declining by about $100 million a year for the past two decades; in the same period, load growth has been increasing.